Al-Tawfiq, J. A. (2013). Middle East respiratory syndrome-coronavirus infection: an overview. Journal of Infection and Public Health, 6, 319–322. https://doi.org/https://doi.org/10.1016/j.jiph.2013.06.001
Problem Statement
Coronaviruses are a common cause of up respiratory infections in humans. Strains endemic to the human population circulate continuously among children and adults worldwide with infection trends typified by seasonality and mild symptoms in healthy individuals.
The new millennium, however, has marked the emergence via zoonosis of two highly virulent coronavirus strains novel to the human population.
- In 2003, a novel coronavirus (CoV) emerged in China that caused a new and deadly outbreak of respiratory disease in humans termed as Severe Acute Respiratory Syndrome (SARS-CoV).
- More recently in April of 2012, an outbreak of severe respiratory viral illnesses localized in several intensive care units occurred in the Arabian Peninsula countries including Saudi Arabia, Qatar, and the United Arab Emirates, with rapid movement further into 20 additional countries in North Africa and Europe (Al-Tawfiq, 2013; Breban et al., 2013). Transmission of MERS-CoV is thought to occur via infectious aerosolized particles, though potential transmission routes have not been well characterized. Due to this potential transmission route and high mortality (e.g., 19.6% in South Korea and higher in other locations), there are concerns about the global spread of MERS-CoV.
In the South Korean outbreak, nearly all cases were spread within a hospital setting. Thus, the aim of this study is to characterize the risk of infection from respirable MERS-CoV in a Korean hospital room using Quantitative Microbiological Risk Assessment methods (QMRA).
Problem Formulation
Recently, a cluster of MERS-CoV cases arose in South Korea during May of 2015. The visitation of a single index patient to five different hospitals is believed to have resulted in 185 downstream nosocomial cases of MERS-CoV (WHO, 2015; Cowling et al., 2015; Park et al.,2015), although confirmatory phylogenetic analyses have not yet been performed. Unlike the previously documented case clusters, the South Korean outbreak has been well-documented with regards to incubation time, transmission chains (i.e. 28 first generation cases, 125 second generation cases, and 32 third generation cases) and contact tracing of infected patients (Cowling et al., 2015; Park et al., 2015; Ki, 2015). The majority of infections were hospital-acquired - only one of the 186 patients in the South Korean cluster are believed to have been infected outside of the hospital, and two other individuals were infected by modes of transmission that are currently unknown (Ki, 2015).
Thus, the objective of the project was to quantify the risk of infection associated with exposure via aerosol inhalation of MERS-CoV in a four-patient capacity hospital room setting.
Stakeholders
The stakeholders in the MERS-CoV aerosol transmission risk assessment model follow:
- Patients not infected with MERS-CoV at the time of admission, co-residing in the same room as one patient currently infected with MERS-CoV. In South Korea, over 50% of the hospital rooms have 4 or more beds. The current model assumes a 4-patient capacity room containing 1 infected patient, and three non-infected patients.
- Healthcare workers (HCW) in the hospital setting (e.g. doctors, nurses, and nurse practitioners) not infected with MERS-CoV upon entry into the system defined by the model (i.e. 4-patient hospital room). For the current project, risk has been calculated for two separate groups: 1) nurses, and 2) all other healthcare workers including doctors, nurse practitioners, and nursing assistants.
- Family visitors to a hospital room containing one patient infected with MERS-CoV (plus 3 non-infected patients). The family members of patients provide palliative care, and patients often receive many visitors due to cultural norms (Ki, 2015).
Hazard Identification
The virus
Middle Eastern Respiratory Syndrome Coronavirus (MERS-CoV), belong to the Coronaviridae family of enveloped, positive-stranded RNA viruses. MERS-CoV is an enveloped virus containing a (+) sense single-stranded mRNA.
Source of MERS-CoV
MERS-CoV comes from bats, which make them as the identified natural reservoir. But camels may be an intermediate animal reservoir as well. A human can become infected after being in contact with these infected animals.
Transmission route
The transmission between humans occurs through a person-to-person pathway via infectious aerosolized particles. Alternative routes such as fecal-oral have not yet been proven.
Attack rates
The MERS-CoV attack rate appears to be cluster-dependent:
- In the hospital setting, it ranges from 1.1% (Al-Tawfiq, 2015) to 10% (Al-Abdallat,2014).
- In family/contacts of patients, it ranges from 3.6% (Al-Tawfiq 2015) to 5% (Memish).
Types of Disease Resulting from Infection
- Moderate infections: fever, cough, sore throat, headache, and occasionally nausea, vomiting, and diarrhea
- Severe infections: above symptoms combined with shortness of breath, pneumonia, and potentially death (Banik et al. 2015)
Incubation Period in Days
The incubation period ranges from 2 to 15 days (median: 5) (Banik et al. 2015)
Morbidity Rates
The reported morbidity rate is to 1.08% (Ki 2015)
Mortality Rates
- Overall mortality rate (all infected patients): 19.4%
- Mortality rate in patients without underlying conditions: 9.2%
- Mortality rate in patients with underlying conditions: 33.8%
- Mortality rate in patients > 60 years of age: 38.1%
- Mortality rate in patients < 60 years of age: 6.4%
Exposure Assessment
Exposure Scenario
The basis of the exposure scenario involves a symptomatic patient infected with MERS-CoV who has been admitted to a hospital and housed in a patient room without implementation of isolation or quarantine procedures. We assumed that all exposed people were susceptible to infection and that all infections led to illness (or death). A dimensional point estimate for the size of a typical hospital room was set for the model at 230 m3 - 4 times the single patient room size noted in Yin 2011. Hospital rooms in South Korea often contain up to four beds, therefore the aforementioned room size was multiplied by a factor of 4 (230 m3) to account for the increase in size (Ki 2015). Since the symptomatic patient is the source of infection within the room, the risk of infection to individuals in several exposure scenarios was considered: 1) other patients in the room (assuming a 24 hour exposure) (Ki et al 2015), 2) nurses and other healthcare workers (e.g. doctors) based on their frequency and timing of visits (assumed from distributions mentioned by Cohen et al. (2012), and 3) family visitors based on the frequency and timing of visits (assumed from distributions mentioned by Cohen et al. (2012). Due to the wide range of minutes per visit reported by Cohen et al. (2012) (median = 3 minutes, range = 1 to 120 minutes), a point estimate of 3 minutes per visit was employed for the exposure model. This value, while conservative, was selected for two reasons: 1) a lack of data in the literature for such a parameter, 2) the resulting value of >60 minutes per hour when the visit length range was fit to a triangular distribution. MERS-CoV is thought to be transmitted primarily via aerosols in a manner similar to endemic human respiratory coronavirus strains such as 229E and OC43. For the present assessment scenario, only the risk of infection from aerosolized particles and droplets expelled by patient coughing was considered. However, fomites may serve as a potential reservoir for MERS-CoV due to the settling of aerosols after release from infected persons by processes such as coughing and sneezing.
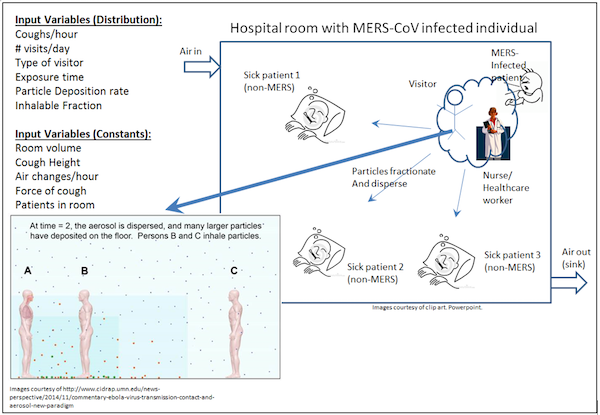
Figure 1. Exposure scenario
Dose Response
To date, no MERS dose-response model has been determined. In this study, the SARS dose-response model (Huang, QMRA Wiki, 2013) was employed as a surrogate for MERS dose-response. MERS has several similarities to SARS virus: both have an animal origin and appeared around 2002 in approximately the same region (Asia and Middle East) (Sutton 2015); both are respiratory coronaviruses with the same transmission mode, and have a comparable protein structure for binding host cells (Lu 2015). Despite probable differences in attack rates (infection rate) and mortality rate between the two viruses, it is assumed in this study that the SARS dose-response model is the best available model for MERS. SARS dose-response model, from the QMRA Wiki database, were reviewed (Huang 2013, DeDiego 2008, De Albuquerque 2006, Watanabe 2010), and a SARS dose-response model based on two animal studies was selected (DeDiego 2008, De Albuquerque 2006).
The considered SARS dose-response model used for the MERS virus shows an exponential correlation between exposure dose (tabled in PFU) and the endpoint response (death in mice). Since only animal models are available from the literature, the unique endpoint responses findable for these models are the death of the considered animal. For translating this animal dose-response to a human dose-response, a generally accepted assumption has been applied, stating that an animal model with a death endpoint can be used for looking at the human risk of infection endpoint. As an exponential model, the general equation is as following: P(response)=1-exp(-k*dose)
Table 1. Parameter used in Dose-Exposure model

Since it has been used a SARS dose-response model, we modeled the k value with a normal distribution based on the 5th, 50th (median) and 95th percentile in order to better represent the variability impact of this model on the risk of infection endpoint.
Risk Characterization
The risk characterization has been calculated, based on the previous exposure assessment and dose-response model presented in the relevant sections.
Exposure Dose = (concentration of MERS-CoV in the saliva)* (saliva volume/cough)*(cough times/day)*(concentration of MERS-CoV inhaled from aerosols - f(aerosol size, ventilation rate))*(air inhaled rate)*(time spent/visit)* (visit frequency/day)
The exponential model as described in section 3.2 was applied to quantify the infection risk of the different group of people in the hospital context.
Risk=1-exp(-k*dose)
Based on the results of the risk assessment, the risks of infection for each type of visitors were estimated (Table 2). Family members had the highest risks than other groups (r=1.25E-02), as they were considered to contact with MERS-infected patients closely with long exposure time (median=288 min/day). Both nurse and healthcare personnel were close contacted with MERS-infected patients as well since they had to an exam or take samples from patients. The exposure time was 54 and 83 min /day for nurse and healthcare, respectively. Another patient in the same room would be exposed to MERS; however, without close contact, the risk of infection was actually lower than the other three type of visitors (7.04E-04).
Table 2. Daily Risk of MERS Infection After Visiting A Confirmed MERS Patient in A Hospital
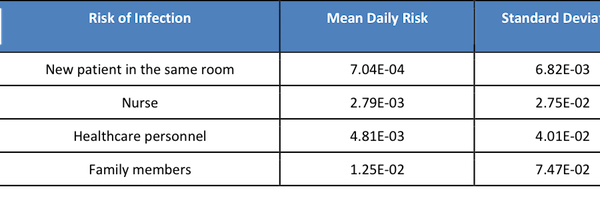
Table 3. The probability of mortality or recovery for a family member visiting a hospital (all co-morbidity scenarios).
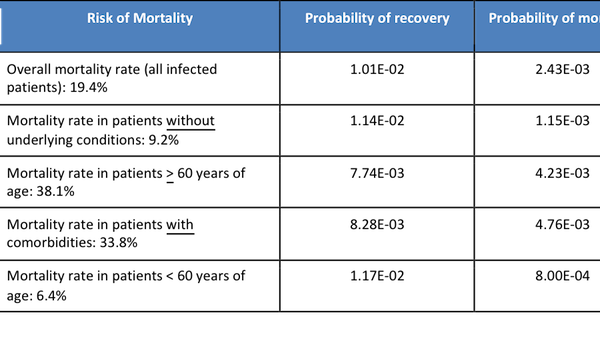
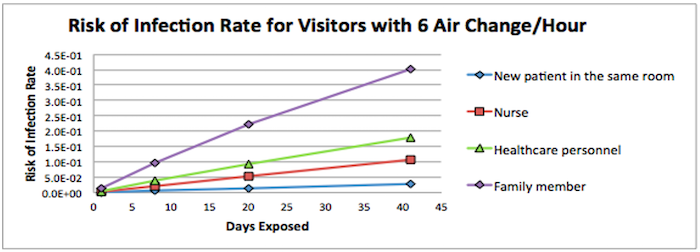
Figure 2. Risk of Infection Rate for Visitors with 6 Air Changes over the Days Exposed
The discharge days for MERS-infected patients were ranging from 8-41 with median of 20. Figure 1 indicates that the risks of getting infected by continuously contacting with MERS-infected patients were increasing over the time. On day 1, another patient who shared the room with MERS-infected patient had the lower risk of infection than other visitors. However, they were more likely to get infected after 8-day exposure with the higher rate than healthcare workers and nurses, as they were 24 hours/day staying with the MERS-infected patient.
Based on our model, visiting family members were at the highest daily risk of infection (1.25E-02), followed by healthcare personnel (4.81E-03), nurses (2.79E-03), and finally patients who stayed in the same room as the MERS-infected patient (7.04E-04).
Uncertainty and Sensitivity Analysis
Several model parameters included uncertainty in their values, and this uncertainty was stochastically captured via the aforementioned Monte Carlo simulation approach. Ten thousand simulations were conducted for the initial risk assessment to evaluate the model sensitivity to the parameters distributions. The below figures show the sensitivity analyses for each of the evaluated populations. A parameter with a greater score indicates that the parameter’s distribution has a greater effect on the risk for the population in question. While many parameters were modeled stochastically, only the most sensitive parameters are shown in the below figures (base case scenario, for 6 air exchanges/hr), which include the following:
- Aerosol concentration (“Fraction of inhalable aerosols”), which represents the viral number per volume air (i.e., viral concentration in the air; # viruses/m3) for inspirable droplets, which only represent an exposure scenario persons in close contact with the infected patient (i.e., nurses, healthcare workers, and personal visitors).
- Initial viral concentration (“PFU/mL”) in the infected patient’s saliva
- Number of coughs per day
- Visitation frequency (i.e., # visits/hour)
- Probability of the healthcare workers visiting the infected patient vs. another hospital patient
- k: probability of organism being ingested and surviving within the host until it reaches and infects the host in the appropriate location
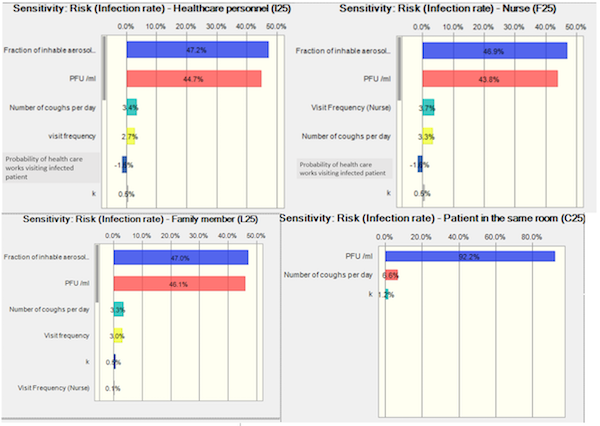
Figure 3. Sensitivity analysis of risk assessment
Based on the sensitivity analyses in our study, the greatest sensitivity for risk of infections (>90%) of healthcare workers, nurses, and family members is due to the viral concentration in the air (# viruses/m3) and the initial concentration of viruses of the infected patient saliva; given a constant ventilation exchange rate. It is unsurprising that the viral concentration in the air is found to be the most sensitive parameter for close contact exposure risk, given that it, along with visitation frequency and duration, constitute dose. Among the factors that contribute to viral concentration in the air (i.e., viral concentration in saliva, cough frequency, air exchange rate, and bootstrapped droplet number frequencies), viral concentration covers a broader distribution (~five orders of magnitude), which is substantially broader than the other parameters. The virus concentrations of the index patient contribute 92.2% of the sensitivity of the infection risk of the new patient sharing the same room; coughing frequency was also a sensitive parameter for MERS-uninfected patient sharing the same room who is continuously exposed to respirable droplets.
A form of uncertainty not captured in our model is the volume of saliva produced in a cough (i.e. which will impact the number of viruses released into the environment). The only way that we are capturing the uncertainty in the number of particles in the respirable and inhalable size fraction of the droplets and aerosols is by bootstrapping the number of droplets in each of the size fractions.
Risk Management & Communication
Strategy 1 - Air change
By increasing the air change rate, a portion of the suspending MERS viral particles are removed out from the room, reducing the levels of MERS in the air (Table 4). In this way, the exposure dose will be reduced substantially. The risk of infection for patients sharing the same room was reduced by approximately 50% (Table 5). However, for close contact, the risks of infection for visitors including the nurse, healthcare personnel, and family members were remained with slightly decreasing, indicating the importance of personal protective equipment if close contact is needed.
Table 4. Daily Risk of MERS Infection after Visiting A Confirmed MERS Patient in A Hospital with Intervention (12 Air Change/Hour)

Table 5. Ratio of Daily Risk of MERS Infection after Visiting A Confirmed MERS Patient in A Hospital with Intervention between 12 and 6 Air Change/Hour

Strategy 2 - Masks for healthcare workers
By wearing masks, the exposure dose was reduced by 1-2 log, and risks of infection substantially dropped (Table 6). The degree of reduction was similar between each type of visitors (Table 7) indicating masks could significantly prevent virus droplets in the air with close contact. Therefore, visitors should always have personal protective equipment.
Table 6. Daily Risk of MERS Infection After Visiting A Confirmed MERS Patient in A Hospital with Intervention (Mask)
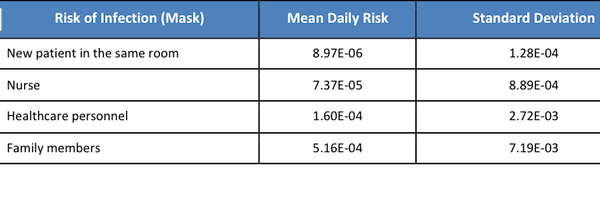
Table 7. Ratio of Daily Risk of MERS Infection after Visiting A Confirmed MERS Patient in A Hospital with Intervention between Mask and without Mask

Risk Perception
With headlines such as “MERS-CoV May Become a Pandemic Threat, Experts Warn” (Medscape, 2014), and “Mers - will it start the next global pandemic?” (The Guardian, 2013) surfaced in the earlier days of the MERS outbreak, there has been a consensus for some time in the scientific community that MERS does not currently pose pandemic risk. However, the mortality rate is quite high, playing to fears of infection and leading many people to take intensive precautions. For instance, thousands of schools were temporarily closed due to fear of the virus (Wikipedia 2015) and over 100,000 tourists have canceled visits to S. Korea since the outbreak began (CNN International 2015). The outbreak has also had significant economic impact on the S. Korean economy: interest rates in S. Korea were cut by 0.25% ( partially considered to be in response to the MERS) (BBC 2015), retail stores have seen sales drop over 16% since the MERS outbreak (CNN International 2015).
Risk Communication Strategy
- Meetings with departments of community health to discuss best practices and factors contributing to infection transmission.
- Staff meetings at hospitals in Korea to discuss best practices, including limiting non-essential visits to patient rooms and effective management strategies.
- Support group for people with infected family members to discuss best practices for protection should they visit.
- Make all information available to the public via government website and public service announcements.
References
-
-
Breban, R. ., Riou, J. ., & Fontanet, A. . (2013). Interhuman transmissibility of Middle East respiratory syndrome coronavirus: estimation of pandemic risk. The Lancet, 382, 694–699. https://doi.org/10.1016/S0140-6736(13)61492-0
-
Cowling, B. J., Park, M. ., Fang, V. J., Wu, P. ., Leung, G. M., & Wu, J. T. (2015). Preliminary epidemiologic assessment of MERS-CoV outbreak in South Korea, May–June 2015. Euro Surveillance: Bulletin Europeen Sur Les Maladies Transmissibles= European Communicable Disease Bulletin, 20. https://doi.org/10.2807/1560-7917.es2015.20.25.21163
-
Al-Tawfiq, J. A., & Perl, T. M. (2015). Middle East respiratory syndrome coronavirus in healthcare settings. Current Opinion in Infectious Diseases, 28, 392–396. https://doi.org/10.1097/QCO.0000000000000178
-
Al-Abdallat, M. M., Payne, D. C., Alqasrawi, S. ., Rha, B. ., Tohme, R. A., … Abedi, G. R. (2014). Hospital-associated outbreak of Middle East respiratory syndrome coronavirus: a serologic, epidemiologic, and clinical description. Clinical Infectious Diseases, 59, 1225–1233. https://doi.org/10.1093/cid/ciu359
-
Banik, G. ., Khandaker, G. ., & Rashid, H. . (2015). Middle East respiratory syndrome coronavirus “MERS-CoV”: current knowledge gaps. Paediatric Respiratory Reviews, 16, 197–202. https://doi.org/https://doi.org/10.1016/j.prrv.2015.04.002
-
Cohen, B. ., Hyman, S. ., Rosenberg, L. ., & Larson, E. . (2012). Frequency of patient contact with health care personnel and visitors: implications for infection prevention. The Joint Commission Journal on Quality and Patient Safety, 38, 560–565. https://doi.org/https://doi.org/10.1016/S1553-7250(12)38073-2
-
DeDiego, M. L., Pewe, L. ., Alvarez, E. ., Rejas, M. T., Perlman, S. ., & Enjuanes, L. . (2008). Pathogenicity of severe acute respiratory coronavirus deletion mutants in hACE-2 transgenic mice. Virology., 376, 2. https://doi.org/10.1016/j.virol.2008.03.005
-
Albuquerque, N. D., Baig, E. ., Ma, X. ., Zhang, J. ., He, W. ., Rowe, A. ., … Levy, G. A. (2006). Murine Hepatitis Virus Strain 1 Produces a Clinically Relevant Model of Severe Acute Respiratory Syndrome in A/J Mice. Journal of Virology, 80, 21. https://doi.org/10.1128/JVI.00747-06