Authors: Ana C Espinosa Garcia, Eliana Suzuki, Irma N G Rivera, Kristen Pogreba-Brown, Marc Paul Verhougstraete, Marisa Elisa Magri
Disclaimer: The following case study progressed to a peer-reviewed publication. Final QMRA details and results can be found at http://dx.doi.org/10.1016/j.watres.2015.09.001 and may differ from the work presented here.
Problem Statement
Recreational waters are often threated by various source of fecal pollution. Indicator organisms are frequently used to monitor surface waters for the presence of fecal contamination. In the 1950's, epidemiological studies described increased illness incidences in swimmers compared to non-swimmers using fecal coliforms (Stevenson, 1953), whereas in the 1980's epidemiological studies found increased risks of gastrointestinal illness to be more associated with levels of E. coli and enterococci (Dufour et al, 1984 and Cabelli et al., 1982). Ecoli and enterococci remain the most commonly used fecal indicator bacteria (FIB) for surface water monitoring practices, however despite water monitoring efforts, between 1997 - 2006 there were still 100 outbreaks and 3,021 cases of illness associated with impaired recreational waters in US (Fleisher, 1998).
Engagement in leisure water-related activities are increasing, as are the threats to water quality. Healthcare costs associated with outbreaks and economic impacts from beach closures can be significant. In this case study, a recently conducted epidemiological study in Brazil will be used to define a dose response model for Brazil specifically, and then predicted gastrointestinal illnesses will be compared using the Brazilian and World Health Organization dose response models based on enterococci data for beaches in three distinct countries: Brazil, Venezuela, and the U.S.
Hazard Identification
Studies around the world showed that enterococci are good predictors of GI illnesses in marine and fresh recreational waters. A direct linear relationship was observed in many studies between highly credibe gastrointestinal illness (HCGI) cases and bacterial densities of two indicators - Enterococci and E.coli [6,7]. Of note, HCGI cases are defined as one or more of the following symptoms: vomiting, diarrhea with fever, or stomach ache with nausea and fever.
This case study relies upon enterococci data from three popular beach regions to make inferences about potential gastrointestinal risks.
Exposure Assessment
Characterization of the Study Areas
Human-impacted beaches in Venezuela, Brazil, and the U.S. were analyzed in this study. Maps of the study location and region-specific sources of contamination are shown in Figures 1-5.
Venezuela
There are seven sampling sites in the Morrocoy National Park used to inform the water quality of the national park's beaches.
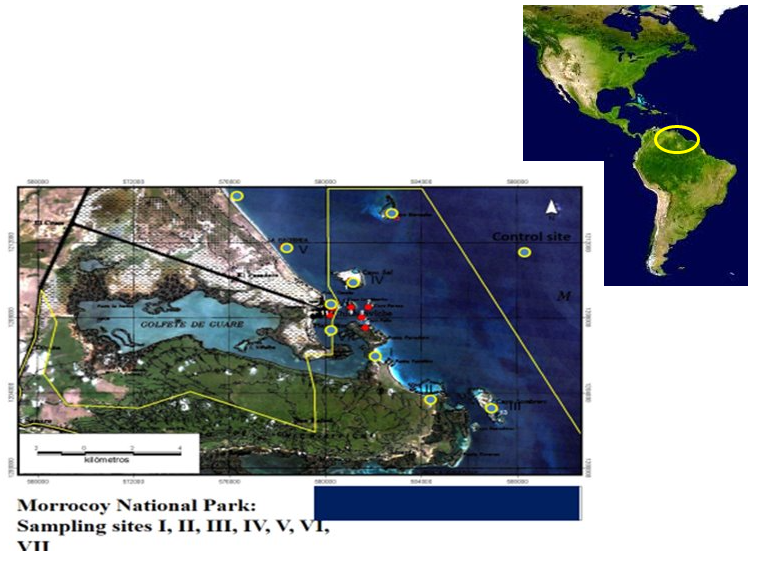
Figure 1: Study Areas, Beaches: Varadero, Mayorquina, Sombrero, Sal, Muerto Playa Ninos and Playa Sur
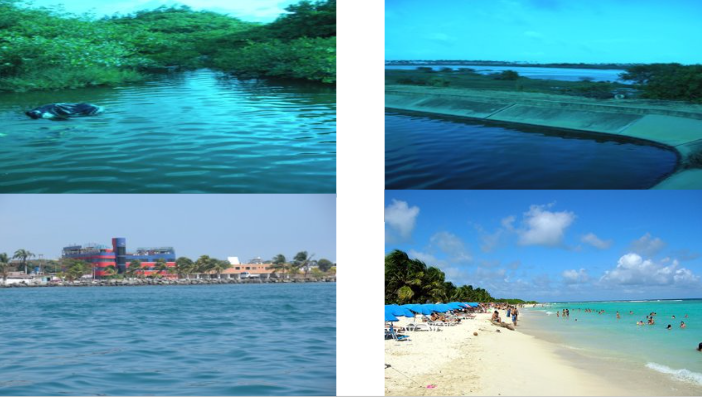
Figure 2: Study Areas(Left to Right, Top to Bottom): Solid Waste in Stream discharges, Poorly Maintenance stabilization pond, Resorts, Beaches
Brazil
There are over 1 million habitants in the regions of interest (Bertioga, Guarujá, Praia Grande and Santos), and the water quality classification for the majority of these areas is considered "regular" or "bad".
Figure 3: Guarujá(left) and Santos(right) WHO water quality classification

Figure 4: Praia Grande(left) and Bertioga(right) WHO water quality classification
United States
Newport Beach has a permanent popoulation of 86.000, but in the summer there are 20.000 to 100.000 tourists daily. The water is impacted by two wastewater treatment plants outputting 756 mil Liters/day of treated wastewater, and 264 mil Liters/day of reclaimed water.
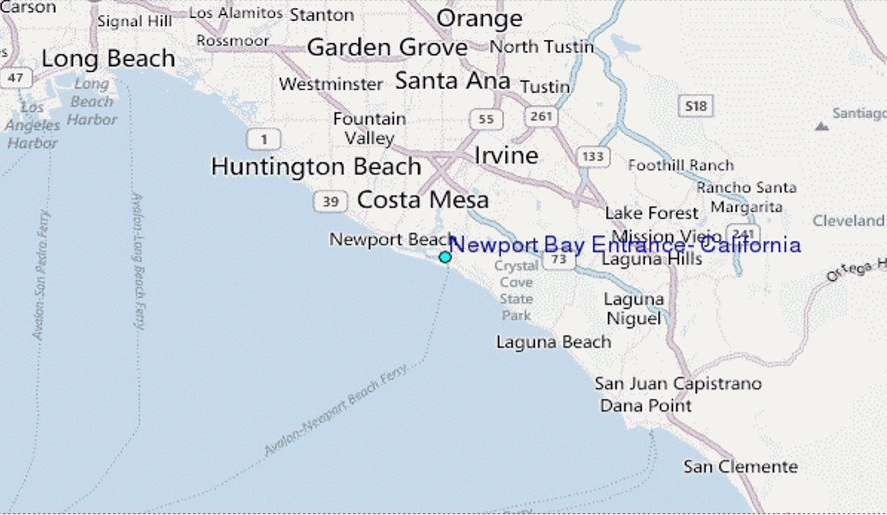
Figure 5: Newport Beach, CA, USA
Concentrations of Enterococci
Enterococci sampling data (CFU/100mL) from each location (Figures 6-8) was used to inform distributions of the concentration of enterococci in the recreational waters. Maximum Likelihood Estimation (MLE) methods and MatLab were used to fit distributions to the sampling data. The final distribution form and the relevant distribution parameters are listed in Table 1.

Figure 6: Enterococci data from beach monitoring, California USA
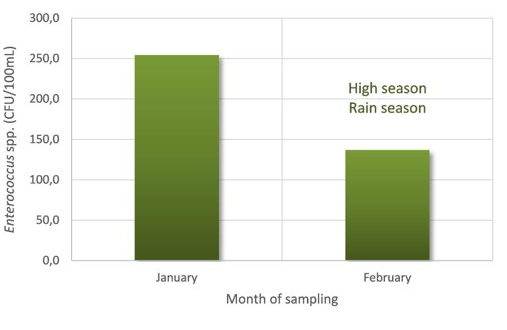
Figure 7: Enterococci data from beach monitoring, São Paulo - Brazil

Figure 8: Enterococci data from beach monitoring, Morrocoy - Venezuela
Table 1: Distribution fitting of raw data from beaches monitoring - Matlab
| Parameters | U.S | Venezuela | Brazil |
|---|---|---|---|
| Distribution | lognormal | lognormal | lognormal |
| Log Likelihood | -4498.55 | -193.509 | -528.838 |
| Mean | 13.0449 | 113.428 | 114.044 |
| Variance | 793.704 | 65279.7 | 154509 |
| mu (std. error) | 1.70131 (0.0361775) | 3.82918 (0.22703) | 3.45876 (0.16067) |
| sigma (std. error) | 1.31688 (0.0255958) | 1.34313 (0.164089) | 1.59864 (0.114481) |
Exposure Routes
Potential exposure routes of interest include the direct ingestion of water while swimming, the ingestion of aerosols, and the indirect or direct ingestion of sand, as shown in Figure 9. The main exposure route of interest is the direct ingestion of water.
Dose Response
In this case study, a recent epidemiological study was used to inform Brazil-specific dose response parameters for enterococci.
Epidemiological Study Summary
Total initial beach interviews: N=23229
Locations, 5 beaches in 5 weeks: Enseada (Bertioga), Pitangueiras and Astúrias (Guarujá), Aparecida (Santos) and Ocian (Praia Grande)
Questions:
- Did you enter the water today?
- Do you usually submerge your head or swallow water?
- Did you have contact with the beach sand?
- Did you eat food prepared on the beach?
Total follow-up interviews: N=16842
- Any symptoms of illness in the 10 days following the beach exposure?
Quantifying Exposure and Illness
Total cases of HCGI: N =1426.
Total number of exposed:
- Enter the water that day (N=13947); no entry (N=2532)
- Usually submerge head and/or swallow water (10158)
Risk was compared between two survey populations: people who entered the water that day & swallowed the water (N=5519 ) versus people who did not enter the water (N=2532). As illustrated in Table 2, children had a higher risk of developing gastrointestinal illness after swimming. There were a range of risks observed across the five beaches. Note that contact with sand is a confounding relationship that needs to be adjusted for in future analyses, and no effect was observed from the consumption of foods prepared at the beach.
Table 2: Basic Results of Epi Study
| Exposure | Relative Risk |
|---|---|
| Swallow water that day vs. no entry into water (all Beaches) |
2,79 |
| Children | 1,48 |
| Adults | 1,06 |
| Beach 1 | 1,22 |
| Beach 2 | 3,36 |
| Beach 3 | 2,19 |
| Beach 4 | 3,64 |
| Beach 5 | 1,87 |
Dose Response Model Comparison
The following equations are the classic dose response models applied in microbial risk assessment: the exponential and beta-Poisson.
\begin{align*} Beta-Poisson: P = 1 - [1 + \frac{C}{N_{50}} \times (2^{\frac{1}{\alpha}} - 1)]^{-\alpha} \end{align*}
\begin{align*} Exponential: P = 1 - exp(-k*C) \end{align*}
\begin{align*} C = Enterococci \ concentration \end{align*}
\begin{align*} N_{50} = Organisms \ required \ to \ infect \ 50\% \ \ of \ population \end{align*}
\begin{align*} k = probability \ of \ enterococci \ surviving \ to \ reach \ and \ infect \end{align*}
The World Health Organization created a dose response model for risk of illness based on enterococci data using a prospective epidemiological study in England (active participants N=1300). The binned data from that study was provided in Kay et al. (1994), and the exponential dose response curve shown in Figure 10a was the best fitting model form for that data. The beta-Poisson model informed by the Brazil epidemiological study described herein is shown in Figure 10b.
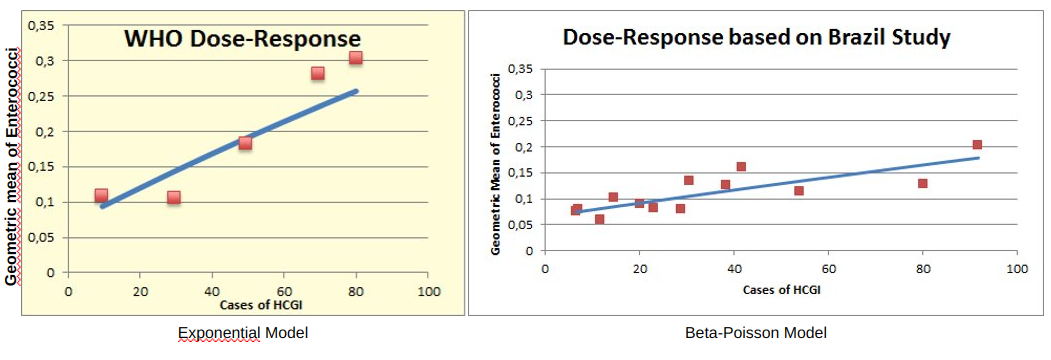
Figure 10: Dose-Response Models fit by a) WHO Exponential(left) and b) this study
Risk Characterization
Using the distributions of enterococci concentrations at the three locations, estimates of ingestion rates while swimming, and the aforementioned dose response models, the risk of illness from swimming was calculated for the Venezuela, Brazil, and U.S. beaches of interest. The distributions of risk are shown in Figures 11-13. The beta-Poisson dose response model informed by the Brazil epidemiological study estimated lower median risks of illness for all locations. If the beta-Poisson dose response model was used, the median risk of illness was 0.06, 0.01, and 0.04 for the Venezuela, Brazil, and U.S. beaches, respectively. If the exponential dose response model created by the WHO was applied, the median risk of illness was 0.13, 0.09, and 0.12 for the Venezuela, Brazil, and U.S. beaches, respectively.

Figure 11: Dose-Response(Venezuela)

Figure 12: Dose-Response(Brazil)

Figure 13: Dose-Response(US Beaches)
Assumptions and Limitations
This case study relied upon indicator data only, and assumed enterococci was a true indicator of gastrointestinal illness for the regions assessed. It was also assumed that a swimmer's water contact consisted of 10 minutes of exposure in the water with a minimum of three full head submersions (WHO guidelines). If swimmers typically spent more or less time in the water, the resulting estimates of risk would be impacted. It was also assumed that swimmers were ingesting the upper range of the expected ingestion volume while swimming - adults and children were assumed to ingest 8,2 ml of water during each swim exposure (Dufour, 2006).
Recommendations
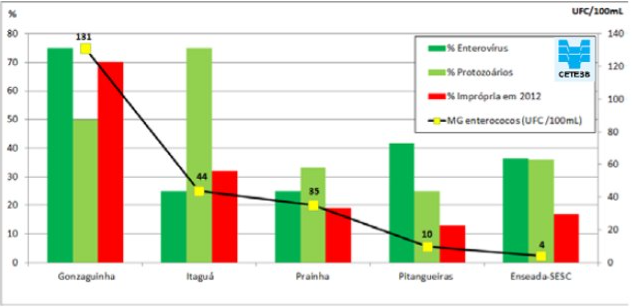
Based on the results of this case study, it is recommended that region-specific dose response models be developed if data availability allows, as there were signficant differences between the dose response models fit to data from epi. studies conducted in England versus Brazil. It is also recommended that indicator sampling of recreational waters be supplemented with pathogen-specific monitoring based on the type of contamination of concern in the area. As shown in Figure 14, the presence of certain types of pathogens may not be equally represented by enterococci levels.
Figure 14: Monitoring of enterococci and presence of pathogenic bactéria, protozoa and viruses.
Risk Management & Communication
Based on the results of this risk assessment, it is recommended that risk managers and water quality managers apply the WHO exponential dose response model, as it was more conservative than the model developed herein. To reduce risk of illness, pollution prevention efforts need to be pursued to limit the introduction of point and non-point sources of polltuion. Collaboration between stakeholders and authorities will be instrumental in improving water quality. Future needs include conducting a waterbody hazard analysis and critical control point (HACCP) assessment and increasing public awareness of the issue. Some specific areas for growth include:
- Development of regulation and monitoring programs to ensure water quality compliance practices.
- Maintaining regular training programs for public health assessors and wastewater treatment plants operators
- Establishment and maintenance of sewage treatment processes
- Regulation of tourism-related infrastructure
- Establishment of educational programs on water pollution related issues focused on local communities with the goal of reaching sustainable management.
- Integrated coastal zone management (ICZM)
References
(2009). A sea change ahead for recreational water quality criteria.
(2002). Survival of faecal indicator bacteria in tropical estuarine waters (Bangpakong River, Thailand).
(1982). Swimming-associated gastroenteritis and water quality. American journal of epidemiology. 115, 606–616.
(1985). Survival and enumeration of the fecal indicators Bifidobacterium adolescentis and Escherichia coli in a tropical rain forest watershed. Applied and environmental microbiology. 50, 468–476.
(2014). Relatório de Qualidade das Praias Litorâneas no Estado de São Paulo-2013.
(2007). Water quality indicators and the risk of illness at beaches with nonpoint sources of fecal contamination. Epidemiology. 27–35.
(1984). Health effects criteria for fresh recreational waters.
(2015). Are fecal indicator bacteria appropriate measures of recreational water risks in the tropics: a cohort study of beach goers in Brazil?. Water research. 87, 59–68.
(2001). Monitoring coastal marine waters for spore-forming bacteria of faecal and soil origin to determine point from non-point source pollution. Water Science and Technology. 44, 181–181.
(2013). A global map of coastal recreation values: Results from a spatially explicit meta-analysis. Ecological economics. 86, 1–15.
(2009). Performance of CHROMagar™ Staph aureus and CHROMagar™ MRSA for detection of Staphylococcus aureus in seawater and beach sand–Comparison of culture, agglutination, and molecular analyses. Water Research. 43, 4802–4811.
(2012). Fecal indicators in sand, sand contact, and risk of enteric illness among beachgoers. Epidemiology (Cambridge, Mass.). 23, 95.
(2001). Marine swimming-related illness: implications for monitoring and environmental policy.. Environmental Health Perspectives. 109, 645–650.
(1994). Predicting likelihood of gastroenteritis from sea bathing: results from randomised exposure. The lancet. 344, 905–909.
(2011). Investigation of human sewage pollution and pathogen analysis at Florida Gulf coast beaches. Journal of applied microbiology. 110, 174–183.
(1975). Membrane filter technique for enumeration of enterococci in marine waters. Applied microbiology. 30, 66–71.
(2012). Association of fecal indicator bacteria with human viruses and microbial source tracking markers at coastal beaches impacted by nonpoint source pollution. Applied and environmental microbiology. 78, 6423–6432.
(2012). Microbiological quality assessment of sand and water from three selected beaches of South Coast, Sao Paulo State, Brazil. Water Science and Technology. 66, 2475–2482.
(1998). Review of epidemiological studies on health effects from exposure to recreational water. International journal of epidemiology. 27, 1–9.
(2011). Pathogenic fungi: an unacknowledged risk at coastal resorts? New insights on microbiological sand quality in Portugal. Marine pollution bulletin. 62, 1506–1511.
(2005). Sanitary quality of sands from marine recreational beaches of São Paulo, Brazil. Brazilian Journal of Microbiology. 36, 321–326.
(2012). Quantitative microbial risk assessment of human illness from exposure to marine beach sand. Environmental science & technology. 46, 2799–2805.
(1953). Studies of bathing water quality and health. American Journal of Public Health and the Nations Health. 43, 529–538.
(2008). High sensitivity of children to swimming-associated gastrointestinal illness: results using a rapid assay of recreational water quality. Epidemiology. 375–383.
(2010). Rapidly measured indicators of recreational water quality and swimming-associated illness at marine beaches: a prospective cohort study. Environmental Health. 9, 66–66.
(2009). Evaluation of public health risks at recreational beaches in Lake Michigan via detection of enteric viruses and a human-specific bacteriological marker. Water research. 43, 1137–1149.
(2012). Occurrence and persistence of bacterial pathogens and indicator organisms in beach sand along the California coast. Applied and environmental microbiology. 78, 1733–1745.


