Dose Response
In the QMRA framework, the dose response assessment phase is the quantitative yardstick for the risk estimate, as this phase estimates a risk of response (infection, illness or death) with respect to a known dose of a pathogen. The basis of the dose response phase is the dose response models, which are mathematical functions derived to describe the dose response relationship for specific pathogens. Therefore, for a particular endpoint (response), a specific pathogen and exposure route there is a unique dose response relationship and consequently a dose response model. Dose response models are necessary as it is not possible to perform a direct study (even with animals) to assess dose corresponding to an acceptably low risk.
Dose Response Models
To be plausible a model should consider the discrete (particulate) nature of organisms, which has a high variability at low dose. It should also be based on the concept of infection from one or more “survivors” of initial dose. Therefore dose response models for QMRA need to be physiologically plausible and be derived from what is known of the general infection process. There are two models which are derived based on these needs for the QMRA dose response relationship, the exponential and beta Poisson models.
Types of Models
Exponential Dose Response Model
Assumptions:
- Poisson distribution of organisms among replicated doses (mean number in dose=d).
- One organism is capable of producing an infection if it arrives at an appropriate site.
- Organisms have independent and identical probability (k) of surviving to reach and infect at an appropriate site. Some sources use the letter 'r' instead of 'k' (equation 1). Here we define r=1/k, so the alternative form for equation 1 can be given as P(response) = 1- exp(-dose/r)
Beta-Poisson Model
Assumptions same as the exponential model except:
- Nonconstant survival and infection probabilities
- Survival probabilities (k) are given by the beta distribution
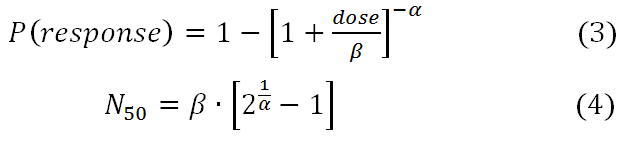
The slope of the beta-Poisson dose response curve is more shallow than the exponential. The exponential model is the same as the beta-Poisson model when alpha approaches infinity. The parameters are alpha and N50. N50 is the dose at which 50% of the population is expected to be affected. The beta-Poisson model is sometimes expressed with a beta parameter instead of an N50 parameter; N50=beta*[2^(1/alpha)-1]. Both the alpha and the beta parameters derive from the use of the beta distribution to model nonconstant pathogen survival probabilities.
The exact form of the beta-Poisson model uses the confluent hypergeometric function, which can be difficult to optimize. However since both the exact and approximate form of the beta Poisson dose response models demonstrate linearity in the low dose range, and there is not a substantial difference between the forms in fitting dose response data, there is not reason to not use the more intuitive form of the beta Poisson. Equation 2 shows the approximate form of the beta Poisson using the N50 parameter, which can be directly optimized using dose response data or estimated using the conversion in equation 4.
Utility of Using Dose Response Models
An optimized dose response model allows for greater flexibility and a wider range of understanding in the estimated risk. Rather than having a median infectious or lethal dose for a pathogen a model that can describe the full range of probability of response beyond just the median and one that is still accurate at low doses.