General overview
Various species of Cryptosporidium infect most vertebrates. C. parvum infects cattle but can also infect humans; C. hominis appears to be restricted to humans, and began to be recognized in the early 2000s (Hunter 2005) [1]. The oocysts are the infective stage and are about 5 microns in size; they are excreted in feces and are transmitted to new hosts by the fecal-oral route. They are highly resistant to chlorine, but are vulnerable to ultraviolet light disinfection (AWWA 1999) [2]. The durability and infectiousness of the oocysts, as well as their documented ability to cause large outbreaks (Mac Kenzie et al., 1994) [3], means that control of Cryptosporidium is very important for drinking water treatment. Water treatment utilities should consider all surface water to be contaminated with oocysts (AWWA 1999) [2]. Effective control of Cryptosporidium is generally achieved in drinking water treatment through filtration yielding nonturbid water (<= 0.1 nephelometric turbidity unit) (AWWA 1999).
Cryptosporidiosis is a disease described by a self-limited watery diarrhea with an incubation period of 3 to 7 days (Miliotis & Bier 2003) [4]. Asymptomatic infections are also common in apparently healthy children and adults (Blaser 2002) [5]. However, the disease is particularly dangerous to people with HIV/AIDS because there is no effective treatment (Miliotis & Bier 2003) [4]. This can lead to lethal infections, or chronic disease lasting months or years that severely damages the gut.
Summary of Data
An experiment (DuPont et al., 1995) [6] from feeding an isolate from a calf (Iowa isolate) to human volunteers yields an exponential model with an ID50 of 165 oocysts (Teunis 1999) [7] also fitted a model to these data which is similar to the model presented here.
Messner et al. (2001) [8] described dose response model fits using the complete unpublished data set from DuPont et al., 1995 [6]:
- Reanalysis of stool samples from the above experiment (DuPont et al., 1995) [6] using flow cytometry revealed that 2 individuals thought to be uninfected were actually infected (Messner 2001) [8].
- Two other feeding studies (Okhuysen et al., 1999) [9] in human volunteers using different isolates yielded models with ID50s of 179 oocysts (UCP isolate, also from a calf) and 9 oocysts (TAMU isolate, from an infected veterinary student).
Messner et al. (2001) [8] fit the exponential model to these three datasets. This was appropriate for the Iowa and TAMU isolates, but the Beta-Poisson model provided a better fit than the exponential model for the UCP isolate. The UCP and TAMU datasets are smaller than the Iowa datasets.
Okhuysen et al. (2002) [10] also conducted a feeding study in adult humans using C. parvum originating from red deer (Moredun isolate).
Chappell et al. (1999) [10] also conducted a feeding study in humans using the Iowa isolate of C. parvum. Although the data were not published, they estimated an ID50 of 83 oocysts for volunteers lacking anti-C. parvum IgG, and an ID50 of 1,880 oocysts for volunteers who had anti-C. parvum IgG.
References
- (2005). The zoonotic transmission of Giardia and Cryptosporidium. International journal for parasitology. 35, 1181–1190.
- (1999). Waterborne pathogens: manual of water supply practices.
- Citekey 1475 not found
- (2003). International handbook of foodborne pathogens. 125,
- (2003). Infections of the Gastrointestinal Tract. PRACTICAL GASTROENTEROLOGY. 63.
- (1995). The infectivity of Cryptosporidium parvum in healthy volunteers. The New England journal of medicine. 332, 13.
- Citekey 1481 not found
- (2001). Risk Assessment for Cryptosporidium: A Hierarchical Bayesian Analysis of Human Dose Response Data. Water Research. 35, 16.
- (1999). Virulence of three distinct Cryptospovidium parvum isolates for healthy adults. The Journal of infectious diseases. 180, 1275–1281.
- (1999). Infectivity of Cryptosporidium parvum in healthy adults with pre-existing anti-C. parvum serum immunoglobulin G.. The American journal of tropical medicine and hygiene. 60, 157–164.
| ID | # of Doses | Agent Strain | Dose Units | Host type | Μodel | Optimized parameters | Response type | Reference |
|---|---|---|---|---|---|---|---|---|
| 108 | 8 | Iowa strain | oocysts | human | exponential |
k = 4.19E-03 LD50/ID50 = 1.65E+02 |
infection | "The infectivity of Cryptosporidium parvum in healthy volunteers." The New England journal of medicine. 332 (1995): 13. |
| 139 | 8 | Iowa isolate | oocysts | human | exponential |
k = 5.26E-03 LD50/ID50 = 1.32E+02 |
infection | "Risk Assessment for Cryptosporidium: A Hierarchical Bayesian Analysis of Human Dose Response Data." Water Research. 35 (2001): 16. |
| 140 | 4 | TAMU isolate | oocysts | human | exponential |
k = 5.72E-02 LD50/ID50 = 1.21E+01 |
infection | "Risk Assessment for Cryptosporidium: A Hierarchical Bayesian Analysis of Human Dose Response Data." Water Research. 35 (2001): 16. |
| 141 | 4 | UCP isolate | oocysts | human | beta-Poisson |
a = 1.45E-01 LD50/ID50 = 1.79E+02 N50 = 1.79E+02 |
infection | "Immune response, ciprofloxacin activity, and gender differences after human experimental challenge by two strains of enterotoxigenic Escherichia coli." Infection and immunity. 75 (2007): 1. |
| 181 | 4 | *C. hominis*, TU502 | oocysts | human | beta-Poisson |
a = 2.7E-01 LD50/ID50 = 1.68E+01 N50 = 1.68E+01 |
diarrhea | "Infectivity of a Cryptosporidium parvum Isolate of Cervine Origin for Healthy Adults and Interferon-γ Knockout Mice." Journal of Infectious Diseases. 185 (2002): 9. |
| 183 | 4 | Moredun isolate | oocysts | human | beta-Poisson |
a = 1.14E-01 LD50/ID50 = 4.55E+02 N50 = 4.55E+02 |
infection | "Experimental Campylobacter jejuni Infection of Adult Mice." Infection and Immunity. 39 (1983): 2. |
k = 4.19E-03
LD50/ID50 = 1.65E+02
|
|
||||||||||||||||||||||
|
||||||||||||||||||||||||||||||||||||||
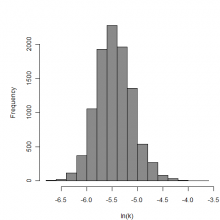
Parameter histogram for exponential model (uncertainty of the parameter)
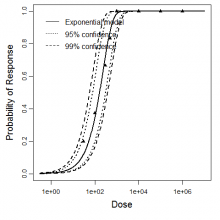
Exponential model plot, with confidence bounds around optimized model
References
k = 5.26E-03
LD50/ID50 = 1.32E+02
|
|
||||||||||||||||||||||
|
||||||||||||||||||||||||||||||||||||||

Parameter histogram for exponential model (uncertainty of the parameter)

Exponential model plot, with confidence bounds around optimized model
References
k = 5.72E-02
LD50/ID50 = 1.21E+01
|
|
||||||||||||||||||||||
|
||||||||||||||||||||||||||||||||||||||

Exponential model plot, with confidence bounds around optimized model

Parameter histogram for exponential model (uncertainty of the parameter)
References
LD50/ID50 = 1.79E+02
N50 = 1.79E+02
|
|
||||||||||||||||||||||
|
||||||||||||||||||||||||||||||

Parameter scatter plot for beta Poisson model ellipses signify the 0.9, 0.95 and 0.99 confidence of the parameters.

beta Poisson model plot, with confidence bounds around optimized model
References
LD50/ID50 = 1.68E+01
N50 = 1.68E+01
|
|
||||||||||||||||||||||
|
||||||||||||||||||||||||||||||

Parameter scatter plot for beta Poisson model ellipses signify the 0.9, 0.95 and 0.99 confidence of the parameters.

beta Poisson model plot, with confidence bounds around optimized model.
References
LD50/ID50 = 4.55E+02
N50 = 4.55E+02
|
|
||||||||||||||||||||||
|
||||||||||||||||||||||||||||||
Parameter scatter plot for beta Poisson model ellipses signify the 0.9, 0.95 and 0.99 confidence of the parameters.
beta Poisson model plot, with confidence bounds around optimized model.