| Experiment ID |
142, 143, 144, 145, 147, 151, 161, 162, 163, 164, 168, 169, 170, 172
|
|---|---|
| Pathogen | |
| Agent Strain |
ETEC B7A
|
| Contains Preferred Model |
No
|
| Reference |
Coster, T. S., Wolf, M. K., Hall, E. R., Cassels, F. J., Taylor, D. N., Liu, C. T., … McQueen, C. E. (2007). Immune response, ciprofloxacin activity, and gender differences after human experimental challenge by two strains of enterotoxigenic Escherichia coli. Infection and Immunity, 75, 1. |
| Exposure Route |
oral (with NaHCO3)
|
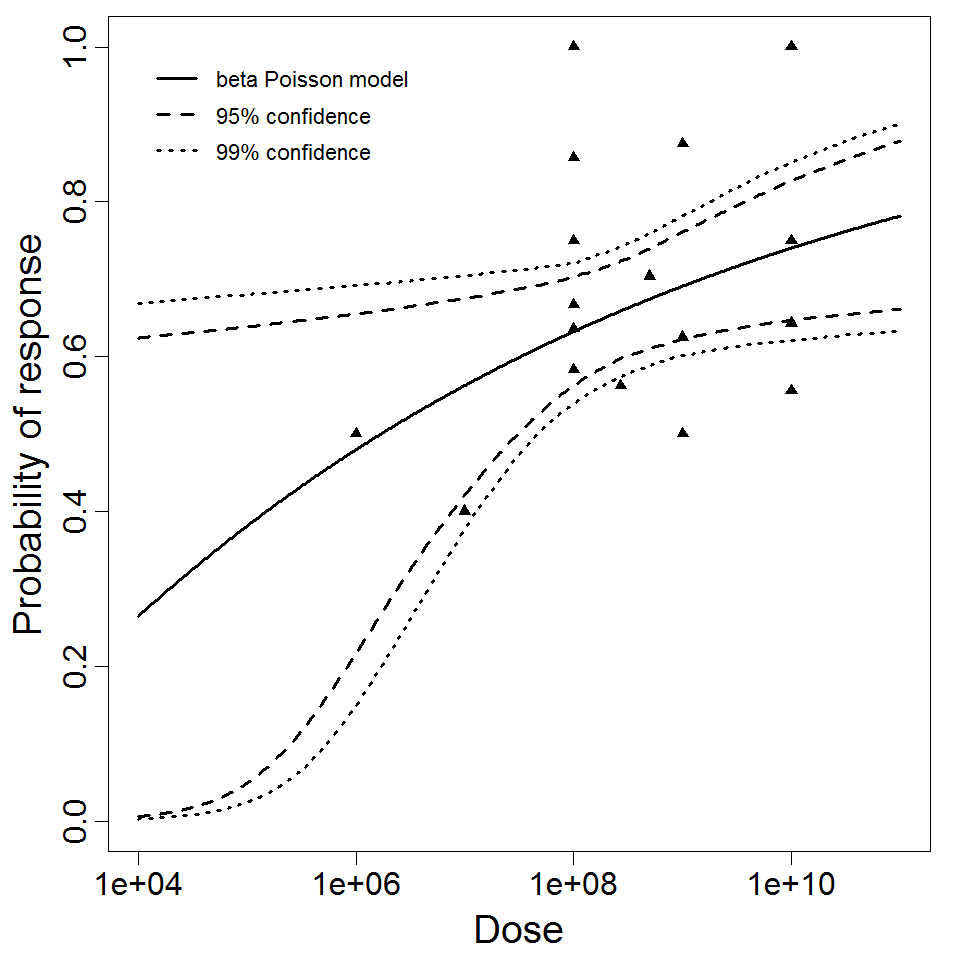
| Response |
diarrhea
|
| Host type |
human
|
||||||||||||||||||||
|---|---|---|---|---|---|---|---|---|---|---|---|---|---|---|---|---|---|---|---|---|---|
| # of Doses |
19.00
|
||||||||||||||||||||
| Dose Units |
CFU
|
||||||||||||||||||||
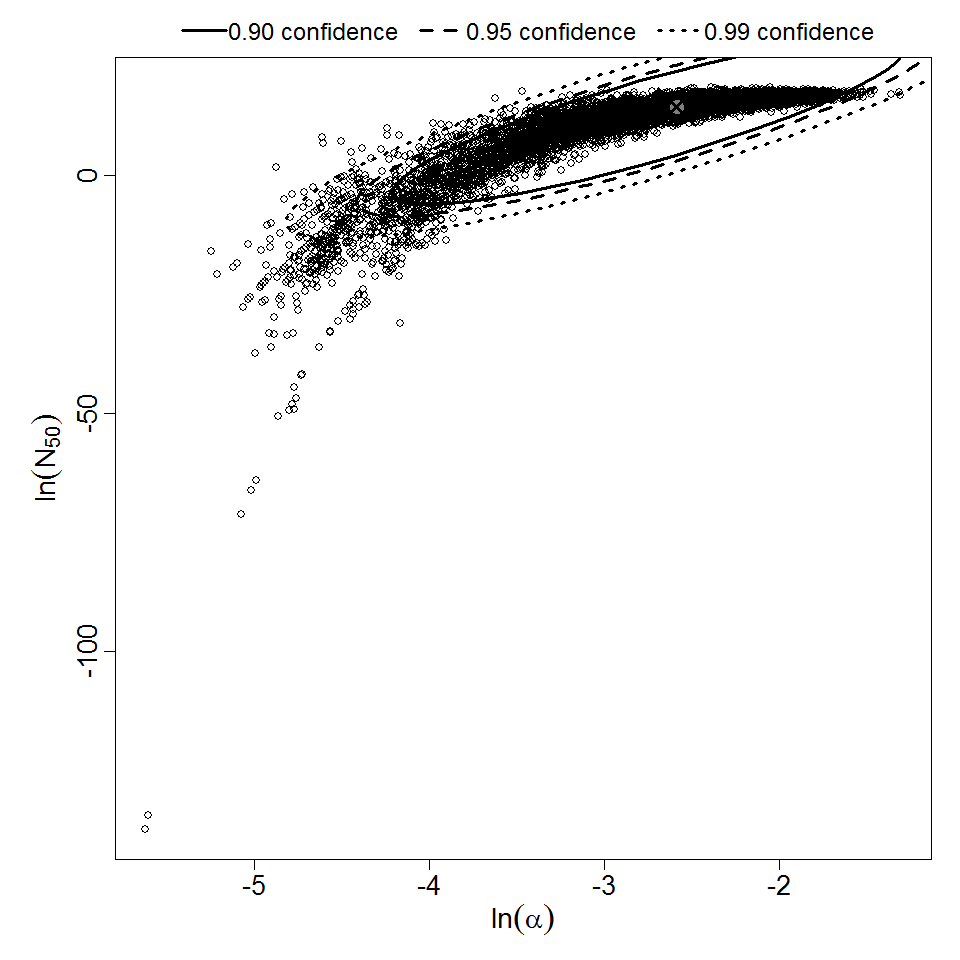
| Μodel |
beta-Poisson
|
||||||||||||||||||||
| a |
7.54E-02
|
||||||||||||||||||||
| N50 |
1.7E+06
|
||||||||||||||||||||
| LD50/ID50 |
1.7E+06
|
||||||||||||||||||||
| Experiment Dataset |
|
Description
|
| ||||||||||||||||||||||
| ||||||||||||||||||||||||||||||