General Overview
Listeria monocytogenes is a Gram-positive rod-shaped bacterium. It is the causative agent of listeriosis, a serious infection caused by eating food contaminated with the bacteria. The disease generally affects older adults, pregnant women, newborns, and adults with weakened immune systems. However, rarely, persons without these risk factors can also be affected, according to the CDC[1] and Todar[2].
The overt form of the disease has mortality greater than 25 percent. The two main clinical manifestations are sepsis and meningitis. Meningitis is often complicated by encephalitis, a pathology that is unusual for bacterial infections, according to Todar [2].
Summary Data
Czuprynski et al.[3] studied susceptibility of C57BL/6 mice and A/J mice to Listeria monocytogenes (strain Scott A) inoculating them intragastrically. Similarly, Golnazarian et al. [4] also compared infectious dose in normal and compromised C57BL/6J mice with pathogens( strain F5817) via oral route.
|
|||||||||||||||||||||||||||||||||||||||||||||||||||||||
Optimization Output for experiment 291
|
|
||||||||||||||||||||||
|
||||||||||||||||||||||||||||||||||||||

Parameter histogram for exponential model (uncertainty of the parameter)
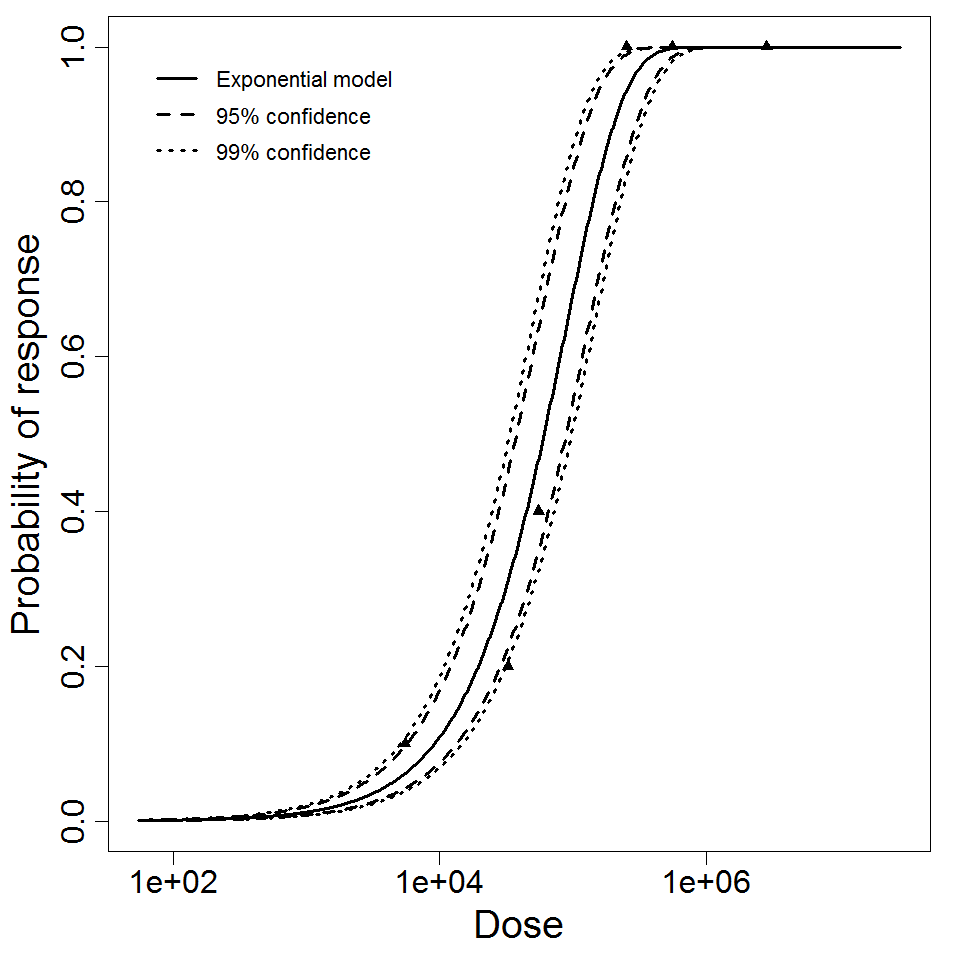
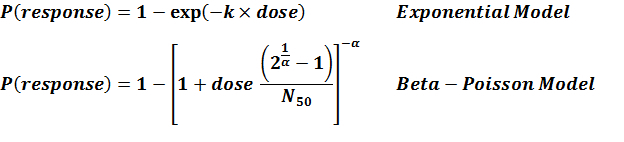
Exponential model plot, with confidence bounds around optimized model
Optimization Output for experiment 293
|
|
||||||||||||||||||||||
|
||||||||||||||||||||||||||||||||||||||
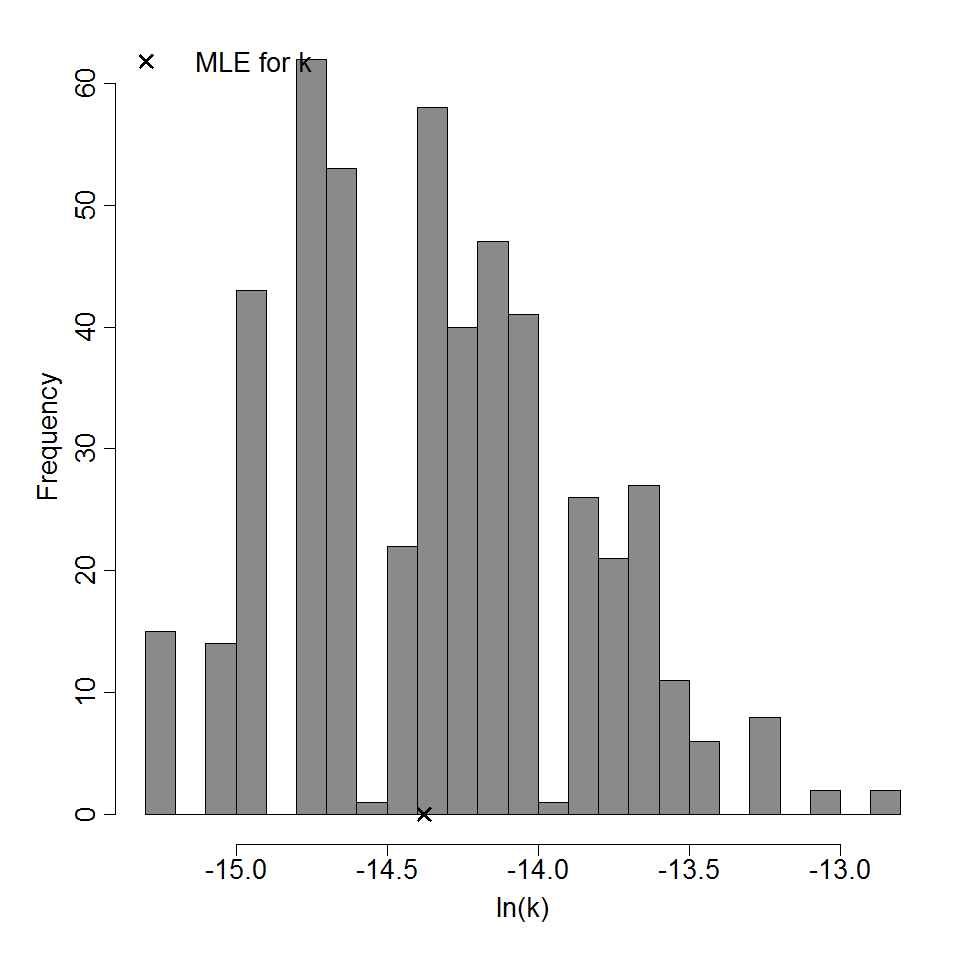
Parameter histogram for exponential model (uncertainty of the parameter)

Exponential model plot, with confidence bounds around optimized model
Optimization Output for experiment 294
|
|
||||||||||||||||||||||
|
||||||||||||||||||||||||||||||
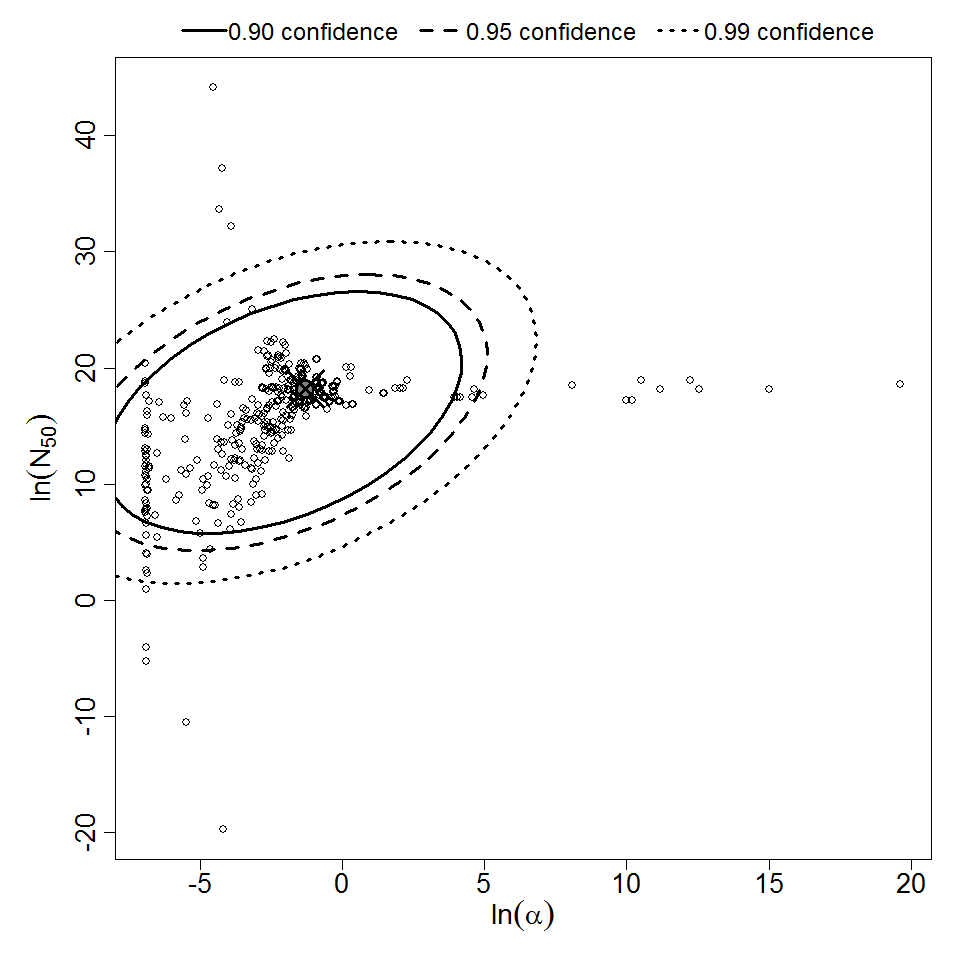
Parameter scatter plot for beta Poisson model ellipses signify the 0.9, 0.95 and 0.99 confidence of the parameters.
References
- Citekey 1784 not found
- Citekey 1785 not found
- (2003). A/J Mice Are Susceptible and C57BL/6 Mice Are Resistant to Listeria monocytogenes. Infection and Immunity. 71, 2.
- (Submitted). Comparison of infectious dose of Listeria monocytogenes F5817 as determined for normal versus compromised C57B1/6J mice. Journal of food protection. 52, 10.
| ID | # of Doses | Agent Strain | Dose Units | Host type | Μodel | Optimized parameters | Response type | Reference |
|---|---|---|---|---|---|---|---|---|
| 292 | 6 | F5817 | CFU | beta-Poisson |
a = 0.253 N50 = 277 |
infection |
N50 = 277
| Model | Deviance | Δ | Degrees of freedom |
χ20.95,1 p-value |
χ20.95,m-k p-value |
| Exponential | 9.88 | 6.48 | 5 | 3.84 0.011 |
11.1 0.0788 |
| beta Poisson | 3.4 | 4 | 9.49 0.494 |
||
| beta-Poisson fits better than exponential; can not reject good fit for beta-Poisson | |||||
| Parameter | MLE Estimate | 0.5% | 2.5% | 5% | 95% | 97.5% | 99.5% |
|
α |
6.95E-01 | 2.69E-01 | 3.39E-01 | 3.78E-01 | 2.56E+0 | 2.28E+01 | 1.18E+03 |
| N50 | 3.39E+03 | 3.58E+01 | 2.47E+02 | 4.67E+02 | 1.09E+04 | 1.26E+04 | 1.85E+04 |