| Experiment ID |
252
|
|---|---|
| Pathogen | |
| Agent Strain |
BSE agent
|
| Contains Preferred Model |
No
|
| Reference |
John, D. T., & Hoppe, K. L. (1990). Susceptibility of Wild Mammals to Infection with Naegleria fowleri. The Journal of Parasitology, 76, 6. |
| Exposure Route |
unknown type of injection
|
| Response |
infection
|
| Host type |
mice
|
|---|---|
| # of Doses |
4.00
|
| Dose Units |
ID50 unit
|
| Μodel |
exponential
|
| k |
6.93E-01
|
| LD50/ID50 |
1
|
Description
|
|
||||||||||||||||||||||
|
||||||||||||||||||||||||||||||||||||||
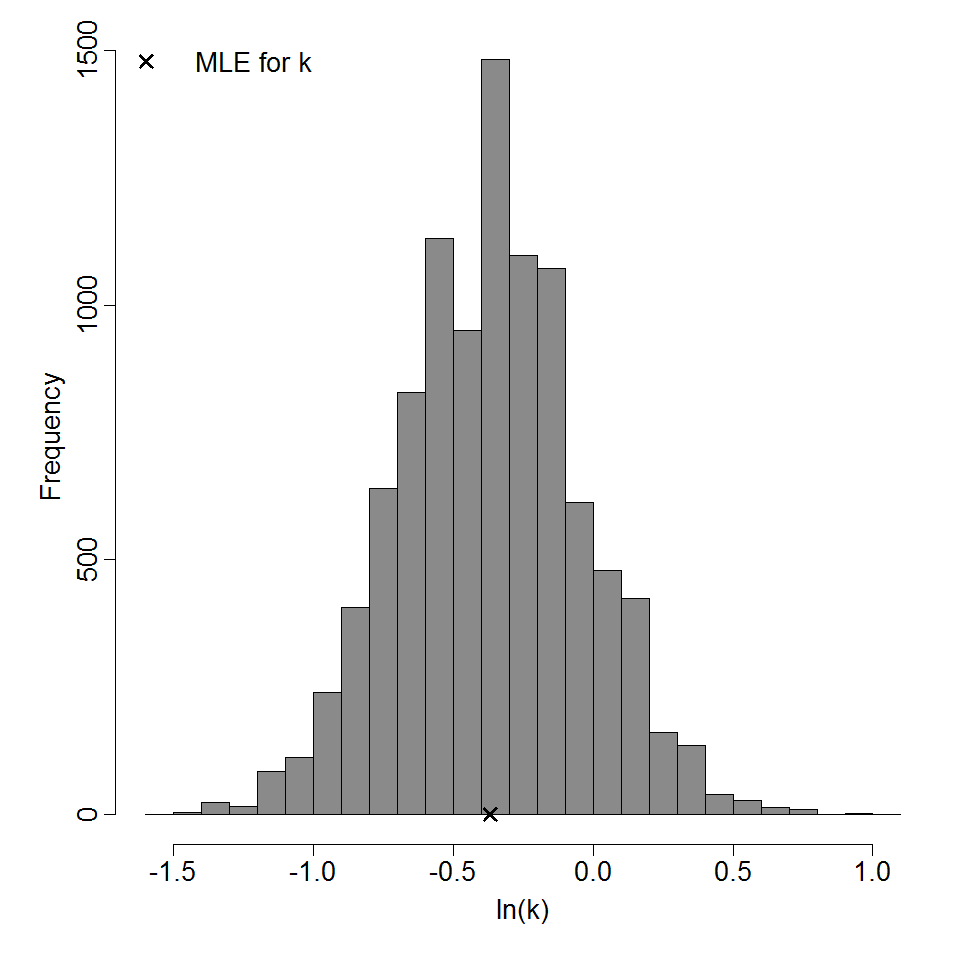
Parameter histogram for exponential model (uncertainty of the parameter)

Exponential model plot, with confidence bounds around optimized model