General Overview
Pseudomonas aeruginosa causes bacteremia primarily in immunocompromised and immunosupressed patients. Hematologic malignancies, immunodeficiency relating to AIDS, diabetes mellitus, and severe burns are some of the preexisting conditions (Todar 2012) . Any route including intravascular, intraperitoneal or intranasal routes of bacterial administration can cause ocular infection. An exposure to almost any bacterium able to cause severe bacteremia can result in ocular infection .
http://www.cdc.gov/mmwr/preview/mmwrhtml/00001546.htm
Summary Data
Hazlett et al (1978) studied the susceptibility of newborn and infant mice to eye infection by P. aeruginosa. Inoculation of P. aeruginoa under the unopened eyelids of 5 and 10 day old mice resulted in acute infection and death of many animals due to severe bacteremia.
Recommended Model
The pooled model of experiment number 281 and 282 was recommended model for bacteremia due to P. aeruginosa infection via eyes. The LD50 of the pooled model was lower than pooled model of experiment 283 and 284. Pooled model shows improvement in fitting than individual fits.
| ID | Exposure Route | # of Doses | Agent Strain | Dose Units | Host type | Μodel | LD50/ID50 | Optimized parameters | Response type | Reference |
|---|---|---|---|---|---|---|---|---|---|---|
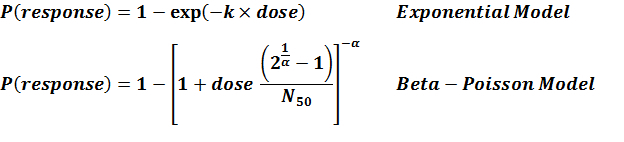
| 281 | injected in eyelids | 6.00 | ATCC 19660 | CFU | Swiss webster mice (5day old) | exponential | 8.13E+03 | k = 8.52E-05 | death |
Hazlett, L. D., Rosen, D. D., & Berk, R. S. (1978). Age-Related Susceptibility to Pseudomonas aeruginosa Ocular Infections in Mice. Infection and Immunity, 20, 1. |
| 281,282 (pooled) | injected in eyelids | 12.00 | ATCC 19660 | CFU | Swiss webster mice (5day old) | exponential | 6.61E+03 | k = 1.05E-04 | death |
Hazlett, L. D., Rosen, D. D., & Berk, R. S. (1978). Age-Related Susceptibility to Pseudomonas aeruginosa Ocular Infections in Mice. Infection and Immunity, 20, 1. |
| 282 | injected in eyelids | 6.00 | ATCC 19660 | CFU | Swiss webster mice (5day old) | exponential | 4.98E+03 | k = 1.39E-04 | death(after day 21) |
Hazlett, L. D., Rosen, D. D., & Berk, R. S. (1978). Age-Related Susceptibility to Pseudomonas aeruginosa Ocular Infections in Mice. Infection and Immunity, 20, 1. |
| 283 | injected in eyelids | 6.00 | ATCC 19660 | CFU | Swiss webster mice(10day old) | beta-Poisson | 1.93E+04 | a = 6.73E-01 N50 = 1.93E+04 | death(after day 1) |
Hazlett, L. D., Rosen, D. D., & Berk, R. S. (1978). Age-Related Susceptibility to Pseudomonas aeruginosa Ocular Infections in Mice. Infection and Immunity, 20, 1. |
| 283,284 | injected in eyelids | 12.00 | ATCC 19660 | CFU | Swiss webster mice(10day old) | beta-Poisson | 1.48E+04 | a = 6.01E-01 N50 = 1.48E+04 | death |
Hazlett, L. D., Rosen, D. D., & Berk, R. S. (1978). Age-Related Susceptibility to Pseudomonas aeruginosa Ocular Infections in Mice. Infection and Immunity, 20, 1. |
| 284 | injected in eyelids | 6.00 | ATCC 19660 | CFU | Swiss webster mice(10day old) | beta-Poisson | 1.13E+04 | a = 5.49E-01 N50 = 1.13E+04 | death(after day 2-21) |
Hazlett, L. D., Rosen, D. D., & Berk, R. S. (1978). Age-Related Susceptibility to Pseudomonas aeruginosa Ocular Infections in Mice. Infection and Immunity, 20, 1. |
|
|
||||||||||||||||||||||
|
||||||||||||||||||||||||||||||||||||||
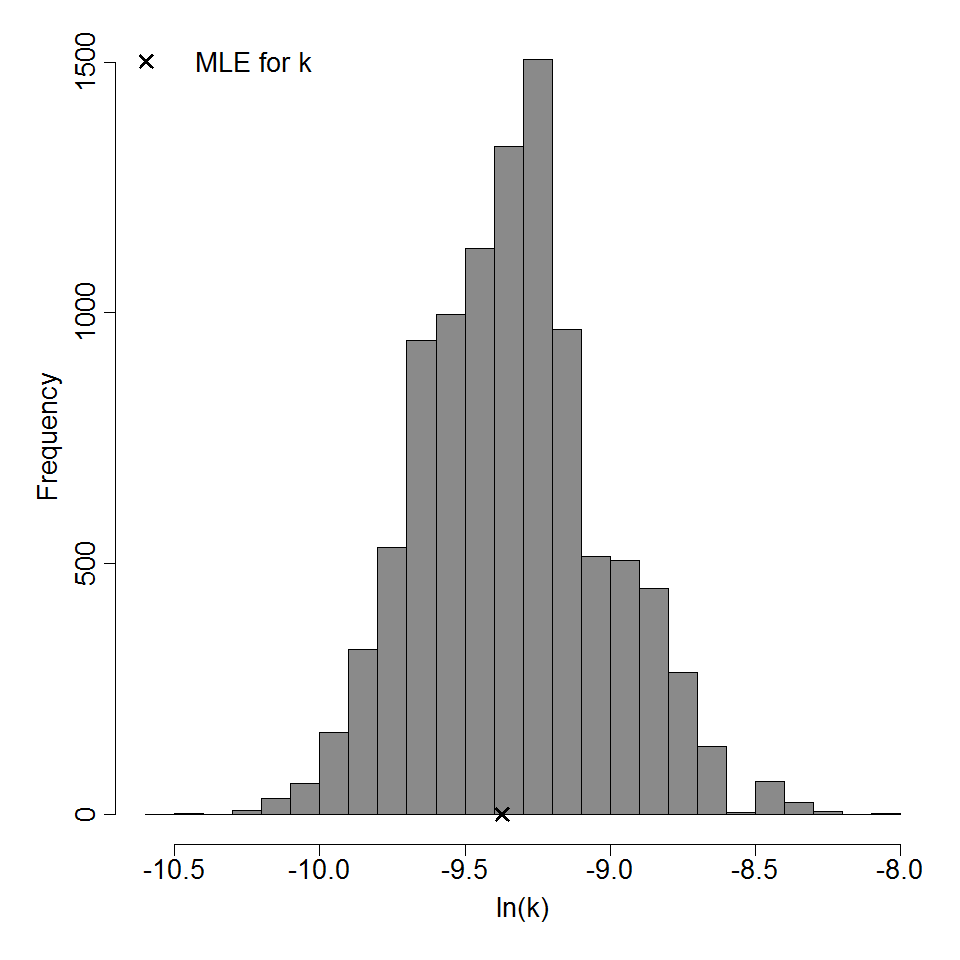
Parameter histogram for exponential model (uncertainty of the parameter)
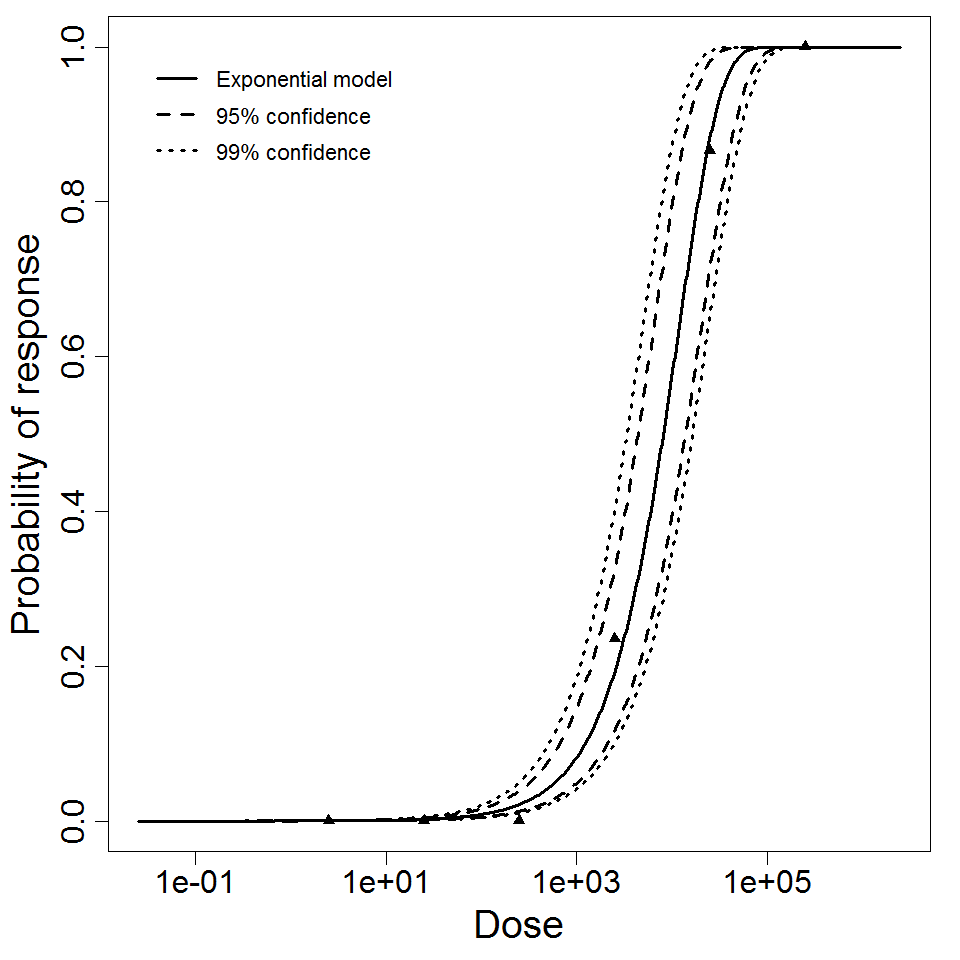
Exponential model plot, with confidence bounds around optimized model
|
|
||||||||||||||||||||||
|
||||||||||||||||||||||||||||||||||||||
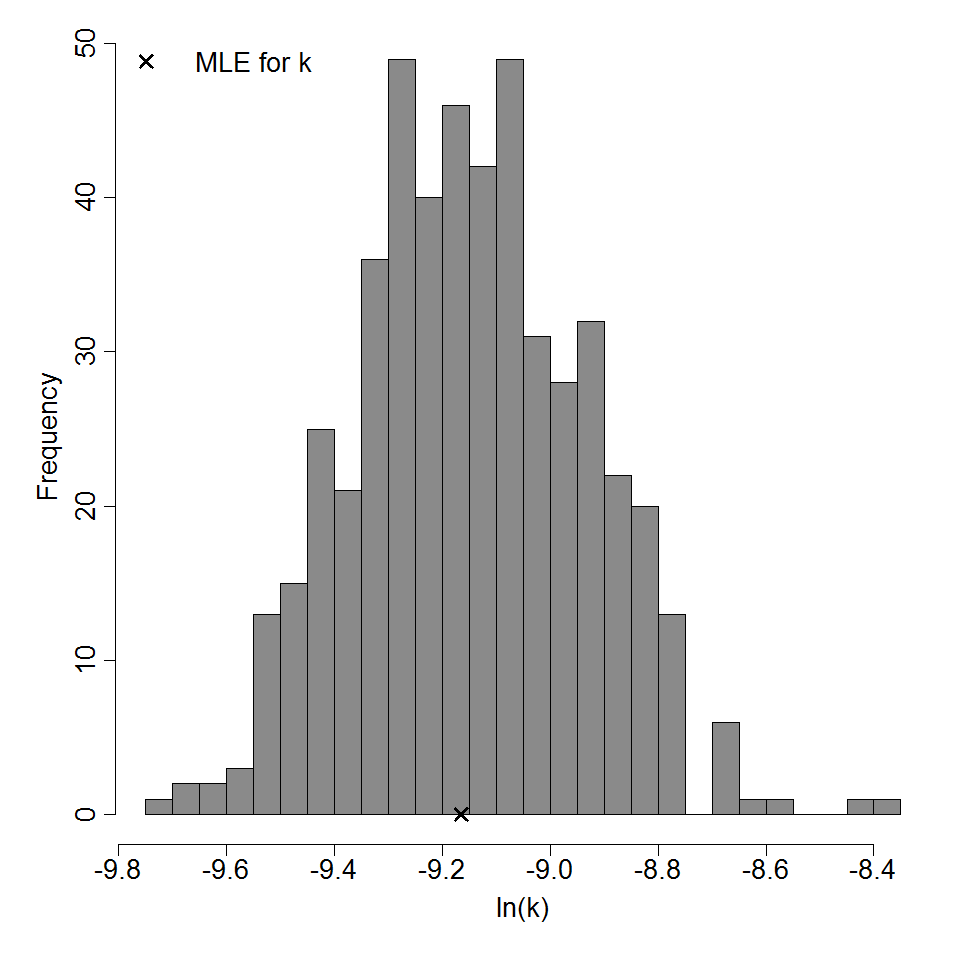
Parameter histogram for exponential model (uncertainty of the parameter)
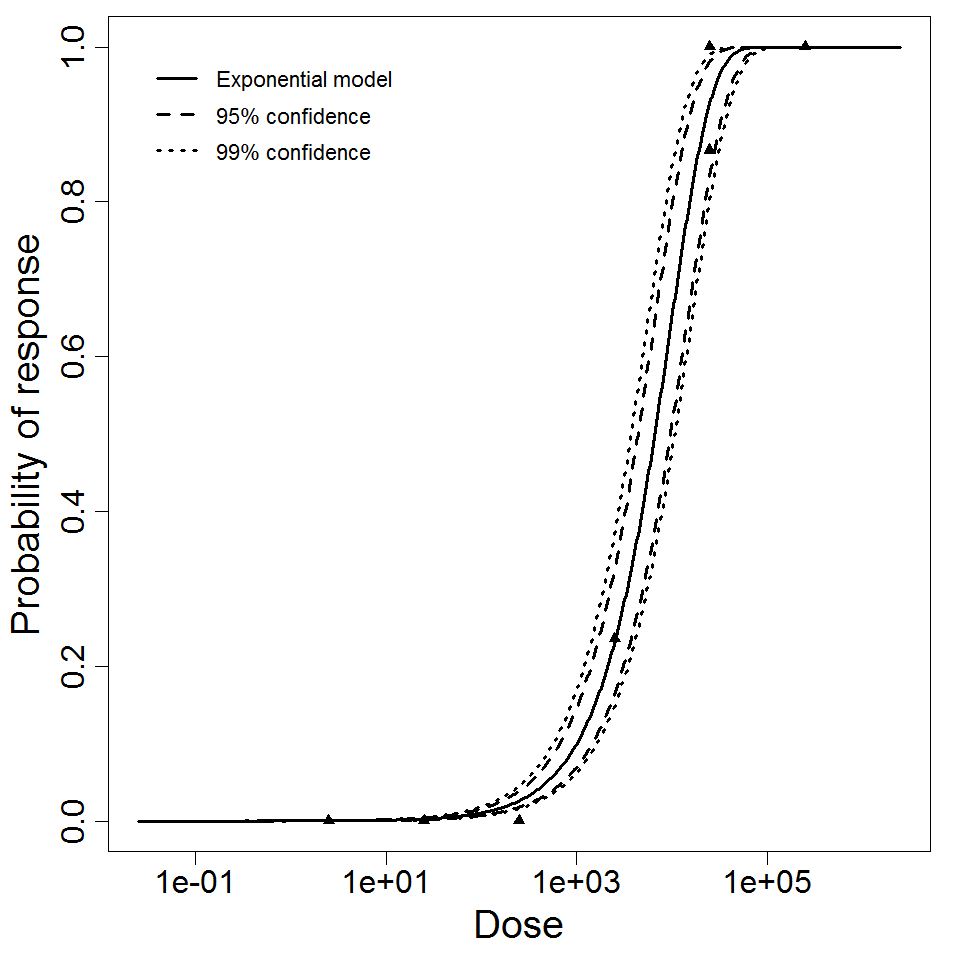
Exponential model plot, with confidence bounds around optimized model
|
|
||||||||||||||||||||||
|
||||||||||||||||||||||||||||||||||||||
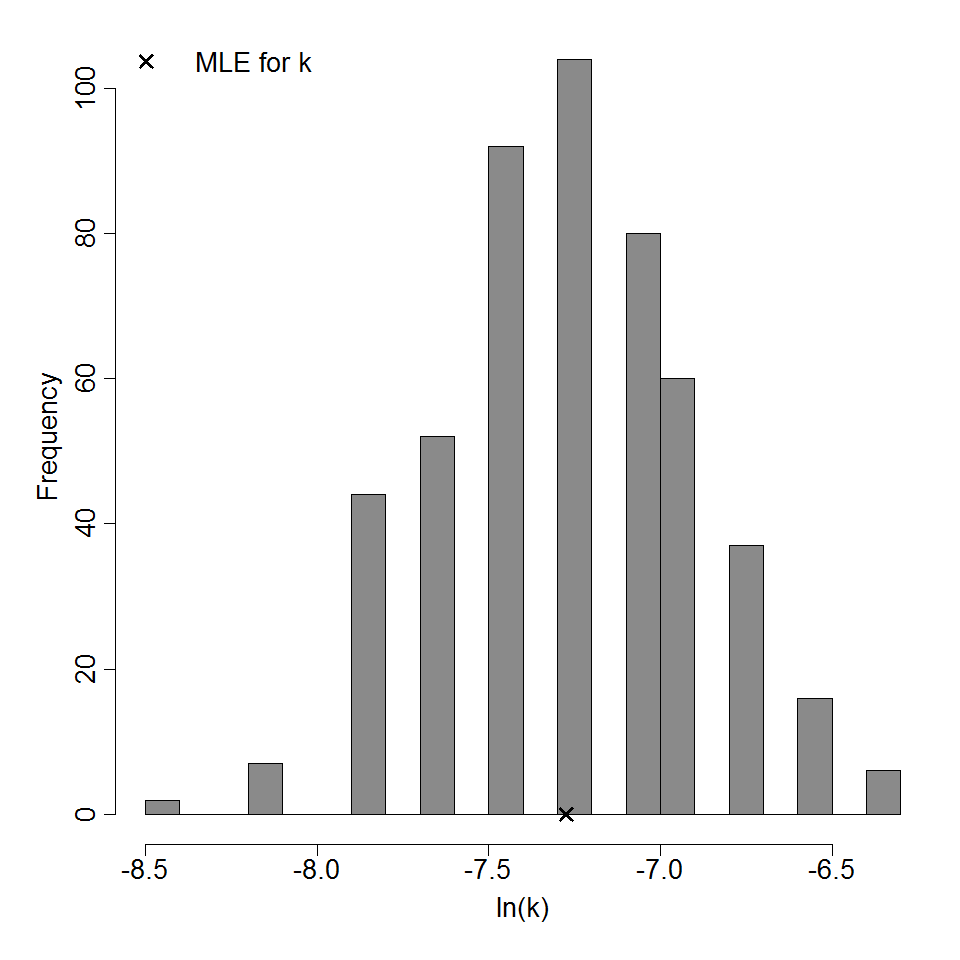
Parameter histogram for exponential model (uncertainty of the parameter)
Exponential model plot, with confidence bounds around optimized model
|
|
||||||||||||||||||||||
|
||||||||||||||||||||||||||||||
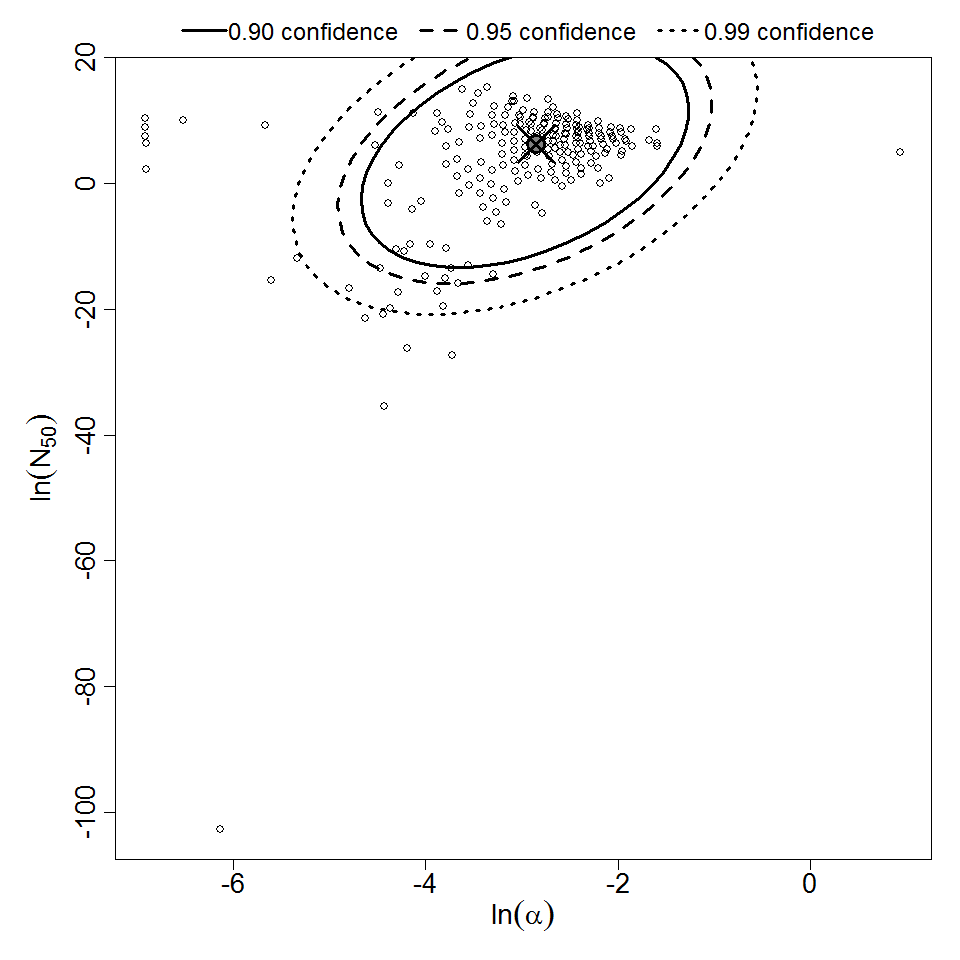
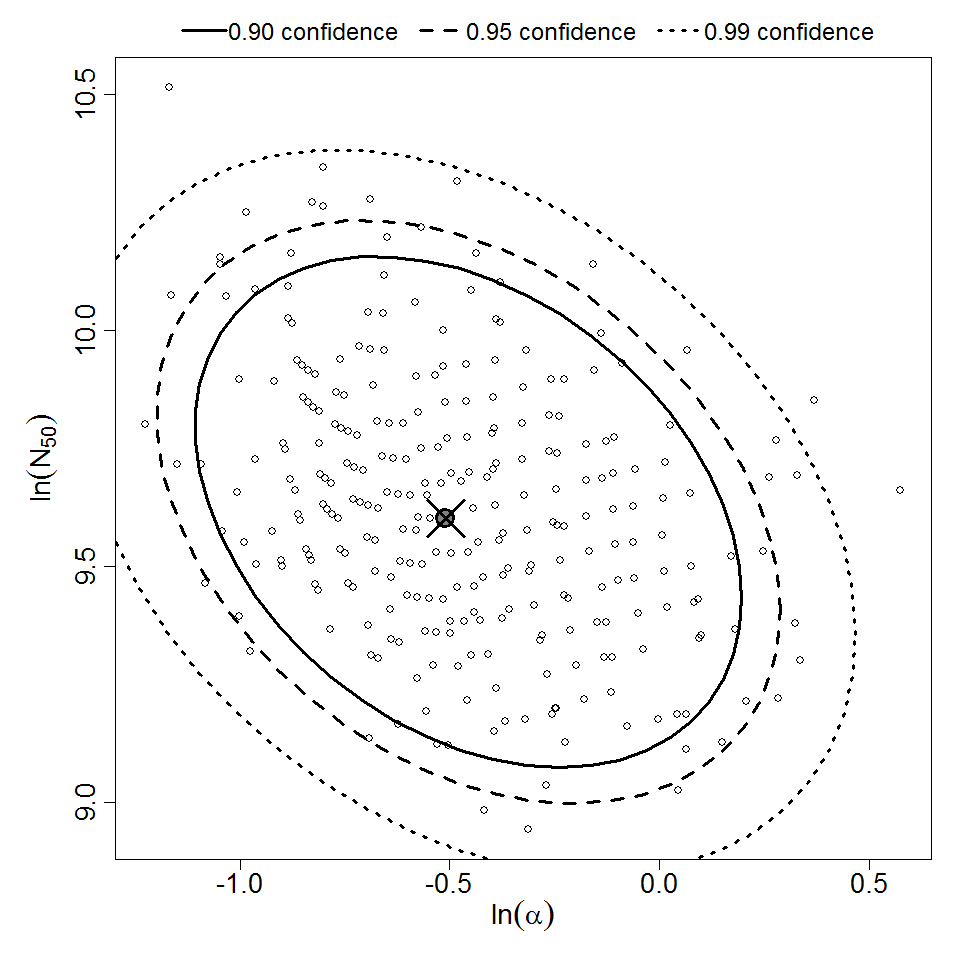
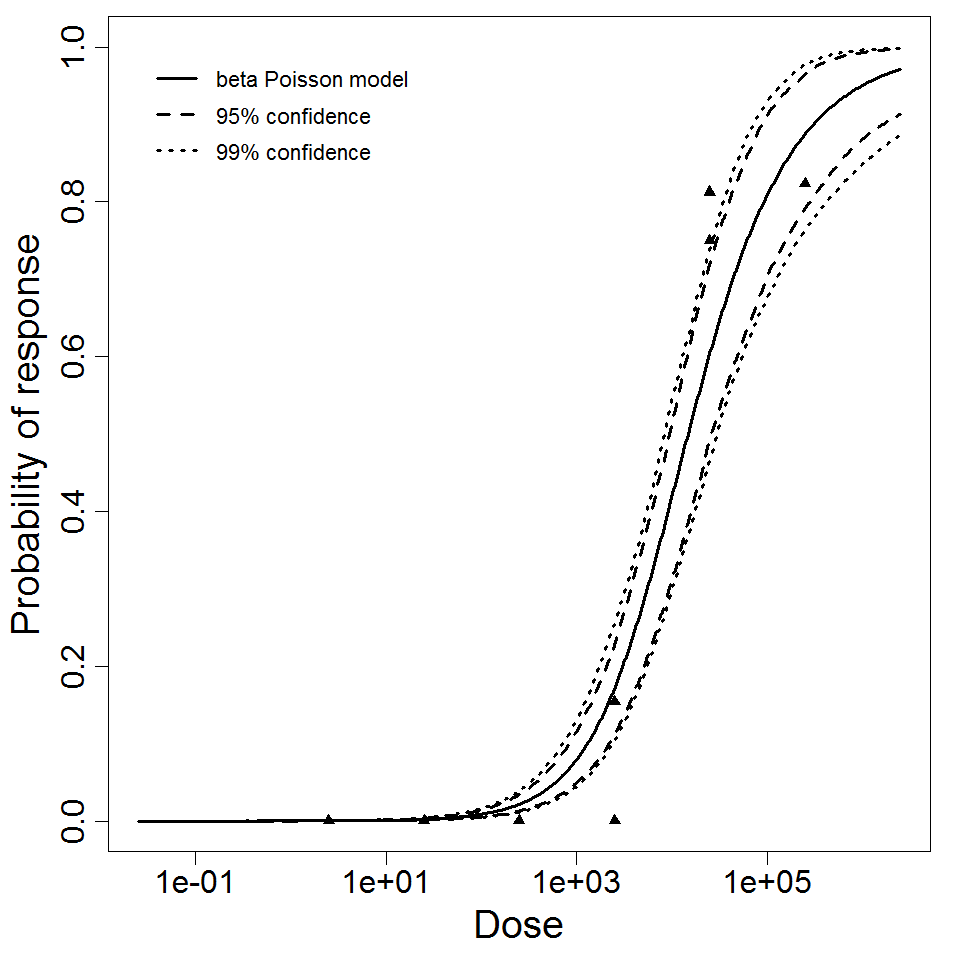
Parameter scatter plot for beta Poisson model ellipses signify the 0.9, 0.95 and 0.99 confidence of the parameters.

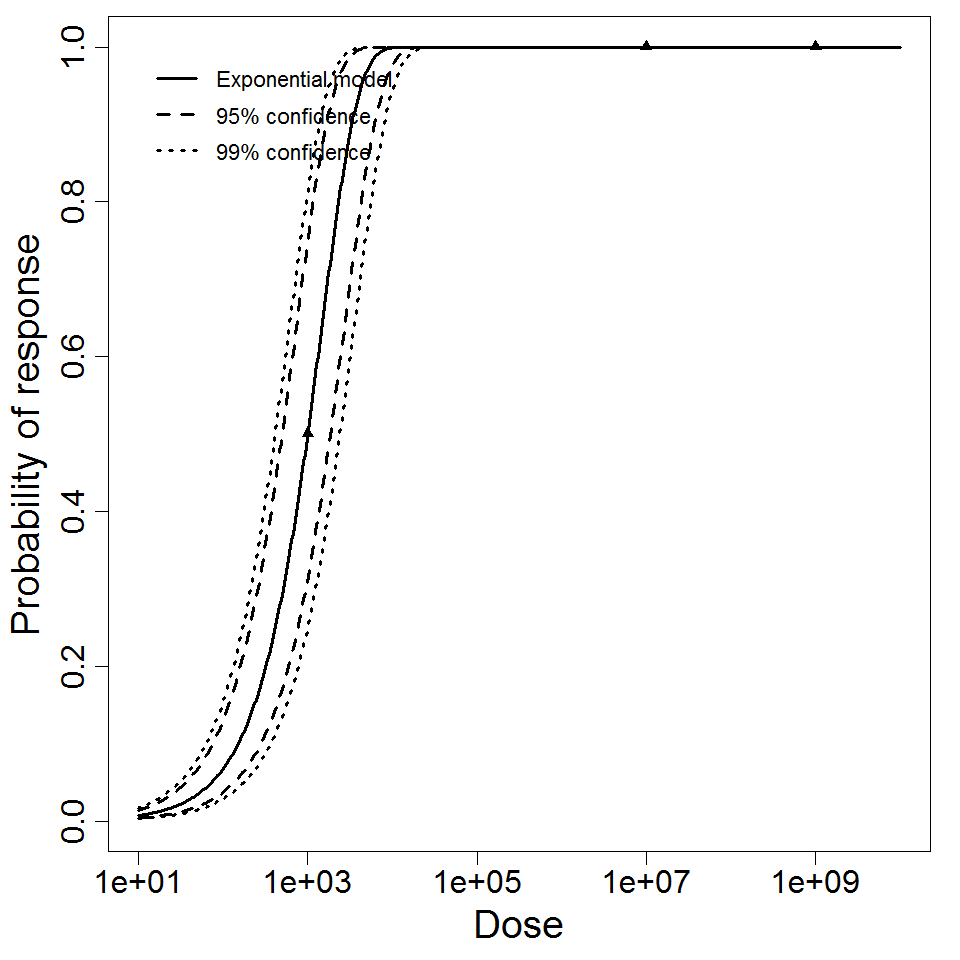
beta Poisson model plot, with confidence bounds around optimized model
|
||||||||||||||||||||||
|
||||||||||||||||||||||||||||||
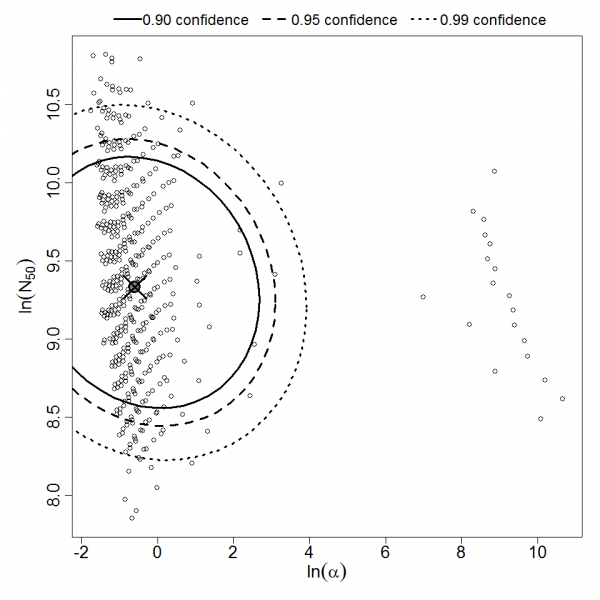
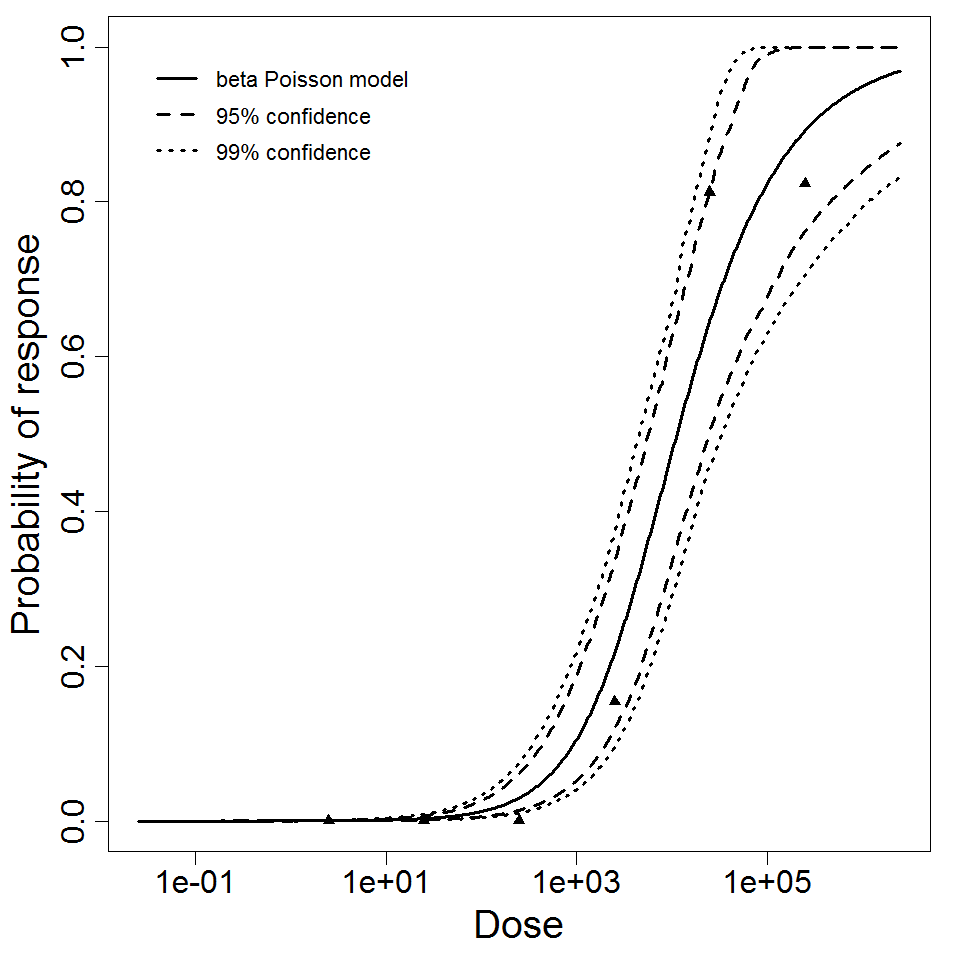
Parameter scatter plot for beta Poisson model ellipses signify the 0.9, 0.95 and 0.99 confidence of the parameters.
beta Poisson model plot, with confidence bounds around optimized model
|
|
||||||||||||||||||||||
|
||||||||||||||||||||||||||||||
Parameter scatter plot for beta Poisson model ellipses signify the 0.9, 0.95 and 0.99 confidence of the parameters.
beta Poisson model plot, with confidence bounds around optimized model