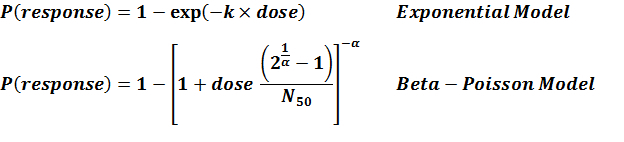
General Overview
Rocky Mountain spotted fever is a disease endemic to North America is caused by Rickettsia rickettsi. The bacterium is delivered to the victim by a tick bite, and is the most lethal disease of all Rickettsial illnesses, especially in the United States. While the main vector for the disease is via an insect (most typically a tick), there has been evidence cited in Saslaw and Carlisle (1966) that aerosol dissemination and infection can be possible as well. This form of exposure to the bacterium can still develop into the lethal form of the disease, therefore, aerosol animal models were needed.
Typically rocky mountain spotted fever (RMSF) can be a misnomer, as the disease neither originated from this area of America and Canada, nor is it isolated to just this region or these countries. As the bacterium has been known to cause RMSF in south and central America as well. RMSF presents with sudden onset of flu-like symptoms, followed by the onset of a spotty rash, similar to pox, yet not raised above the skin as a pox is. Patients often require hospitalization from infection and can be fatal is not treated immediately and aggressively.
Summary Data
Saslaw and Carlisle in 1966 studied the aerosol infectivity of R. rickettsii in monkeys. Rhesus monkeys were challenged with aerosolized pathogens and morbidity as well as mortality was observed. Dupont et al. carried out a study of R. rickettsii (Sheila Smith) in human volunteers via the intradermal route. Sammons et al. exposed Macaca mulatta (Rhesus monkey) to R. rickettsii (strain Sheila Smith) via different routes to find the changes in blood serum constituents.
Recommended Model
The pooled model of human exposed intradermally and aerosol exposed rhesus monkey is the recommended model. Intradermal route is the one of the natural routes of infection and aerosol route might be an accidental or intentional route. Moreover, the experiment 301 was conducted with human volunteers.
| ID | Exposure Route | # of Doses | Agent Strain | Dose Units | Host type | Μodel | LD50/ID50 | Optimized parameters | Response type | Reference |
|---|---|---|---|---|---|---|---|---|---|---|
| 244 | aerosol | 24.00 | NA | CFU | rhesus monkey | beta-Poisson | 5.01E+01 | a = 1.45E-01 N50 = 5.01E+01 | death |
Sammons, L. S., Kenyon, R. H., & Pedersen, C. E. (1976). Effect of vaccination schedule on immune response of Macaca mulatta to cell culture-grown Rocky Mountain spotted fever vaccine. Journal of Clinical Microbiology, 4, 3. |
| 245 | intravenous | 5.00 | KHW | CFU | C57BL/6 mice | exponential | 2.18E+02 | k = 3.18E-03 | infection |
Meynell, G. G., & Meynell, E. W. (1958). The growth of micro-organisms in vivo with particular reference to the relation between dose and latent period. The Journal of Hygiene, 56(3). https://doi.org/10.1017/s0022172400037827 |
| 300 | aerosol | 24.00 | R1 | CFU | rhesus monkey | beta-Poisson | 1.88E+01 | a = 8.58E-01 N50 = 1.88E+01 | morbidity |
Saslaw, S. ., & Carlisle, H. N. (1966). Aerosol infection of monkeys with Rickettsia rickettsii. Bacteriological Reviews, 30, 3. |
| 300 and 301 | 27.00 | R1 and Sheila Smith | CFU | pooled | beta-Poisson | 2.13E+01 | a = 7.77E-01 N50 = 2.13E+01 | morbidity |
Saslaw, S. ., & Carlisle, H. N. (1966). Aerosol infection of monkeys with Rickettsia rickettsii. Bacteriological Reviews, 30, 3. |
|
| 301 | intradermal | 3.00 | Sheila Smith | CFU | human | beta-Poisson | 2.36E+01 | a = 6.75E-01 N50 = 2.36E+01 | clinical signs |
DuPont, H. ., Hornick, R. ., Dawkins, A. ., Heiner, G. ., Fabrikant, I. ., , & Woodward, T. . (1973). Rocky Mountain spotted fever: a comparative study of the active immunity induced by inactivated and viable pathogenic Rickettsia rickettsii. Journal of Infectious Diseases, 128, 340–344. |
|
||||||||||||||||||||||
|
||||||||||||||||||||||||||||||
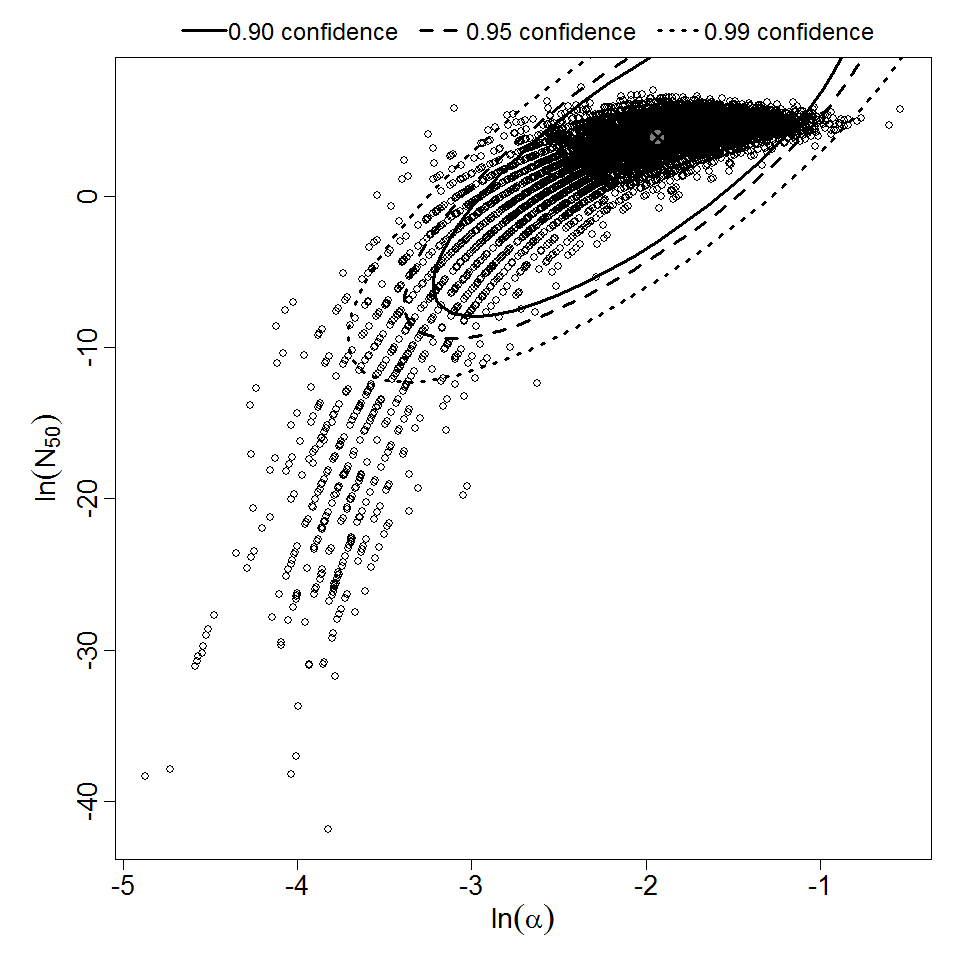
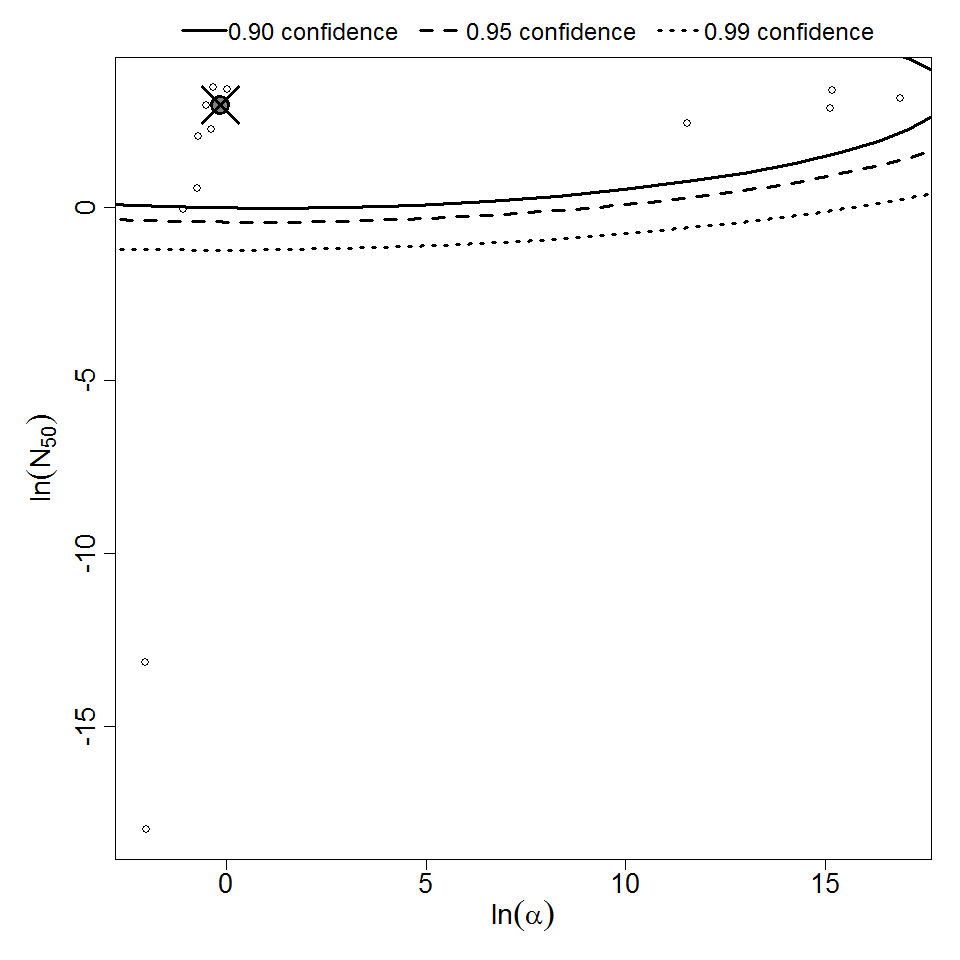
Parameter scatter plot for beta Poisson model ellipses signify the 0.9, 0.95 and 0.99 confidence of the parameters.

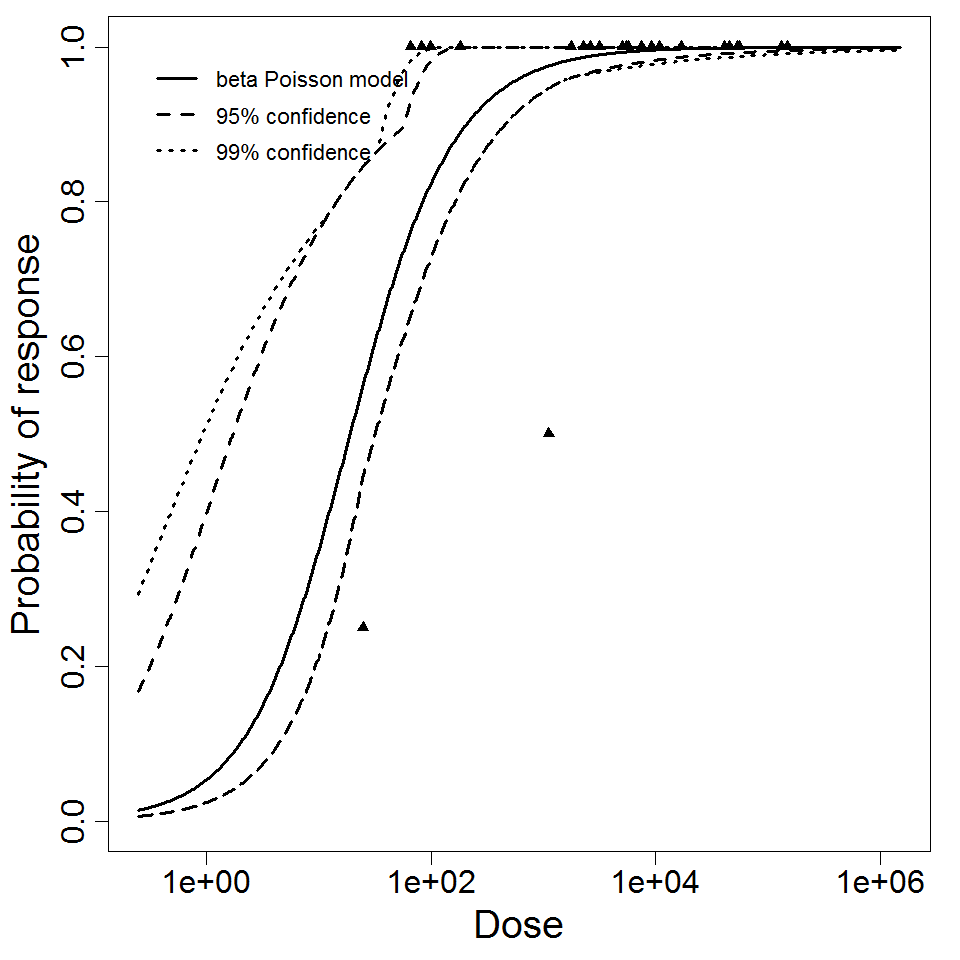
beta Poisson model plot, with confidence bounds around optimized model
|
|
||||||||||||||||||||||
|
||||||||||||||||||||||||||||||||||||||
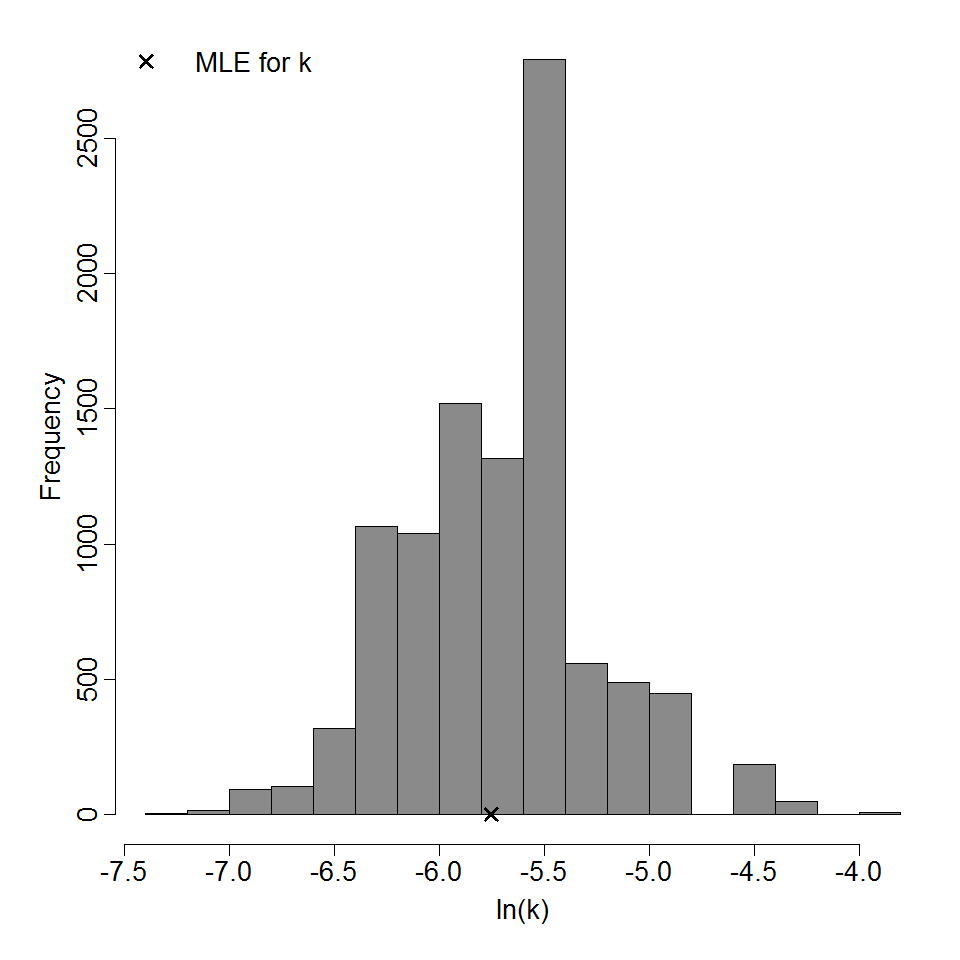
Parameter histogram for exponential model (uncertainty of the parameter)
Exponential model plot, with confidence bounds around optimized model
|
|
||||||||||||||||||||||
|
||||||||||||||||||||||||||||||
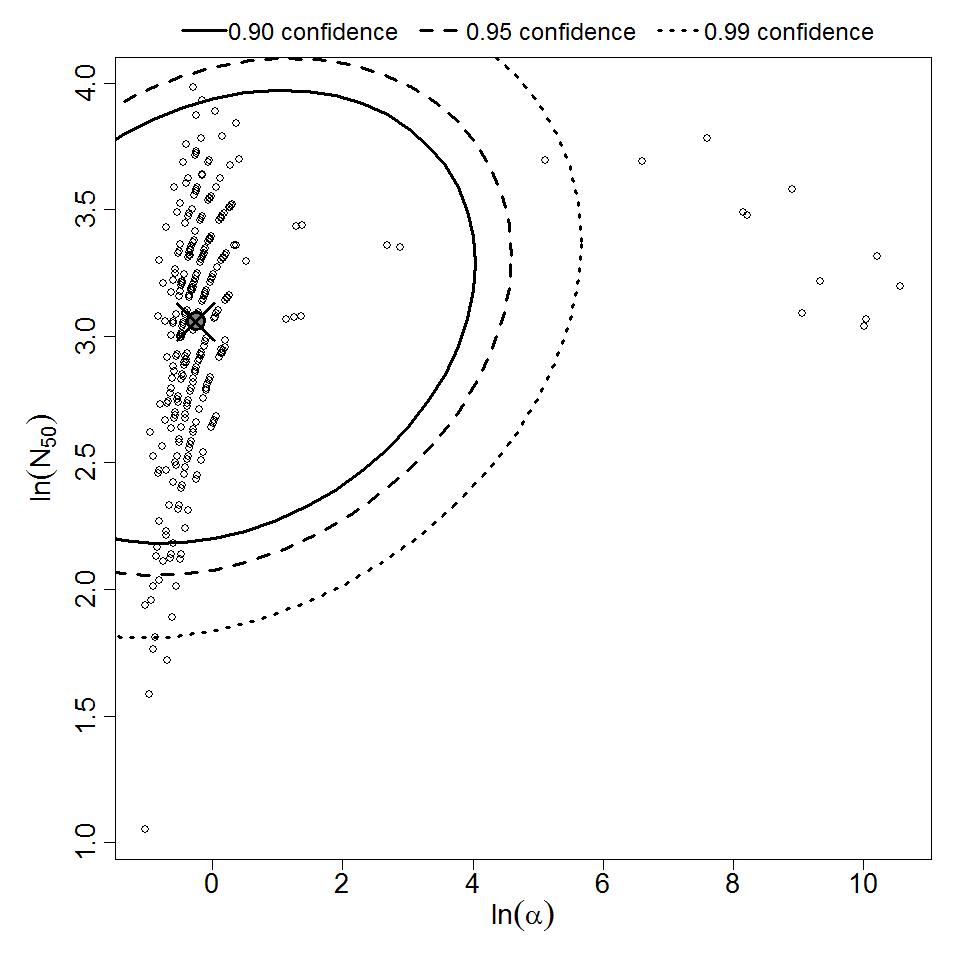
Parameter scatter plot for beta Poisson model ellipses signify the 0.9, 0.95 and 0.99 confidence of the parameters.
beta Poisson model plot, with confidence bounds around optimized model
|
|
||||||||||||||||||||||
|
||||||||||||||||||||||||||||||
Parameter scatter plot for beta Poisson model ellipses signify the 0.9, 0.95 and 0.99 confidence of the parameters.

beta Poisson model plot, with confidence bounds around optimized model
|
|
||||||||||||||||||||||
|
||||||||||||||||||||||||||||||
Parameter scatter plot for beta Poisson model ellipses signify the 0.9, 0.95 and 0.99 confidence of the parameters.

beta Poisson model plot, with confidence bounds around optimized model