| Experiment ID |
238
|
|---|---|
| Pathogen | |
| Agent Strain |
strain I
|
| Contains Preferred Model |
Yes
|
| Reference |
McCullough, N. ., & Elsele, C. . (1951). Experimental Human Salmonellosis: I. Pathogenicity of Strains of Salmonella Meleagridis and Salmonella Anatum Obtained from Spray-Dried Whole Egg. Oxford Journal of Infectious Diseases, 88(3). https://doi.org/https://doi.org/10.1093/infdis/88.3.278 |
| Exposure Route |
oral (with eggnog)
|
| Response |
infection
|
| Host type |
human
|
|---|---|
| # of Doses |
11.00
|
| Dose Units |
CFU
|
| Μodel |
beta-Poisson
|
| a |
3.89E-01
|
| N50 |
1.68E+04
|
| LD50/ID50 |
1.68E+04
|
Description
|
||||||||||||||||||||||
|
||||||||||||||||||||||||||||||
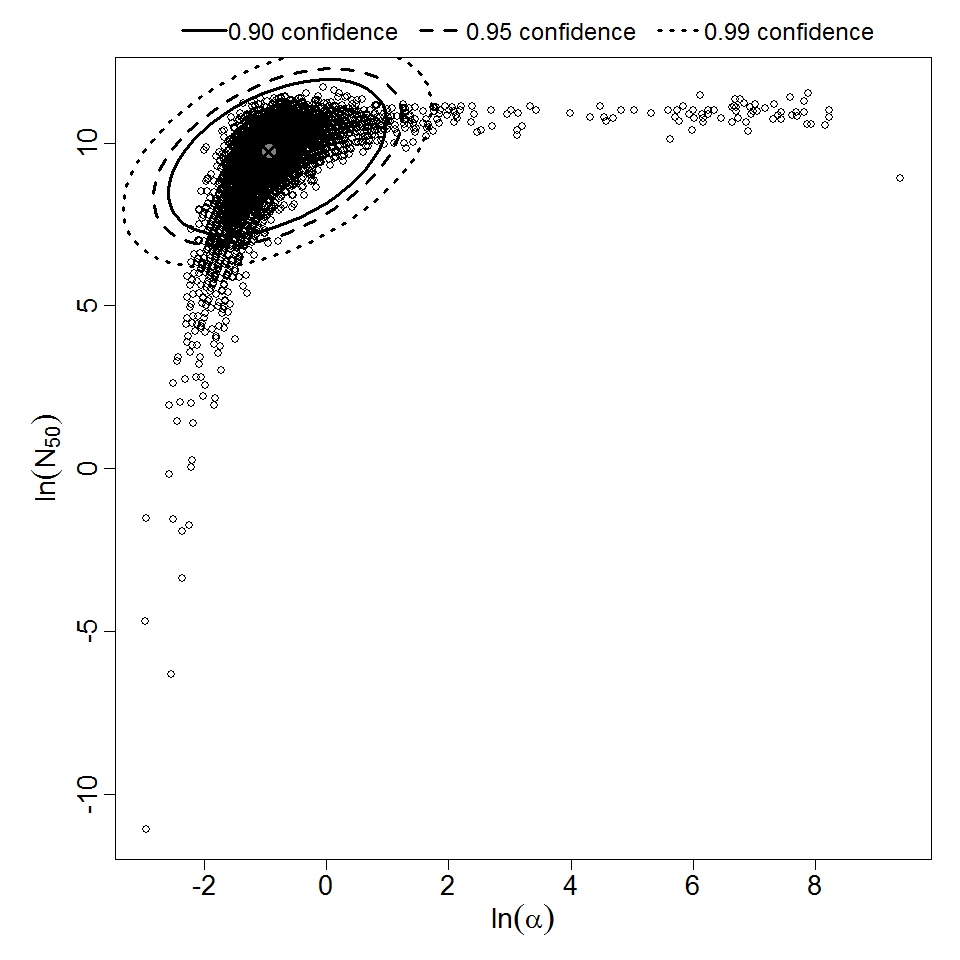
Parameter scatter plot for beta Poisson model ellipses signify the 0.9, 0.95 and 0.99 confidence of the parameters.
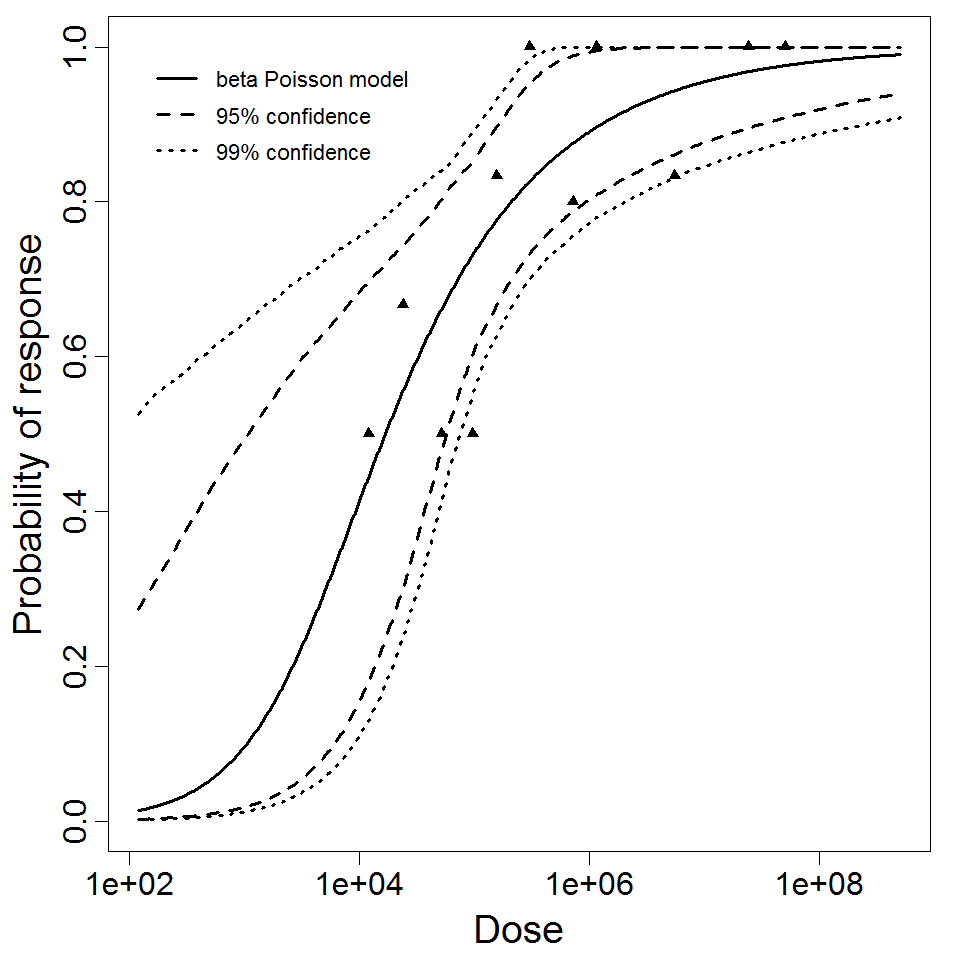
beta Poisson model plot, with confidence bounds around optimized model