General Overview
Salmonella enterica, serovar Typhi (S. Typhi for short, but formerly known as Salmonella typhi or Salmonella typhosa) causes typhoid fever. Paratyphoid fever is a similar syndrome (but less common and less severe than typhoid fever) caused by Salmonella enterica, serovar Typhi (S. Paratyphi). Typhoid and paratyphoid fevers are also jointly known as enteric fever. Other Salmonella enterica serovars (e.g., Enteritidis, Typhimurium) cause a gastroenteritis known as salmonellosis.
S. Typhi and S. Paratyphi only infect humans and are transmitted by the fecal-oral route. Disease may include any combination of the following: cough, constipation, diarrhea, abdominal pain, anorexia, rose spots on the torso, or fever. S. Typhi may also be shed asymptomatically for years in the feces of chronic carriers.
http://www.cdc.gov/nczved/divisions/dfbmd/diseases/typhoid_fever/
Summary of data
There have been two feeding studiesin male prisoners of the Quailes strain of S. Typhi (which was named Salmonella typhosa at that time).
Other model fits to these data have been published. However, these model fits exclude some of the experimental data for unclear reasons.
Recommended Model
The pooled model of experiment number 79 and 80 is the recommended model. Pooling is statistically accepted and it gives improvement in fits.
| ID | Exposure Route | # of Doses | Agent Strain | Dose Units | Host type | Μodel | LD50/ID50 | Optimized parameters | Response type | Reference |
|---|---|---|---|---|---|---|---|---|---|---|
| 79 | oral (in milk) | 3.00 | Quailes | CFU | human | beta-Poisson | 3.45E+06" | a = 1.11E-01 N50 = 3.45E+06 | disease |
Hornick, R. B., Greisman, S. ., Woodward, T. E., DuPont, H. L., Dawkins, A. T., & Snyder, M. J. (1970). Typhoid fever: pathogenesis and immunologic control. The New England Journal of Medicine, 283, 13. |
| 79, 80 | oral (in milk) | 8.00 | Quailes | CFU | human | beta-Poisson | 1.11E+06 | a = 1.75E-01 N50 = 1.11E+06 | disease |
Hornick, R. ., Woodward, T. ., McCrumb, F. ., Snyder, M. ., Dawkins, A. ., Bulkeley, J. ., … Corozza, F. . (1966). Study of induced typhoid fever in man. I. Evaluation of vaccine effectiveness. Transactions of the Association of American Physicians, 79, 361-367. Retrieved from https://pubmed.ncbi.nlm.nih.gov/5929469/ |
| 80 | oral (in milk) | 5.00 | Quailes | CFU | human | beta-Poisson | 8.53E+05 | a = 2.03E-01 N50 = 8.53E+05 | disease |
Levine, M. M., DuPont, H. L., Formal, S. B., Hornick, R. B., Takeuchi, A. ., Gangarosa, E. J., … Libonati, J. P. (1973). Pathogenesis of Shigella dysenteriae 1 (Shiga) Dysentery. Journal of Infectious Diseases, 127, 3. |
|
|
||||||||||||||||||||||
|
||||||||||||||||||||||||||||||
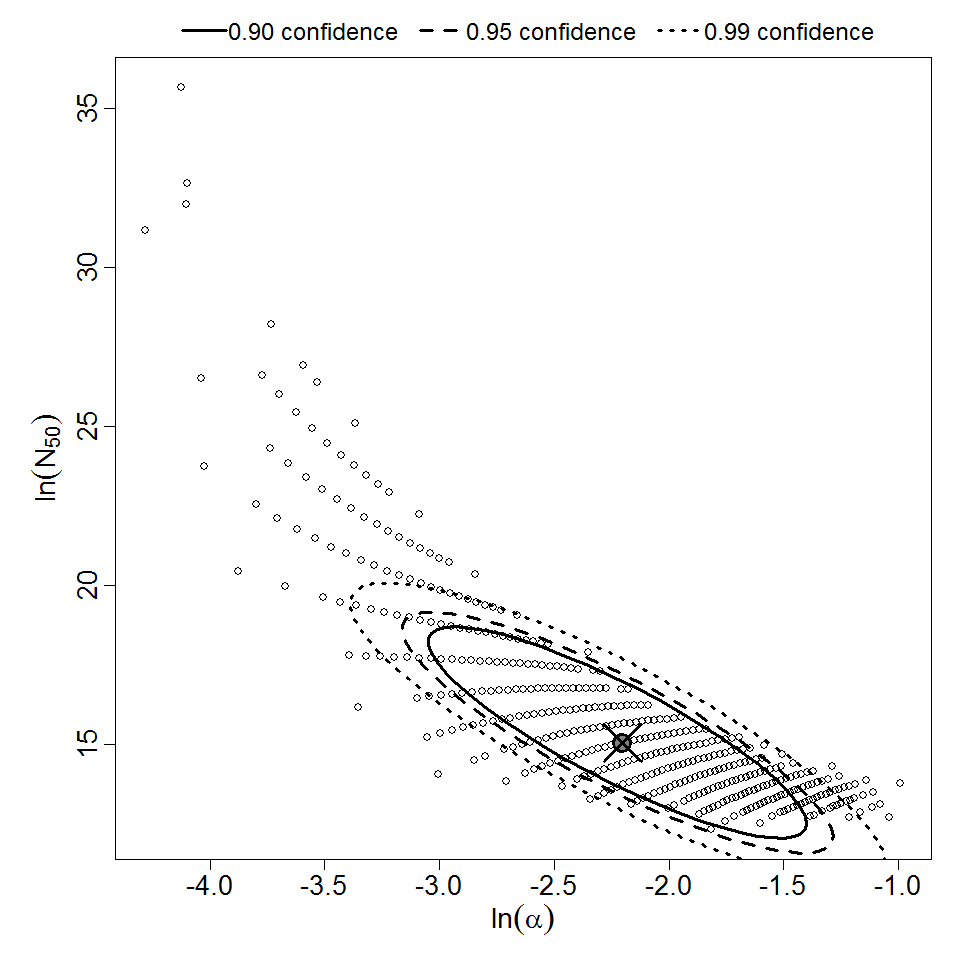
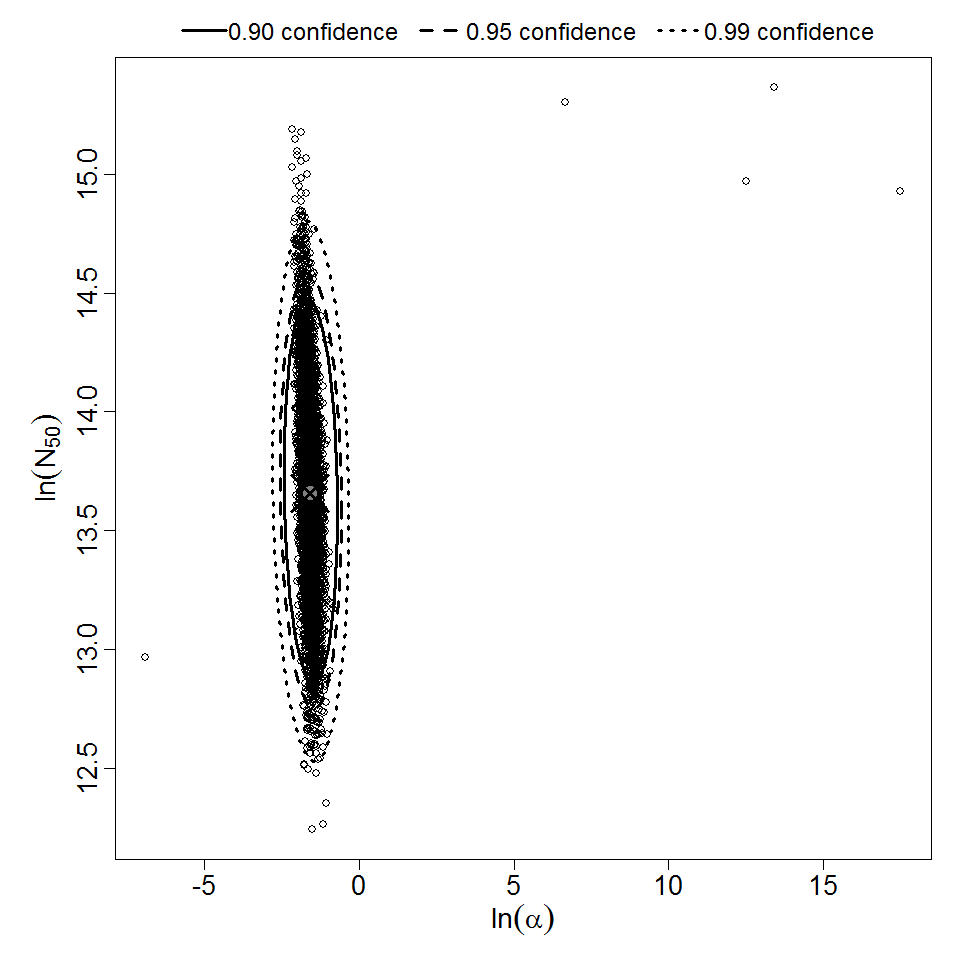
Parameter scatter plot for beta Poisson model ellipses signify the 0.9, 0.95 and 0.99 confidence of the parameters.
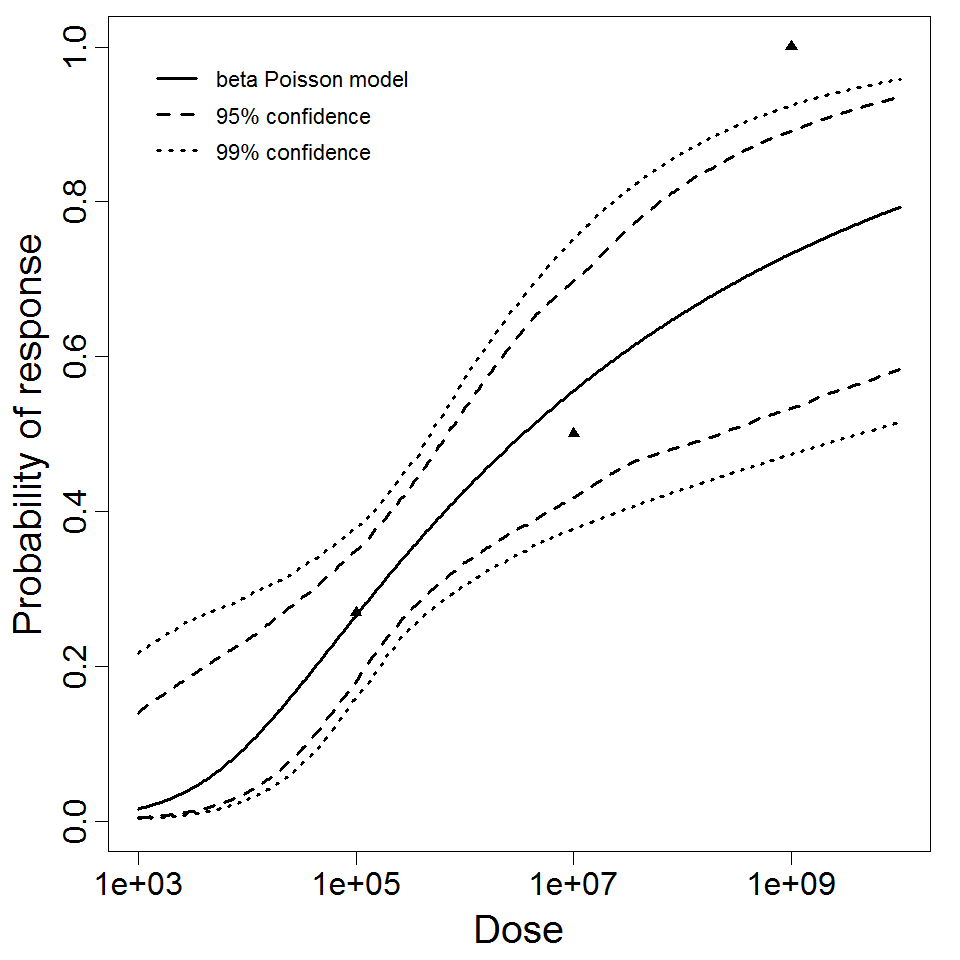
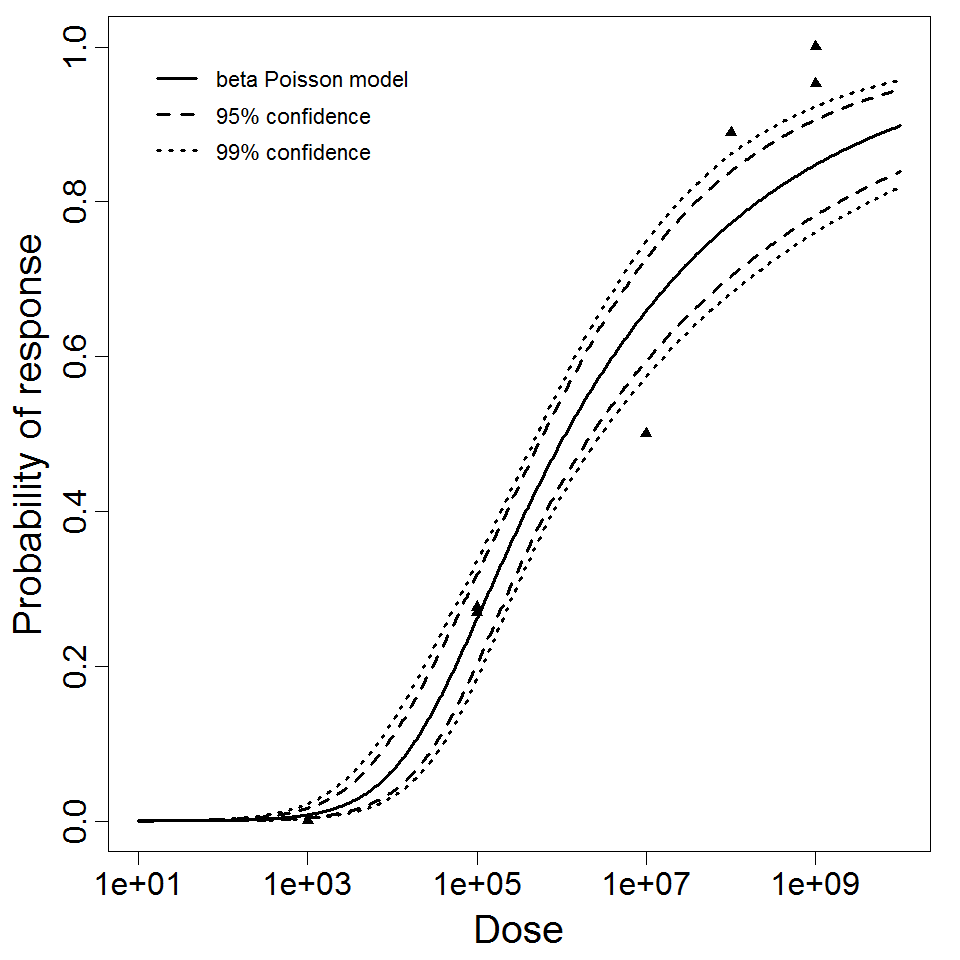
beta Poisson model plot, with confidence bounds around optimized model
|
|
||||||||||||||||||||||
|
||||||||||||||||||||||||||||||
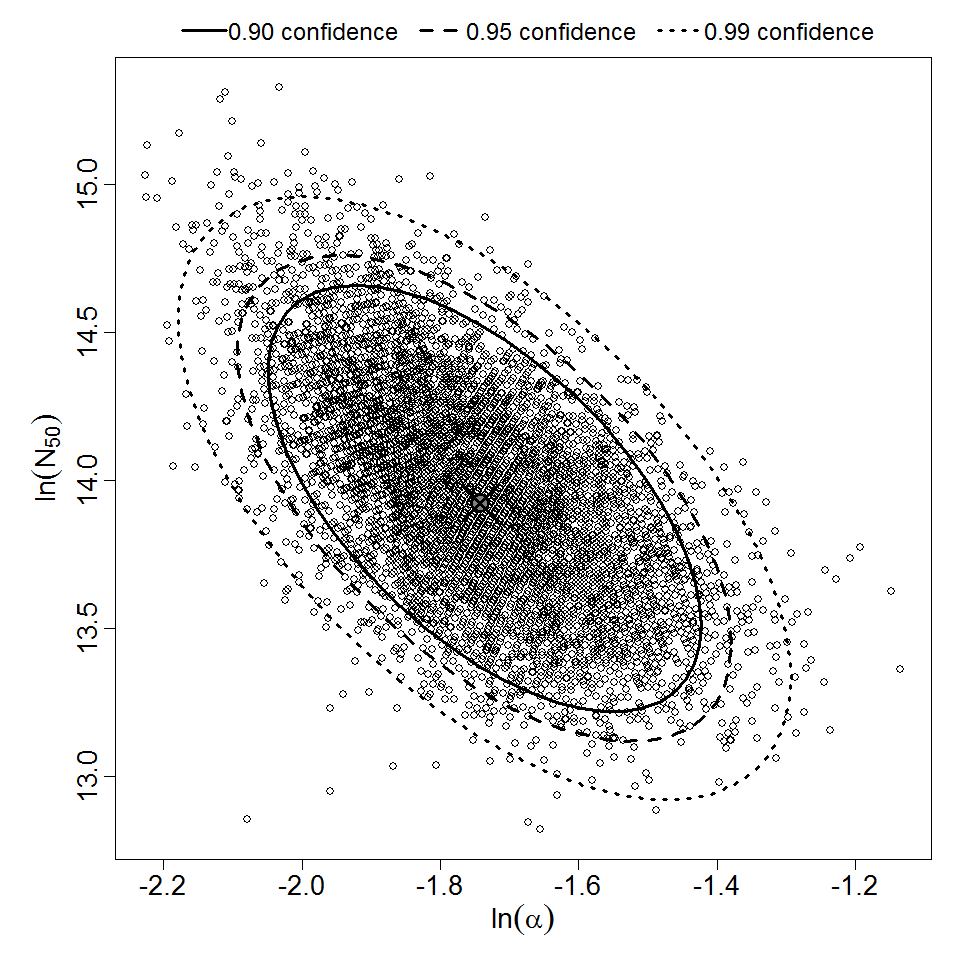
Parameter scatter plot for beta Poisson model ellipses signify the 0.9, 0.95 and 0.99 confidence of the parameters.
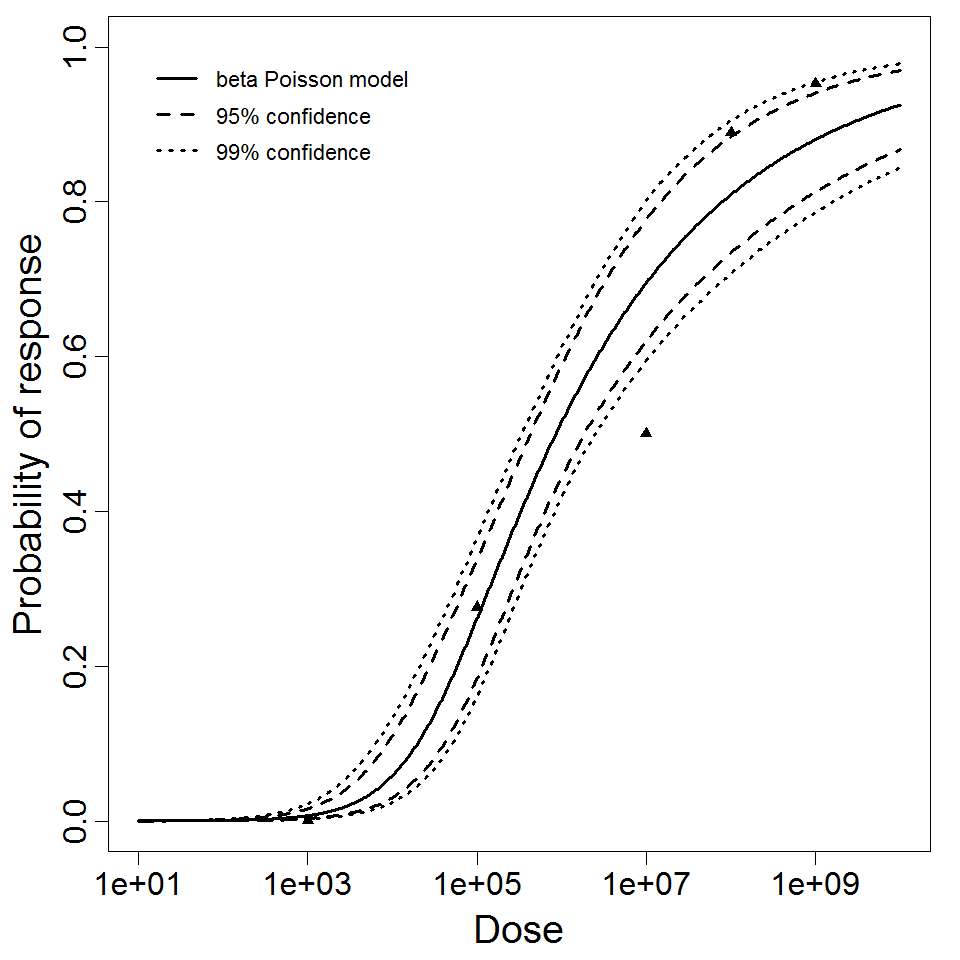
beta Poisson model plot, with confidence bounds around optimized model
|
|
||||||||||||||||||||||
|
||||||||||||||||||||||||||||||
Parameter scatter plot for beta Poisson model ellipses signify the 0.9, 0.95 and 0.99 confidence of the parameters.
beta Poisson model plot, with confidence bounds around optimized model