General Overview
Shigella sp. are very closely related to E. coli and probably technically belong to that species; however, because of their disease significance, the distinct names are still used.[1] The most common types in developing countries are Shigella flexneri (~60% of cases) and Shigella sonnei (~15% of cases), with S. boydiiand S. dysenteriae contributing ~6% each. However, S. dysenteriae type 1 can spread in epidemics and tends to cause more severe and complicated disease. Nearly all cases occur in developing countries, with 69% of cases in children under 5 years of age.
Shigella tends to cause dysentery (diarrhea with blood or mucus) by invading the mucosa of the colon, leading to ulceration and bleeding. It is usually self-limited after 4-7 days, but it tends to be more serious than watery diarrhea and is not effectively treated by oral rehydration solution. Pandemic waves of shigellosis have been described since the 1960s, and can cause high mortality, especially among refugees. Shigellosis is limited to human hosts. Vaccines against Shigella are currently under development.
http://www.cdc.gov/nczved/divisions/dfbmd/diseases/shigellosis/
Summary of data
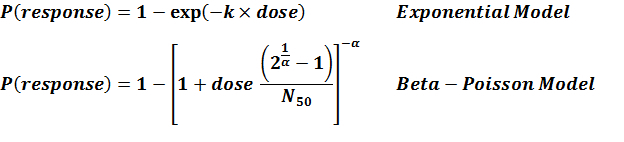
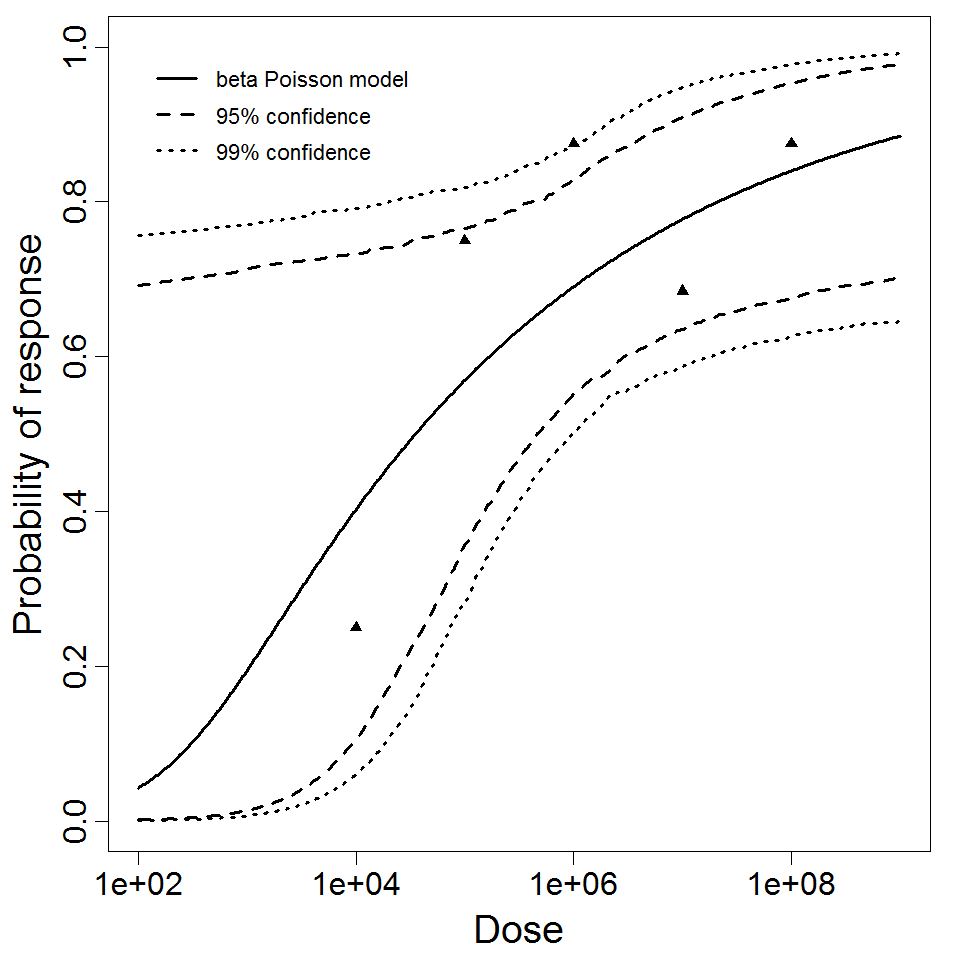
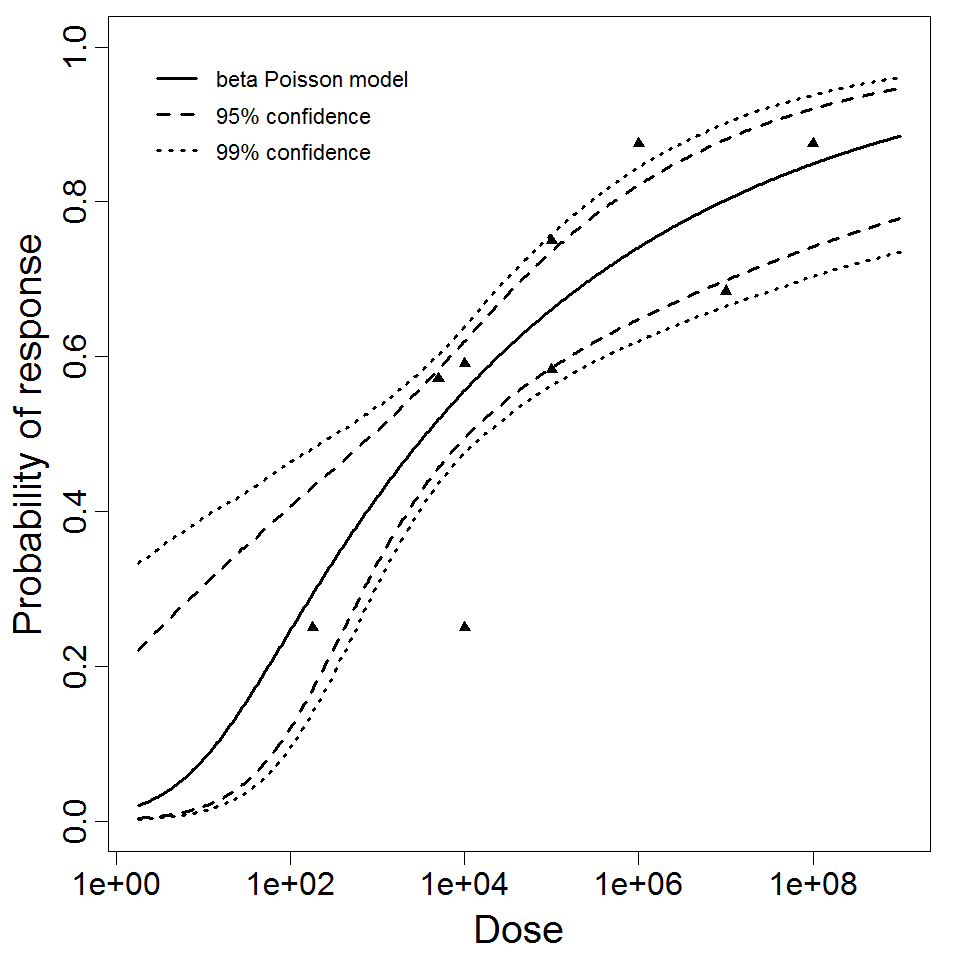
Levine et al. (1973) gave S. dysenteriae strains M 131 and A-1 in milk to healthy young adult male prisoners, and measured illness as the outcome. Four dose levels were used for strain M 131, but only 2 dose levels were used for strain A-1. Data for strain M 131 are fit well by the beta-Poisson model, although the confidence intervals are wide. However, a poor fit is obtained if the data from strain A-1 are pooled with M 131. Powell (2000) reports a beta-Poisson model fit to the pooled data for strains M 131 and A-1.
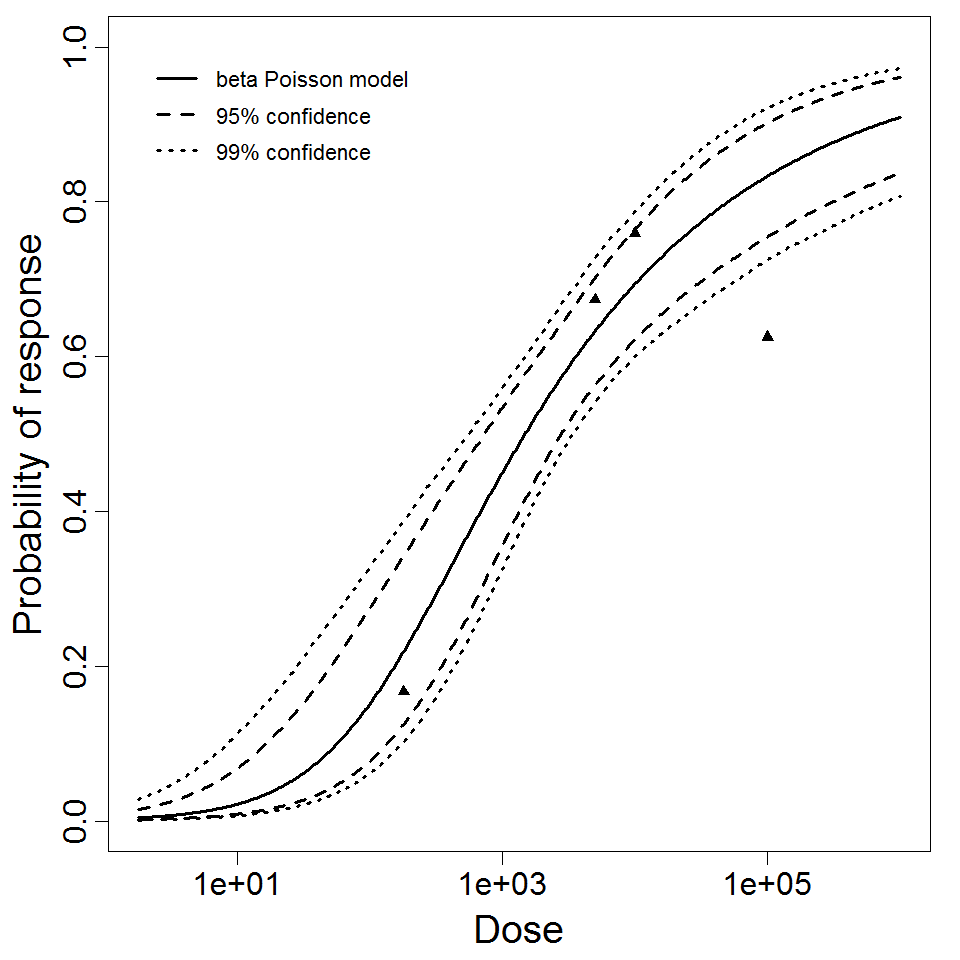
DuPont et al. (1969 & 1972) conducted feeding studies of S. flexneri 2a (strain 2457T) in healthy male prisoners. A smaller study used 5 doses in 31 subjects; a larger study used 4 doses among 196 subjects. The smaller study only recorded illness as the response; however, the larger study recorded both illness and infection. The smaller study tested a wide dose range, from 104 to 108 CFU; however, the proportion ill did not change greatly over the range of 105 – 108 (68-88% ill). The beta-Poisson model fits better than the exponential model for each of these 3 datasets. It fits well for the two datasets using illness as a response (DuPont et al. 1969 & 1972), but fits poorly for the infection response.
There have been two feeding studies in male prisoners of S. sonnei 53G; however, they both used a dose of 500 CFU in all subjects. However, 7/20 subjects became ill in one study, and 19/38 in the other, implying that this dose is close to the ID50.
There have been many additional feeding studies evaluating attenuated strains of Shigella for use in vaccines (e.g., DuPont et al. 1972a , Levine et al. 1973 , Kotloff et al. 1995). However, these are not included here since attenuated strains are deliberately intended to be less infectious or pathogenic than wild strains, and using dose response models based on such experiments might lead to underestimation of risk.
Pooling analysis of all datasets using illness as the response could not disprove the hypothesis that the datasets could be pooled (P > 0.05). However, separate pooled models are also provided for S. dysenteriae and S. flexneri. A previously published pooling analysis excluded one dose level (1E7 CFU) from experiment 82. Although that dose level contributed disproportionately to the deviance, it was also the dose level with the largest sample size (19 volunteers; the next largest sample size was 8 volunteers); therefore, it was retained in all analyses conducted for this chapter.
Recommended Model