General Overview
The famous case of John Snow in London is well known, as an investigation of a cholera outbreak and provided the first in proof of a linkage between the presence of a pathogen in water and a water borne current outbreak. Cholera has remained a major health risk to populations around the world. Vibrio cholerae (V. cholerae) is a gram negative bacterium, the causative agent of cholera, which causes very watery stool, typically referred to rice-watery stool.
Person to person transmission has been typically assumed to be minimal probably due the dose response parameters. However, the main risk posed from this pathogen has always been considered from primary exposure, contaminated water.
http://www.cdc.gov/cholera/index.html
Summary Data
Hornick et al. (1971) has a broad repository of both human and animal data. The most interesting data sets in this study are human exposure where the onset of symptoms as well as indication of asymptomatic infection were monitored. Additionally, both diarrhea and cholera diarrhea (very different in appearance) were also monitored as symptoms.
Cash et al. (1974) has only one dataset which showed a significant trend between dose and observed probability of response. Interestingly, this study determined that in human volunteer feeding trials, the reduction of pH in subject stomachs decreased the overall dose required for a similar response. This was accomplished using sodium bicarbonate, essentially ant-acid treatment, thus demonstrating the effectiveness of higher pH in some protection from V. cholerea.
Recommended Model
Experiment number 249 is recommended model as it has lowest ID50 among the models.

| ID | Exposure Route | # of Doses | Agent Strain | Dose Units | Host type | Μodel | LD50/ID50 | Optimized parameters | Response type | Reference |
|---|---|---|---|---|---|---|---|---|---|---|
| 126 | oral (with NaHCO3) | 6.00 | Inaba 569B | CFU | human | beta-Poisson | 6.82E+03 | a = 3.18E-01 N50 = 6.82E+03 | any diarrhea |
Kotak, B. G., Kenefick, S. L., Fritz, D. L., Rousseaux, C. G., Prepas, E. E., & Hrudey, S. E. (1993). Occurrence and toxicological evaluation of cyanobacterial toxins in Alberta lakes and farm dugouts. Water Research, 27, 3. |
| 128 | oral (with NaHCO3) | 6.00 | Inaba 569B | CFU | human | beta-Poisson | 3.88E+07 | a = 1.10E-01 N50 = 3.88E+07 | cholera diarrhea |
McCullough, N. ., & Elsele, C. . (1951). Experimental Human Salmonellosis: I. Pathogenicity of Strains of Salmonella Meleagridis and Salmonella Anatum Obtained from Spray-Dried Whole Egg. Oxford Journal of Infectious Diseases, 88(3). https://doi.org/https://doi.org/10.1093/infdis/88.3.278 |
| 167 | oral (no NaHCO3) | 7.00 | Inaba 569B (classical) | CFU | human | beta-Poisson | 2.91E+09 | a = 1.31E-01 N50 = 2.91E+09 | diarrhea and culture positive |
Levine, M. ., Black, R. ., , Clements, M. ., Fusco, P. ., Hughes, T. ., … Young, C. . (1982). Reactogenicity, immunogenicity and efficacy studies of Escherichia coli type 1 somatic pili parenteral vaccine in man. Scandinavian Journal of Infectious Diseases. Supplementum, 33, 83–95. |
| 249 | oral (with NaHCO3) | 6.00 | Inaba 569B | CFU | human | beta-Poisson | 2.43E+02 | a = 2.50E-01 N50 = 2.43E+02 | infection |
Diringer, H. ., Roehmel, J. ., & Beekes, M. . (1998). Effect of repeated oral infection of hamsters with scrapie. Journal of General Virology, 79. Retrieved from http://citeseerx.ist.psu.edu/viewdoc/download?doi=10.1.1.541.3587&rep=rep1&type=pdf |
| 35 | oral (no NaHCO3) | 7.00 | Inaba 569B | CFU | human | beta-Poisson | 6.36E+08 | a = 1.98E-01 N50 = 6.36E+08 | diarrhea or culture positive |
Hornick, R. B., Music, S. I., Wenzel, R. ., Cash, R. ., Libonati, J. P., Snyder, M. J., & Woodward, T. E. (1971). The Broad Street pump revisited: response of volunteers to ingested cholera vibrios. Bulletin of the New York Academy of Medicine, 47, 10. Retrieved from https://www.ncbi.nlm.nih.gov/pmc/articles/PMC1749960/ |
|
|
||||||||||||||||||||||
|
||||||||||||||||||||||||||||||
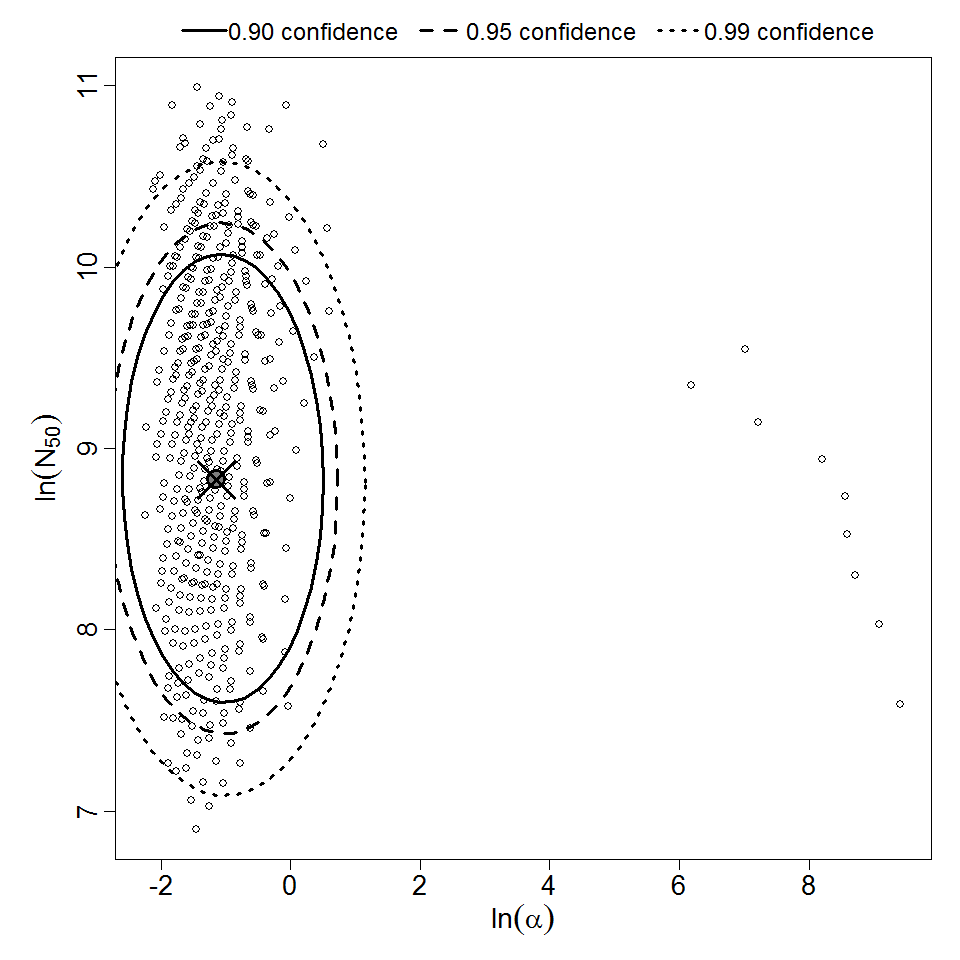
Parameter scatter plot for beta Poisson model ellipses signify the 0.9, 0.95 and 0.99 confidence of the parameters.

beta Poisson model plot, with confidence bounds around optimized model
|
|
||||||||||||||||||||||
|
||||||||||||||||||||||||||||||
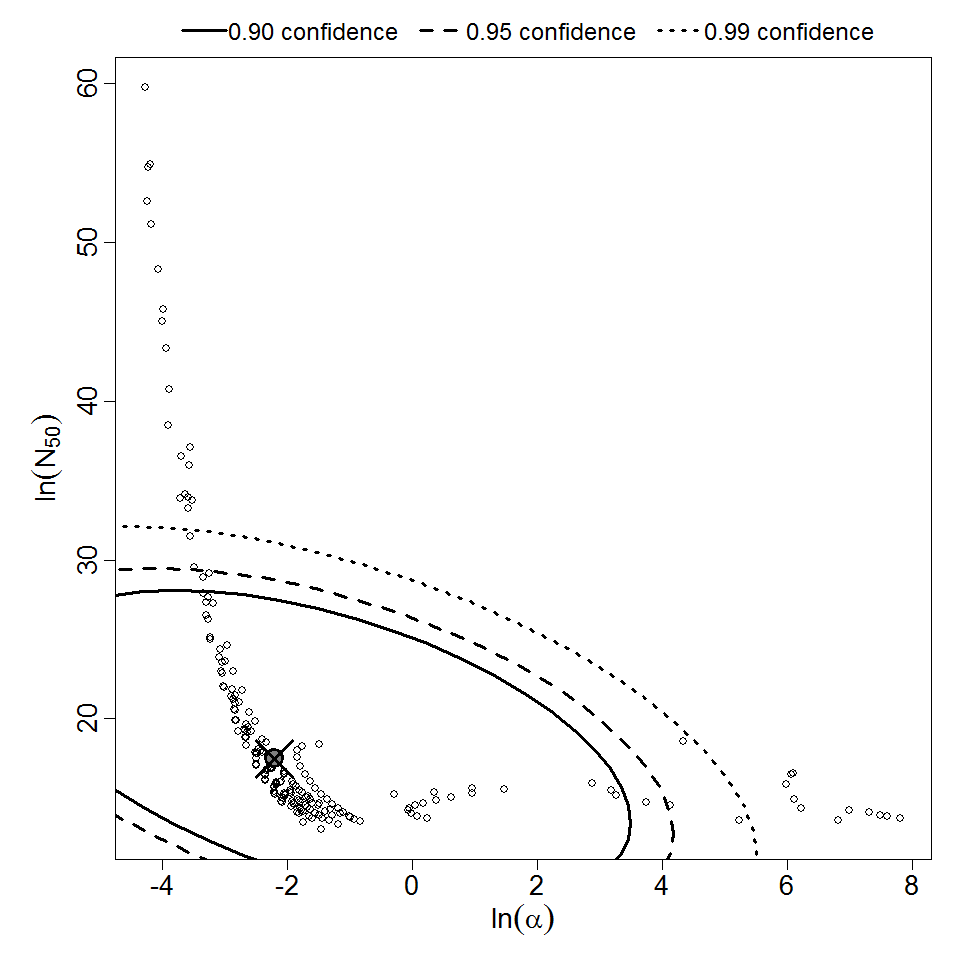
Parameter scatter plot for beta Poisson model ellipses signify the 0.9, 0.95 and 0.99 confidence of the parameters.

beta Poisson model plot, with confidence bounds around optimized model
|
|
||||||||||||||||||||||
|
||||||||||||||||||||||||||||||
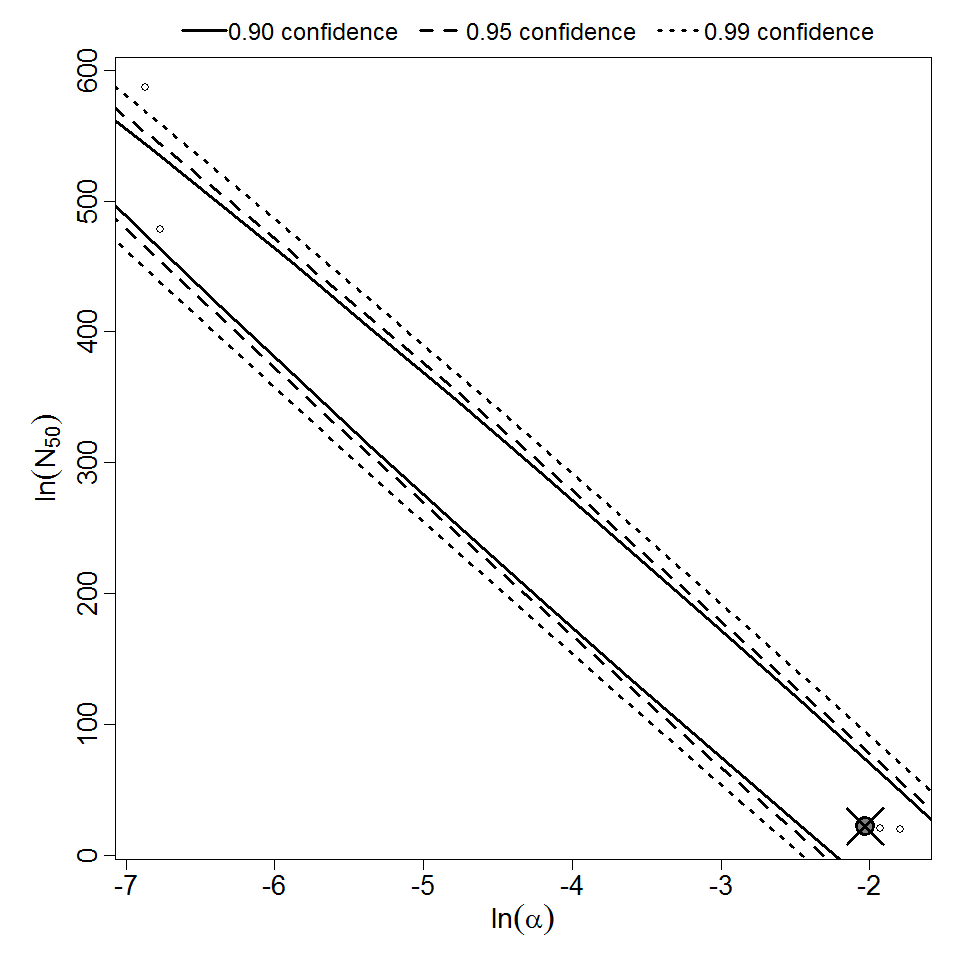
Parameter scatter plot for beta Poisson model ellipses signify the 0.9, 0.95 and 0.99 confidence of the parameters.

beta Poisson model plot, with confidence bounds around optimized model
|
|
||||||||||||||||||||||
|
||||||||||||||||||||||||||||||

Parameter scatter plot for beta Poisson model ellipses signify the 0.9, 0.95 and 0.99 confidence of the parameters.
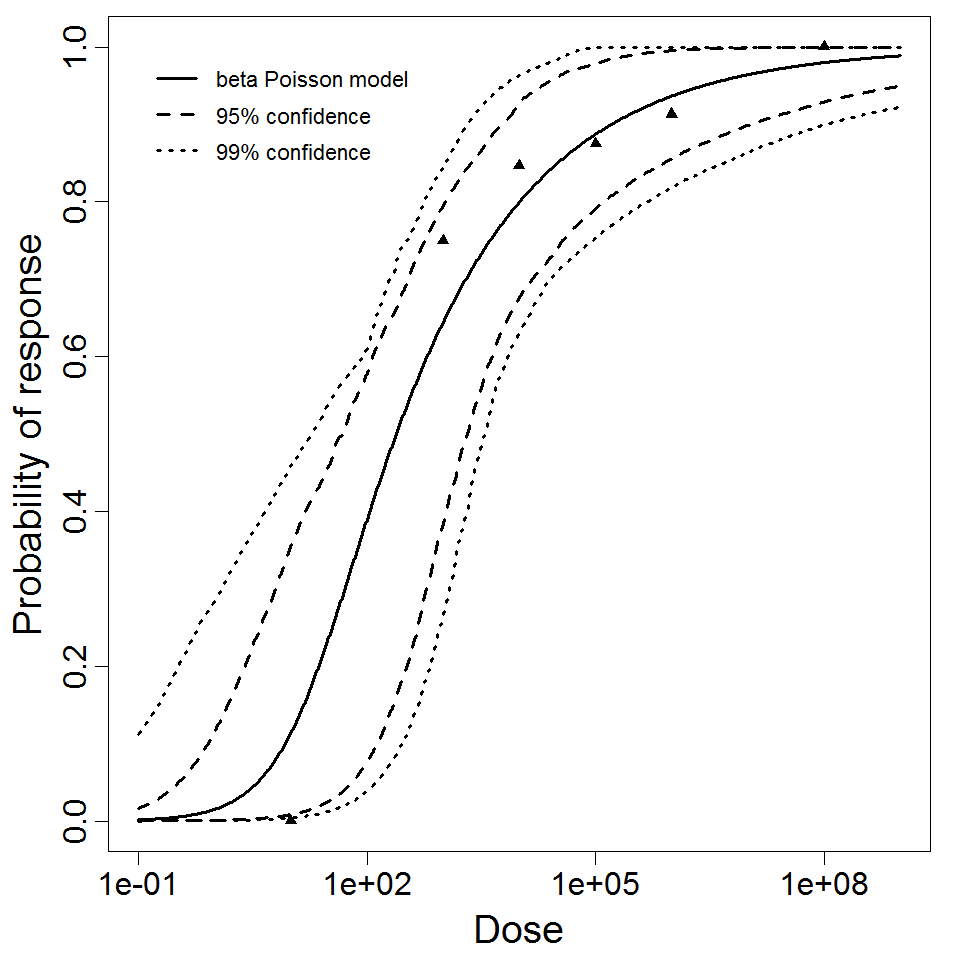
beta Poisson model plot, with confidence bounds around optimized model
Please Note
The results from this experiment are not recommended for use, rather they are present for reference purposes. The confidence intervals are not complete for this experiment since the data is not allowing for a stable bootstrap outcome. It is recommended to use the recommended model as this data is likely just capable of passing the test of trend, but still likely suboptimal for dose response modeling purposes.
|
|
||||||||||||||||||||||
|
||||||||||||||||||||||||||||||
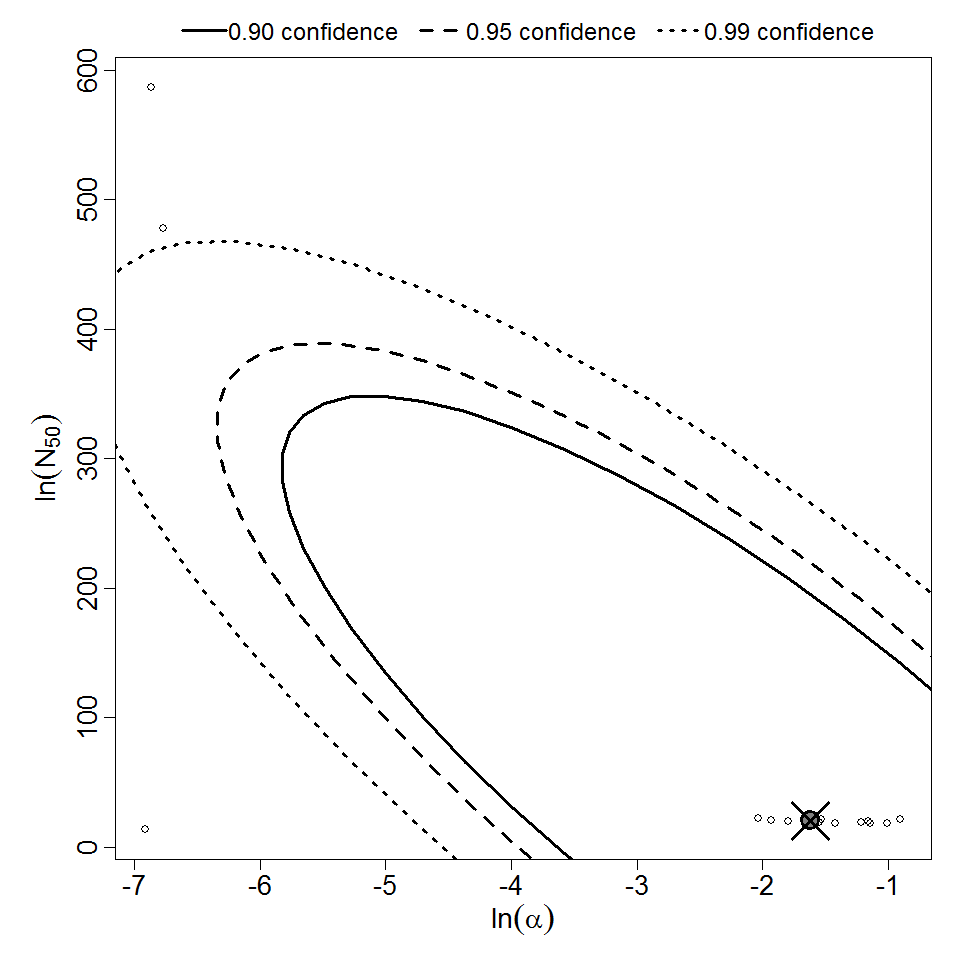
Parameter scatter plot for beta Poisson model ellipses signify the 0.9, 0.95 and 0.99 confidence of the parameters.

beta Poisson model plot, with confidence bounds around optimized model