Description
|
||||||||||||||||||||||
|
||||||||||||||||||||||||||||||
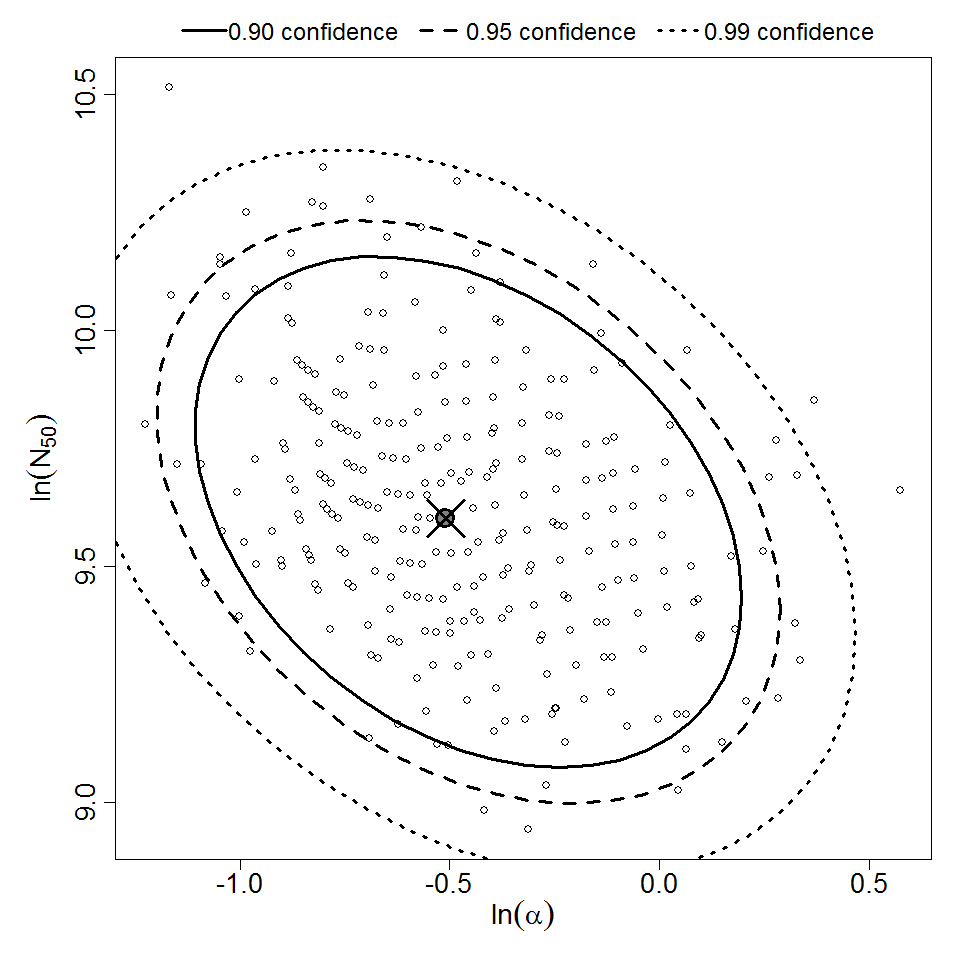
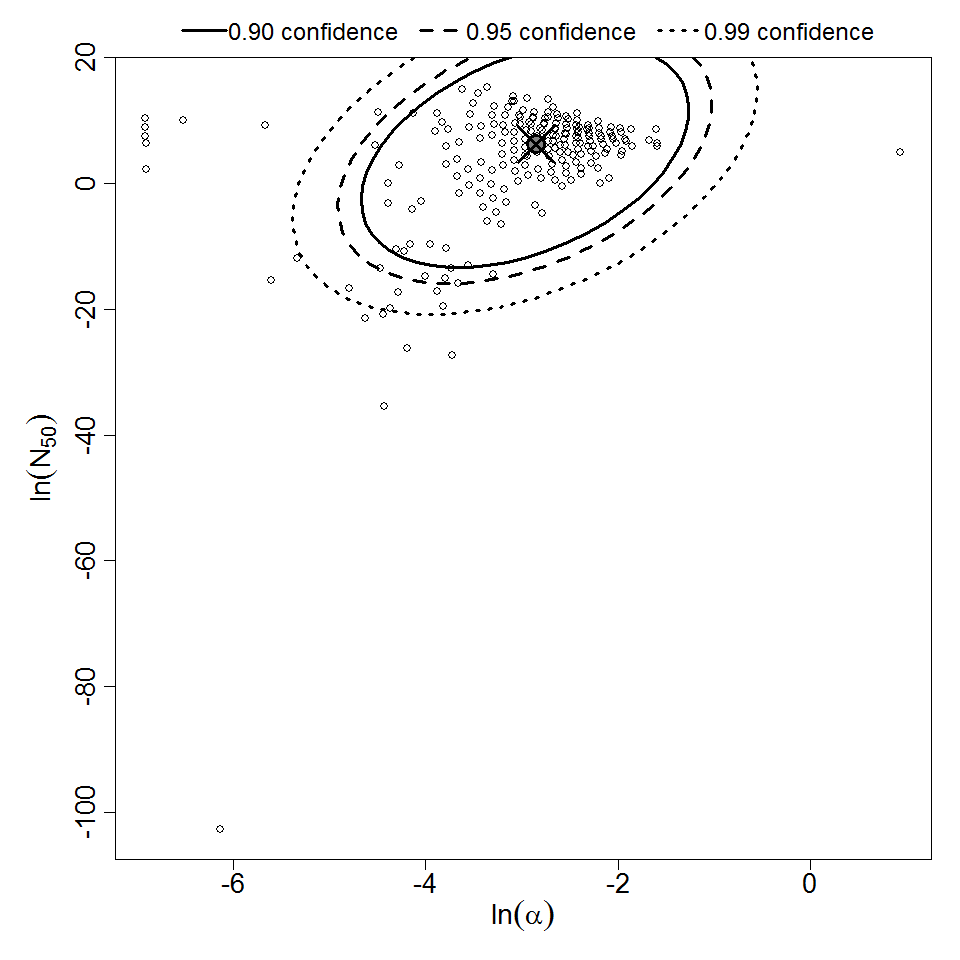
Parameter scatter plot for beta Poisson model ellipses signify the 0.9, 0.95 and 0.99 confidence of the parameters.
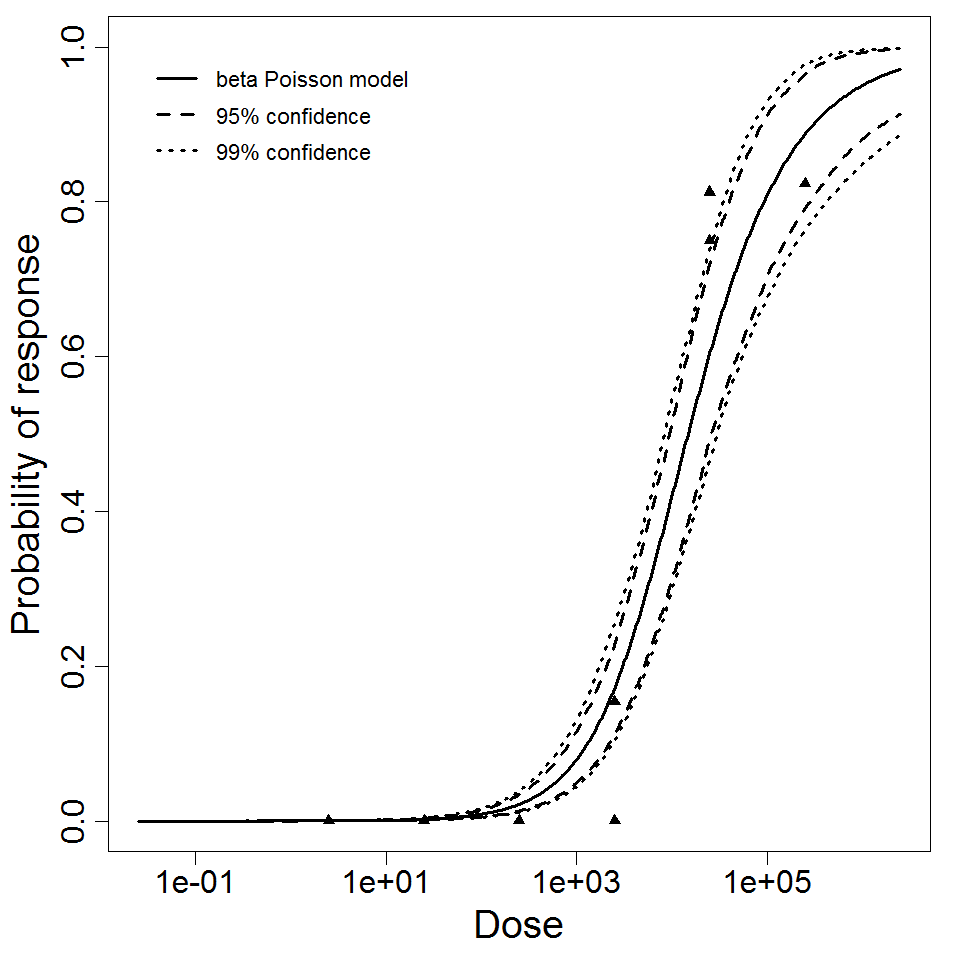
beta Poisson model plot, with confidence bounds around optimized model
# of Doses
12.00
Μodel
N50
1.48E+04
LD50/ID50
1.48E+04
Dose Units
Response
Exposure Route
Contains Preferred Model
a
6.01E-01
Agent Strain
ATCC 19660
Experiment ID
283,284
Host type
Description
|
|
||||||||||||||||||||||
|
||||||||||||||||||||||||||||||
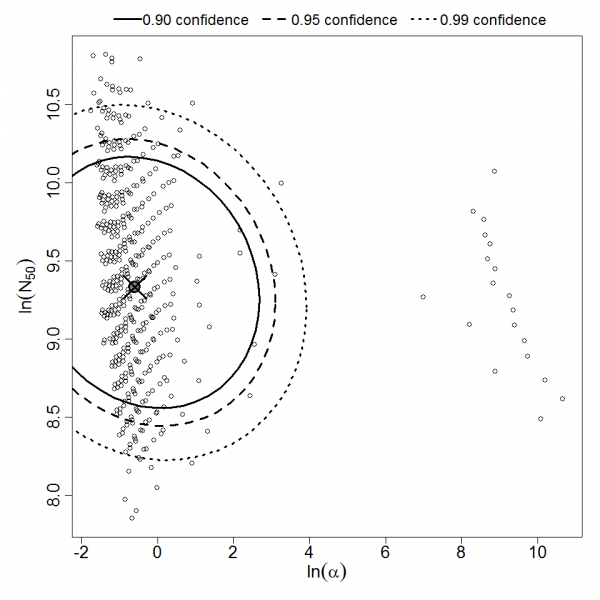
Parameter scatter plot for beta Poisson model ellipses signify the 0.9, 0.95 and 0.99 confidence of the parameters.
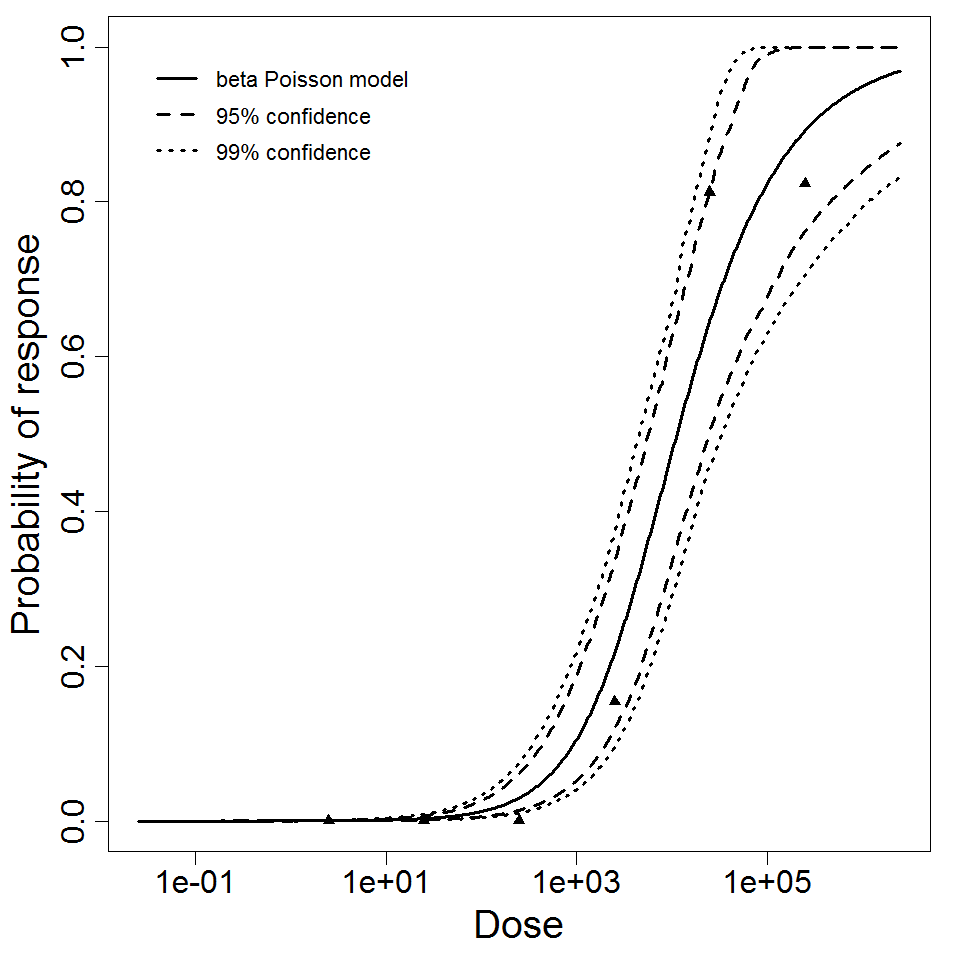
beta Poisson model plot, with confidence bounds around optimized model
# of Doses
6.00
Μodel
N50
1.13E+04
LD50/ID50
1.13E+04
Dose Units
Response
Exposure Route
Contains Preferred Model
a
5.49E-01
Agent Strain
ATCC 19660
Experiment ID
284
Host type
Description
|
|
||||||||||||||||||||||
|
||||||||||||||||||||||||||||||
Parameter scatter plot for beta Poisson model ellipses signify the 0.9, 0.95 and 0.99 confidence of the parameters.

beta Poisson model plot, with confidence bounds around optimized model
# of Doses
6.00
Μodel
N50
1.93E+04
LD50/ID50
1.93E+04
Dose Units
Response
Exposure Route
Contains Preferred Model
a
6.73E-01
Agent Strain
ATCC 19660
Experiment ID
283
Host type