Pseudomonas aeruginosa (bacterimia): Dose Response Models
| ID | Exposure Route | # of Doses | Agent Strain | Dose Units | Host type | Μodel | LD50/ID50 | Optimized parameters | Response type | Reference |
|---|---|---|---|---|---|---|---|---|---|---|
| 281 | injected in eyelids | 6.00 | ATCC 19660 | CFU | Swiss webster mice (5day old) | exponential | 8.13E+03 | k = 8.52E-05 | death |
Hazlett, L. D., Rosen, D. D., & Berk, R. S. (1978). Age-Related Susceptibility to Pseudomonas aeruginosa Ocular Infections in Mice. Infection and Immunity, 20, 1. |
| 281,282 (pooled) | injected in eyelids | 12.00 | ATCC 19660 | CFU | Swiss webster mice (5day old) | exponential | 6.61E+03 | k = 1.05E-04 | death |
Hazlett, L. D., Rosen, D. D., & Berk, R. S. (1978). Age-Related Susceptibility to Pseudomonas aeruginosa Ocular Infections in Mice. Infection and Immunity, 20, 1. |
| 282 | injected in eyelids | 6.00 | ATCC 19660 | CFU | Swiss webster mice (5day old) | exponential | 4.98E+03 | k = 1.39E-04 | death(after day 21) |
Hazlett, L. D., Rosen, D. D., & Berk, R. S. (1978). Age-Related Susceptibility to Pseudomonas aeruginosa Ocular Infections in Mice. Infection and Immunity, 20, 1. |
| 283 | injected in eyelids | 6.00 | ATCC 19660 | CFU | Swiss webster mice(10day old) | beta-Poisson | 1.93E+04 | a = 6.73E-01 N50 = 1.93E+04 | death(after day 1) |
Hazlett, L. D., Rosen, D. D., & Berk, R. S. (1978). Age-Related Susceptibility to Pseudomonas aeruginosa Ocular Infections in Mice. Infection and Immunity, 20, 1. |
| 283,284 | injected in eyelids | 12.00 | ATCC 19660 | CFU | Swiss webster mice(10day old) | beta-Poisson | 1.48E+04 | a = 6.01E-01 N50 = 1.48E+04 | death |
Hazlett, L. D., Rosen, D. D., & Berk, R. S. (1978). Age-Related Susceptibility to Pseudomonas aeruginosa Ocular Infections in Mice. Infection and Immunity, 20, 1. |
| 284 | injected in eyelids | 6.00 | ATCC 19660 | CFU | Swiss webster mice(10day old) | beta-Poisson | 1.13E+04 | a = 5.49E-01 N50 = 1.13E+04 | death(after day 2-21) |
Hazlett, L. D., Rosen, D. D., & Berk, R. S. (1978). Age-Related Susceptibility to Pseudomonas aeruginosa Ocular Infections in Mice. Infection and Immunity, 20, 1. |
|
|
||||||||||||||||||||||
|
||||||||||||||||||||||||||||||||||||||
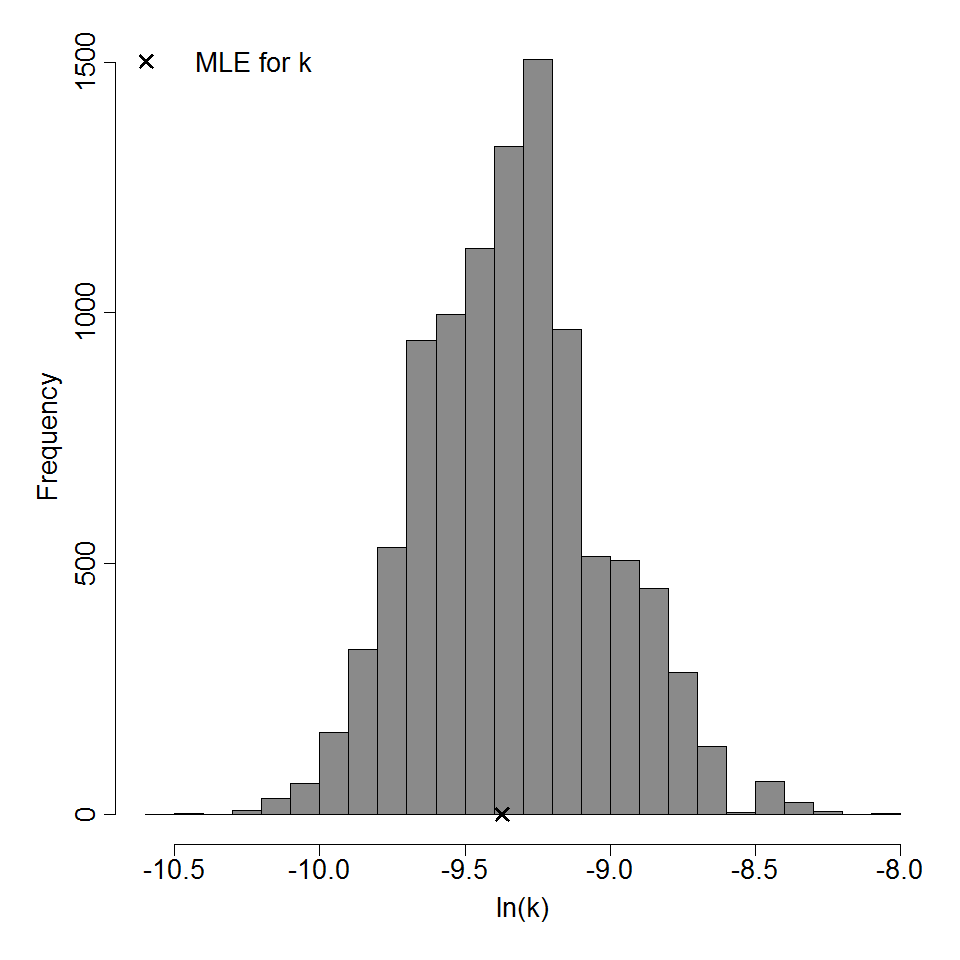
Parameter histogram for exponential model (uncertainty of the parameter)
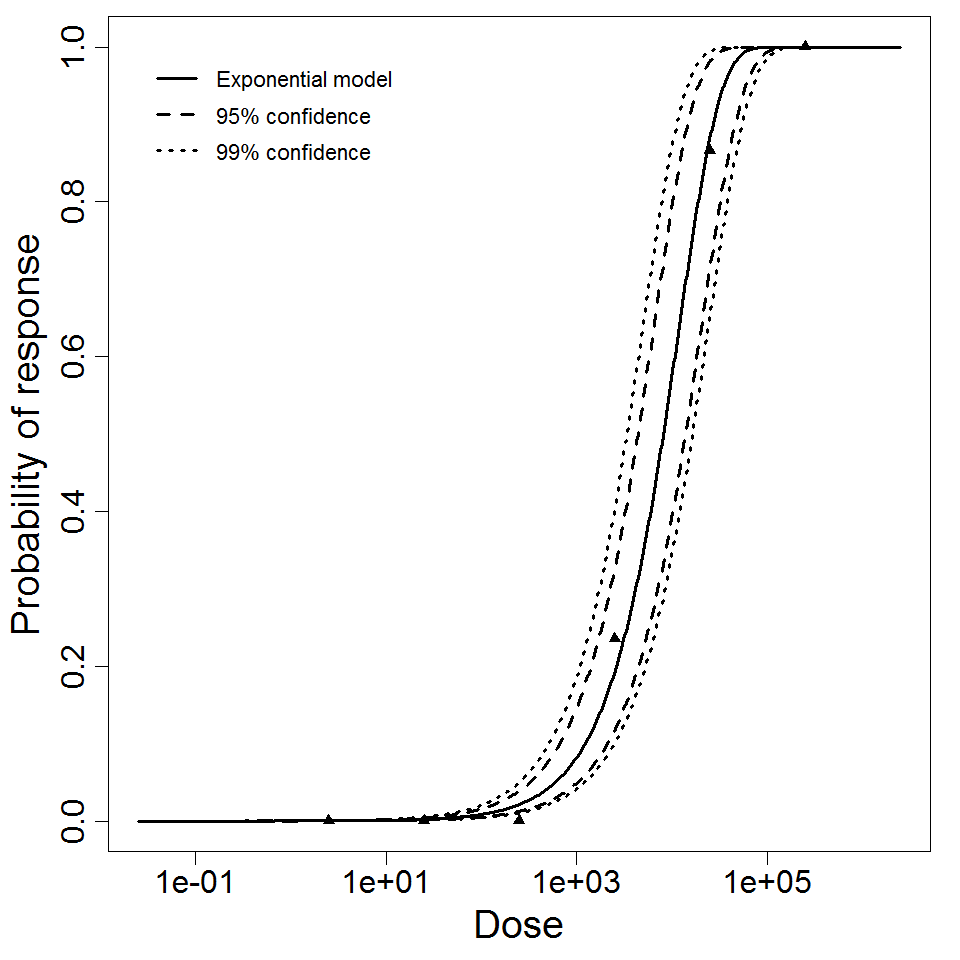
Exponential model plot, with confidence bounds around optimized model
|
|
||||||||||||||||||||||
|
||||||||||||||||||||||||||||||||||||||
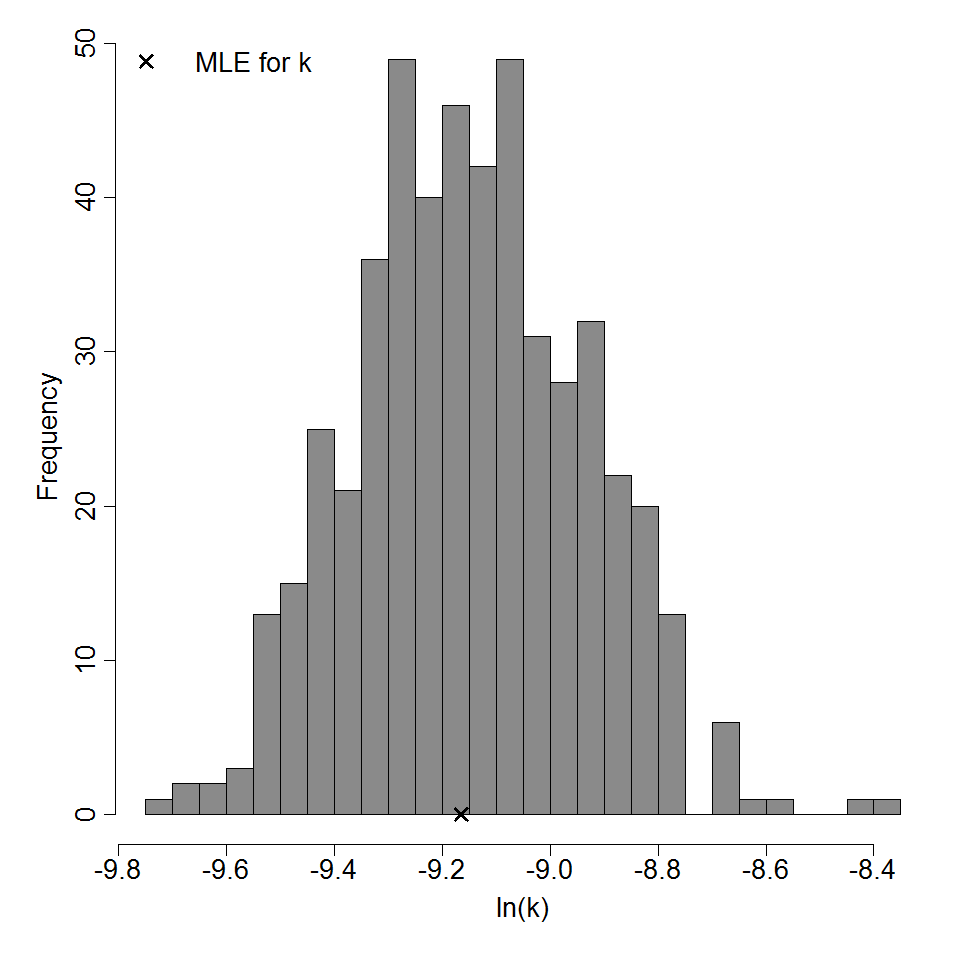
Parameter histogram for exponential model (uncertainty of the parameter)
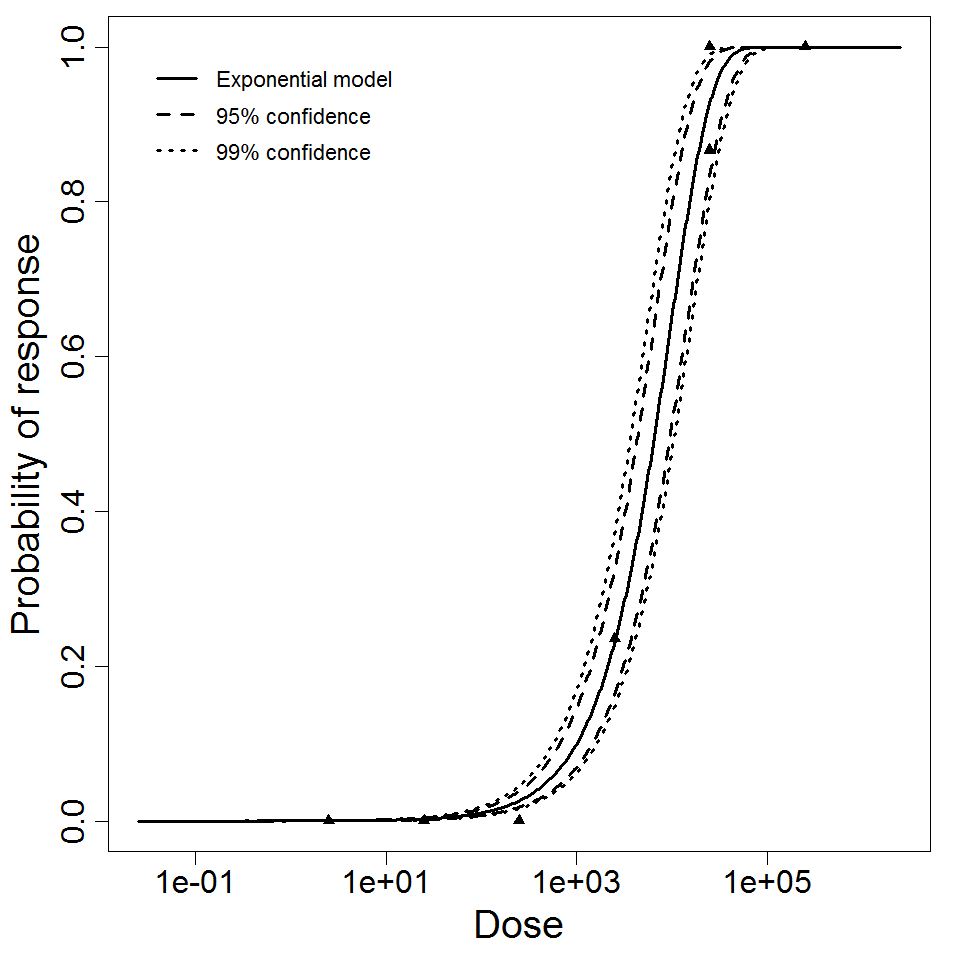
Exponential model plot, with confidence bounds around optimized model
|
|
||||||||||||||||||||||
|
||||||||||||||||||||||||||||||||||||||
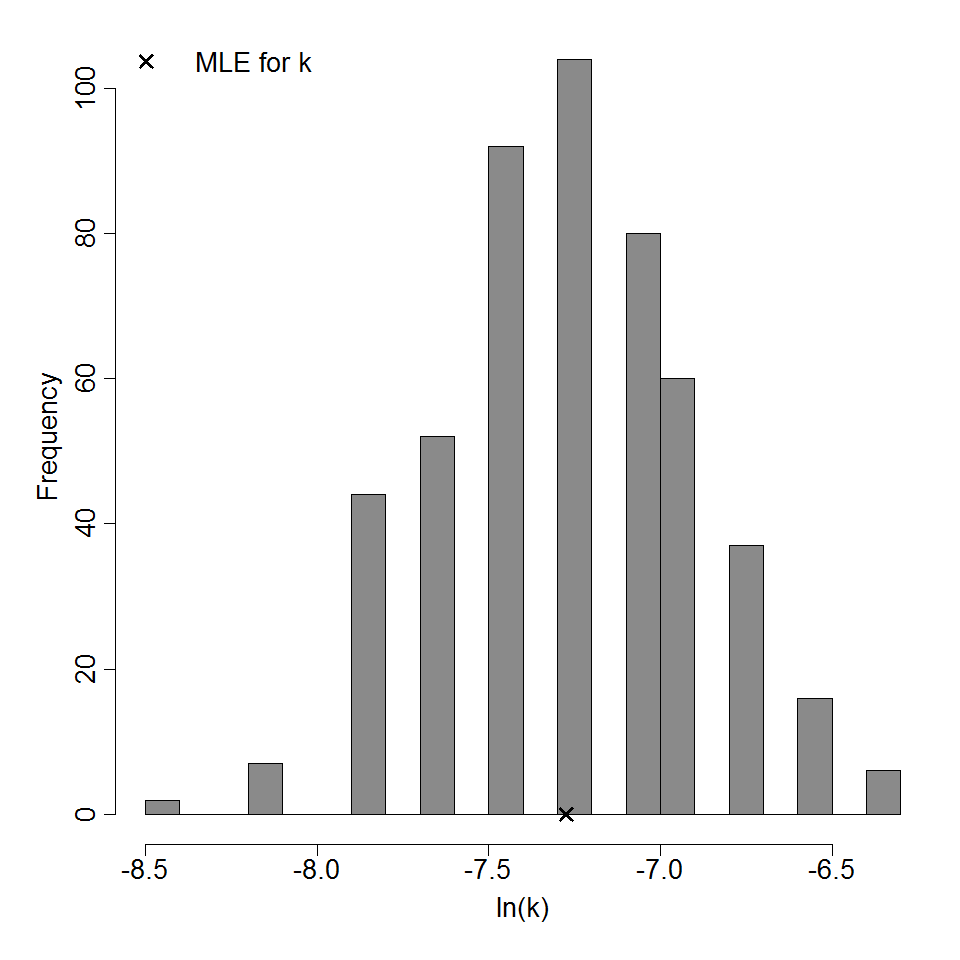
Parameter histogram for exponential model (uncertainty of the parameter)
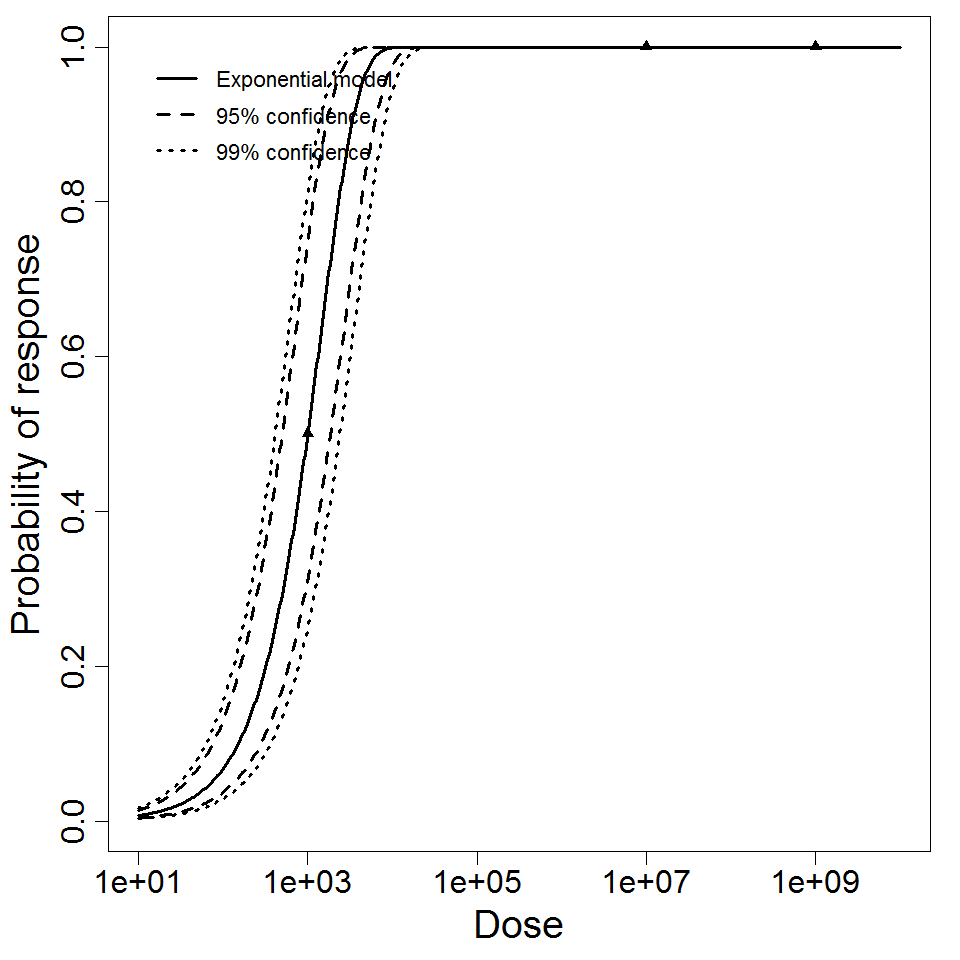
Exponential model plot, with confidence bounds around optimized model
|
|
||||||||||||||||||||||
|
||||||||||||||||||||||||||||||
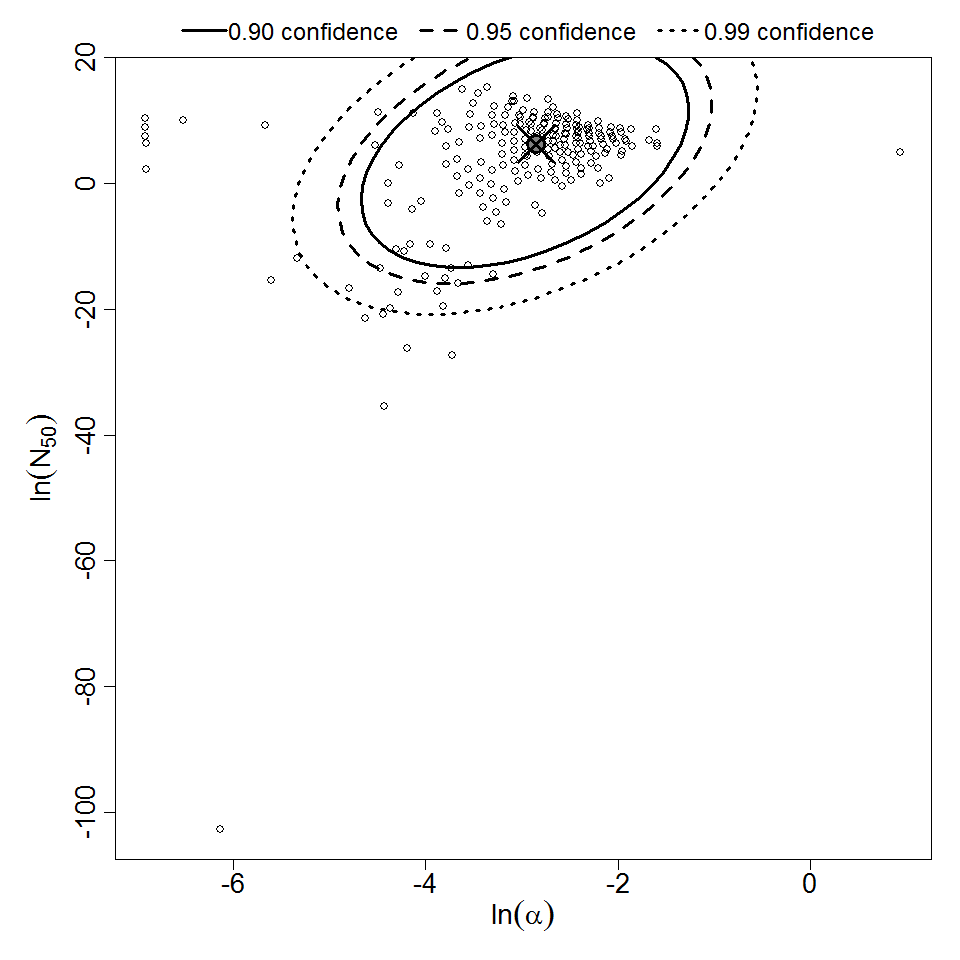
Parameter scatter plot for beta Poisson model ellipses signify the 0.9, 0.95 and 0.99 confidence of the parameters.

beta Poisson model plot, with confidence bounds around optimized model
|
||||||||||||||||||||||
|
||||||||||||||||||||||||||||||
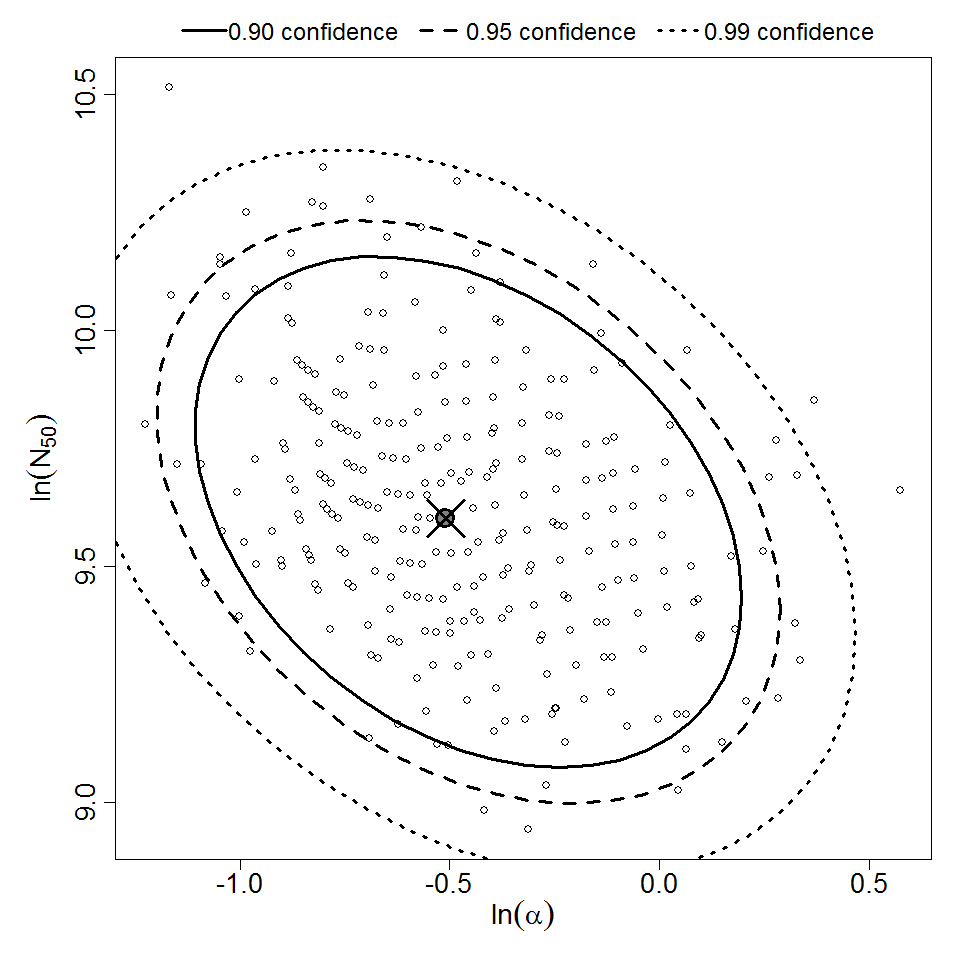
Parameter scatter plot for beta Poisson model ellipses signify the 0.9, 0.95 and 0.99 confidence of the parameters.
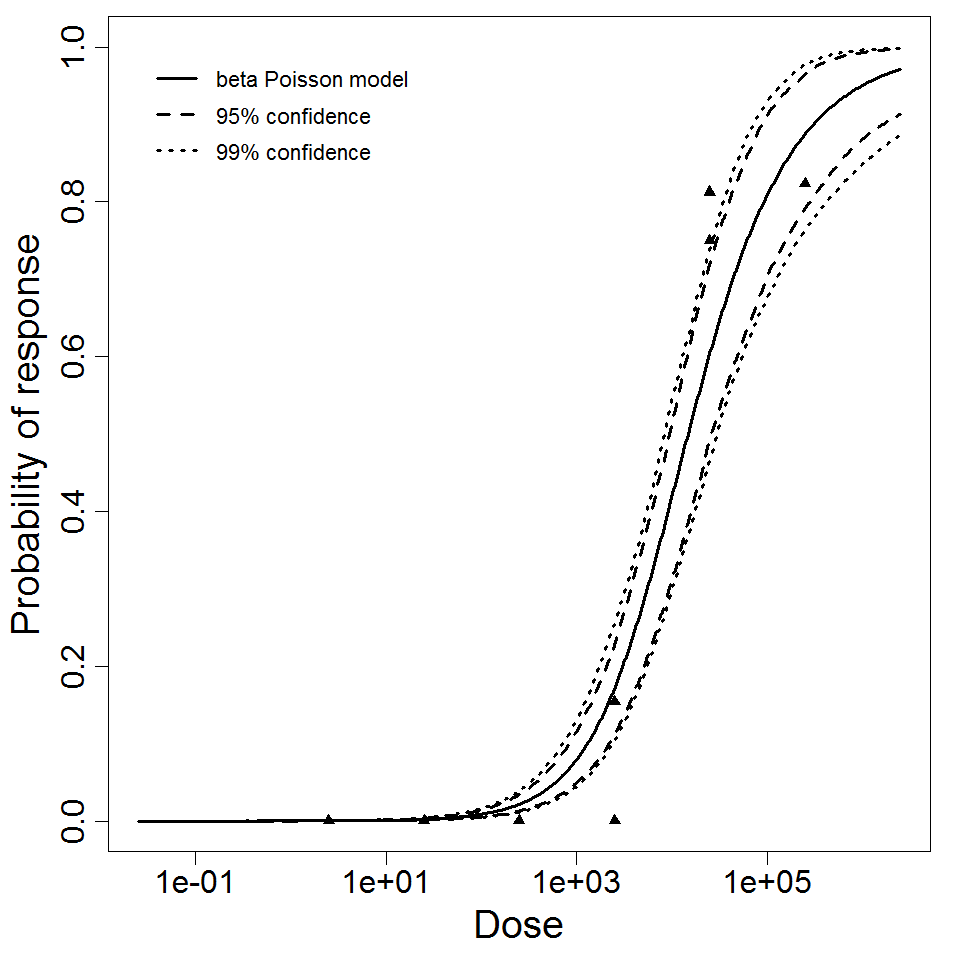
beta Poisson model plot, with confidence bounds around optimized model
|
|
||||||||||||||||||||||
|
||||||||||||||||||||||||||||||
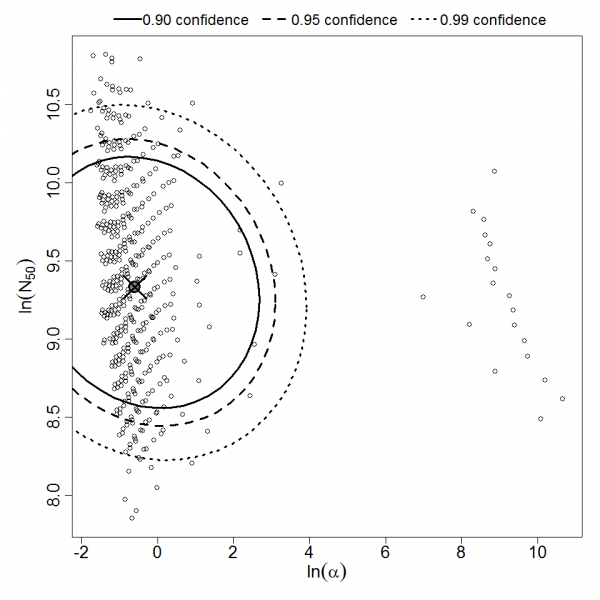
Parameter scatter plot for beta Poisson model ellipses signify the 0.9, 0.95 and 0.99 confidence of the parameters.
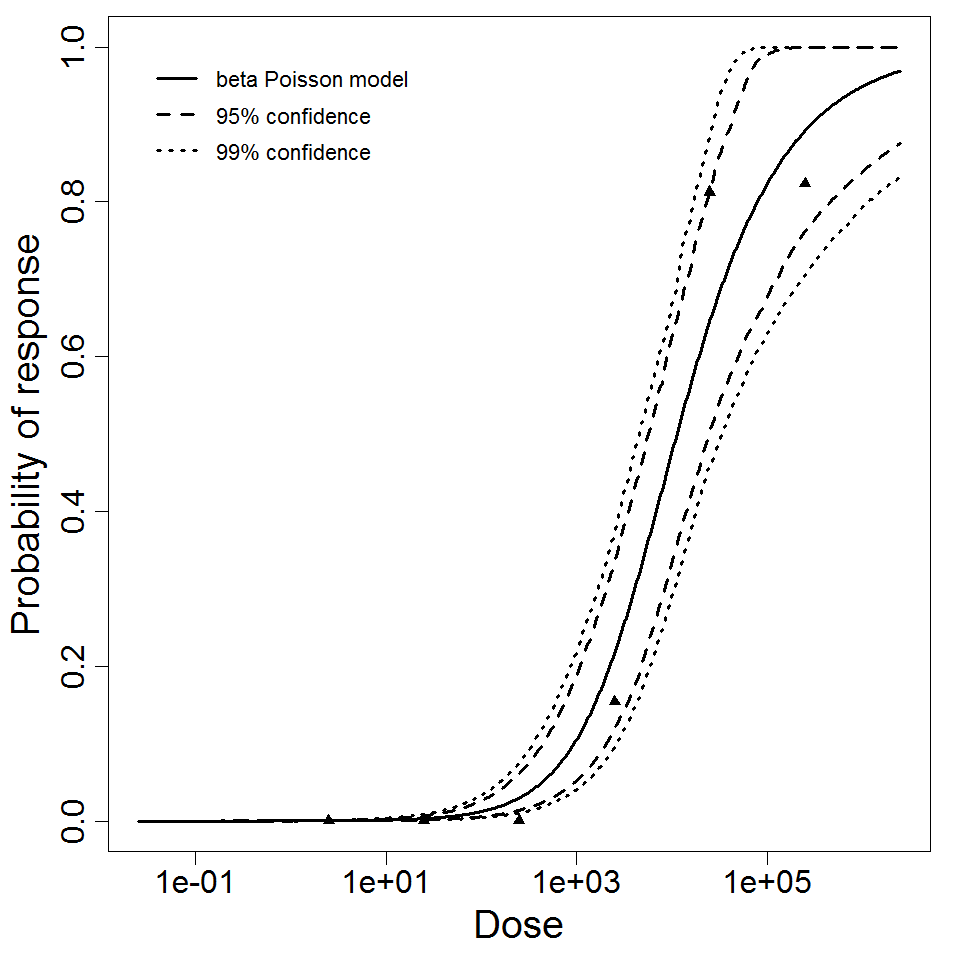
beta Poisson model plot, with confidence bounds around optimized model