Description
| ||||||||||||||||||||||
| ||||||||||||||||||||||||||||||

# of Doses
4.00
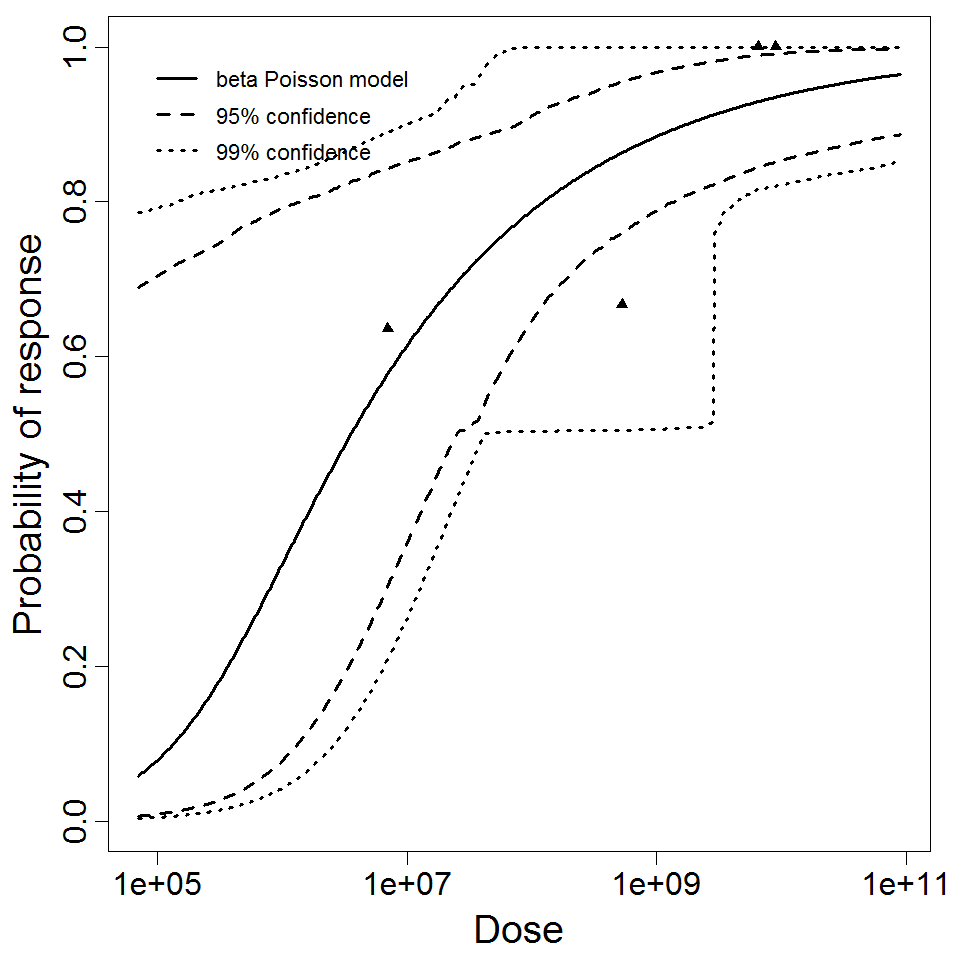
Μodel
N50
3.56E+06
LD50/ID50
3.56E+06
Dose Units
Response
Exposure Route
Contains Preferred Model
a
2.63E-01
Agent Strain
ETEC O111 (in paper as "E. coli 111, B4")
Experiment ID
43
Host type
Experiment Dataset
Description
|
| ||||||||||||||||||||||
| ||||||||||||||||||||||||||||||
# of Doses
4.00
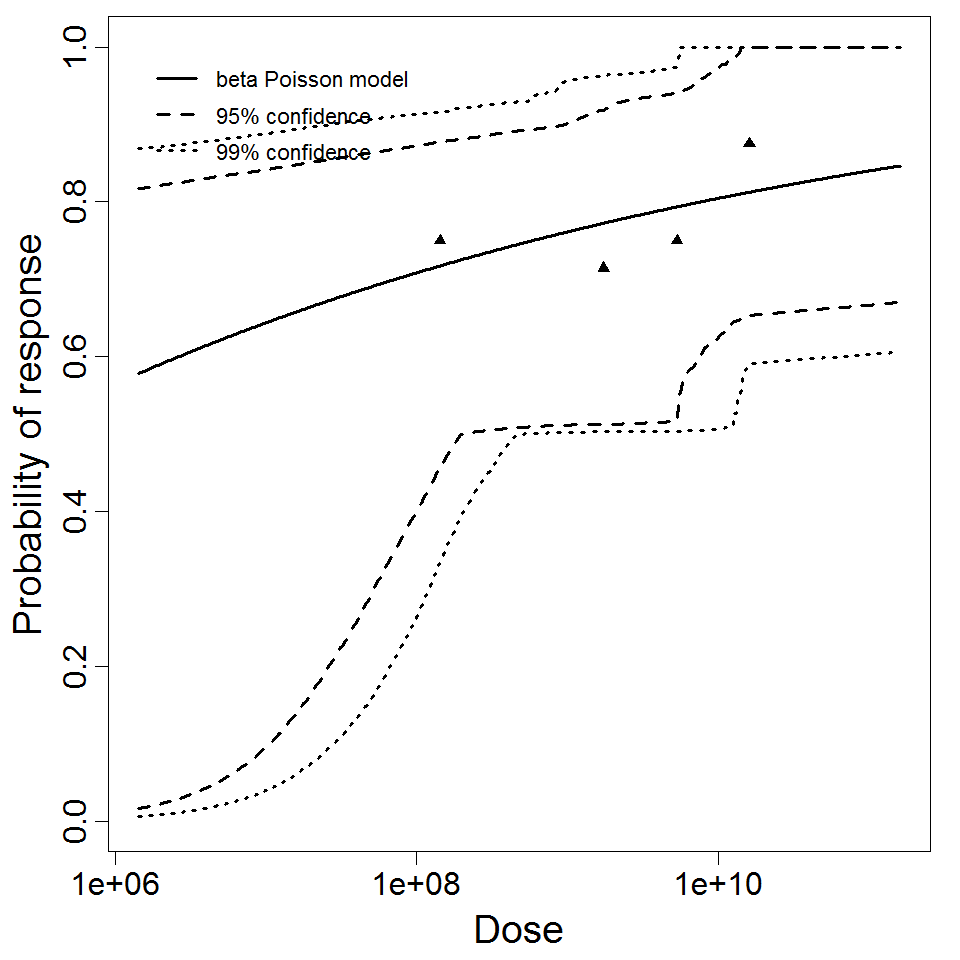
Μodel
N50
2.05E+05
LD50/ID50
2.05E+05
Dose Units
Response
Exposure Route
Contains Preferred Model
a
8.7E-02
Agent Strain
ETEC O55 (in paper as “type 55, B5”)
Experiment ID
42
Host type
Experiment Dataset