

Listeria monocytogenes (Death as response): Dose Response Models
General Overview
Listeria monocytogenes is a Gram-positive rod-shaped bacterium. It is the causative agent of listeriosis, a serious infection caused by eating food contaminated with the bacteria. The disease generally affects older adults, pregnant women, newborns, and adults with weakened immune systems.
| ID | Exposure Route | # of Doses | Agent Strain | Dose Units | Host type | Μodel | LD50/ID50 | Optimized parameters | Response type | Reference |
|---|---|---|---|---|---|---|---|---|---|---|
| 292 | oral | 6.00 | F5817 | CFU | beta-Poisson | a = 0.253 N50 = 277 | infection |
| Model | Deviance | Δ | Degrees of freedom |
χ20.95,1 p-value |
χ20.95,m-k p-value |
| Exponential | 9.88 | 6.48 | 5 | 3.84 0.011 |
11.1 0.0788 |
| beta Poisson | 3.4 | 4 | 9.49 0.494 |
||
| beta-Poisson fits better than exponential; can not reject good fit for beta-Poisson | |||||
| Parameter | MLE Estimate | 0.5% | 2.5% | 5% | 95% | 97.5% | 99.5% |
| α | 6.95E-01 | 2.69E-01 | 3.39E-01 | 3.78E-01 | 2.56E+0 | 2.28E+01 | 1.18E+03 |
| N50 | 3.39E+03 | 3.58E+01 | 2.47E+02 | 4.67E+02 | 1.09E+04 | 1.26E+04 | 1.85E+04 |
Giardia duodenalis: Dose Response Experiments
| ID | Exposure Route | # of Doses | Agent Strain | Dose Units | Host type | Μodel | LD50/ID50 | Optimized parameters | Response type | Reference |
|---|---|---|---|---|---|---|---|---|---|---|
| 46 | oral | 8.00 | From an infected human | Cysts | human | exponential | 3.48E+01 | k = 1.99E-02 | infection |
Rendtorff, R. C. (1954). The experimental transmission of human intestinal protozoan parasites. II. Giardia lamblia cysts given in capsules. American Journal of Hygiene, 59, 2. Retrieved from https://academic.oup.com/aje/article-abstract/59/2/196/89318?redirectedFrom=PDF |
| 47 | oral | 4.00 | From infected humans | Cysts | beaver | beta-Poisson | 1.46E+04 | a = 1.37E-01 N50 = 1.46E+04 | infection |
Erlandsen, S. L., Sherlock, L. A., Januschka, M. ., Schupp, D. G., Schaefer, F. W., Jakubowski, W. ., & Bemrick, W. J. (1988). Cross-species transmission of Giardia spp.: inoculation of beavers and muskrats with cysts of human, beaver, mouse, and muskrat origin. Applied and Environmental Microbiology, 54, 11. Retrieved from http://aem.asm.org/content/54/11/2777.abstract |
|
|
||||||||||||||||||||||
|
||||||||||||||||||||||||||||||||||||||
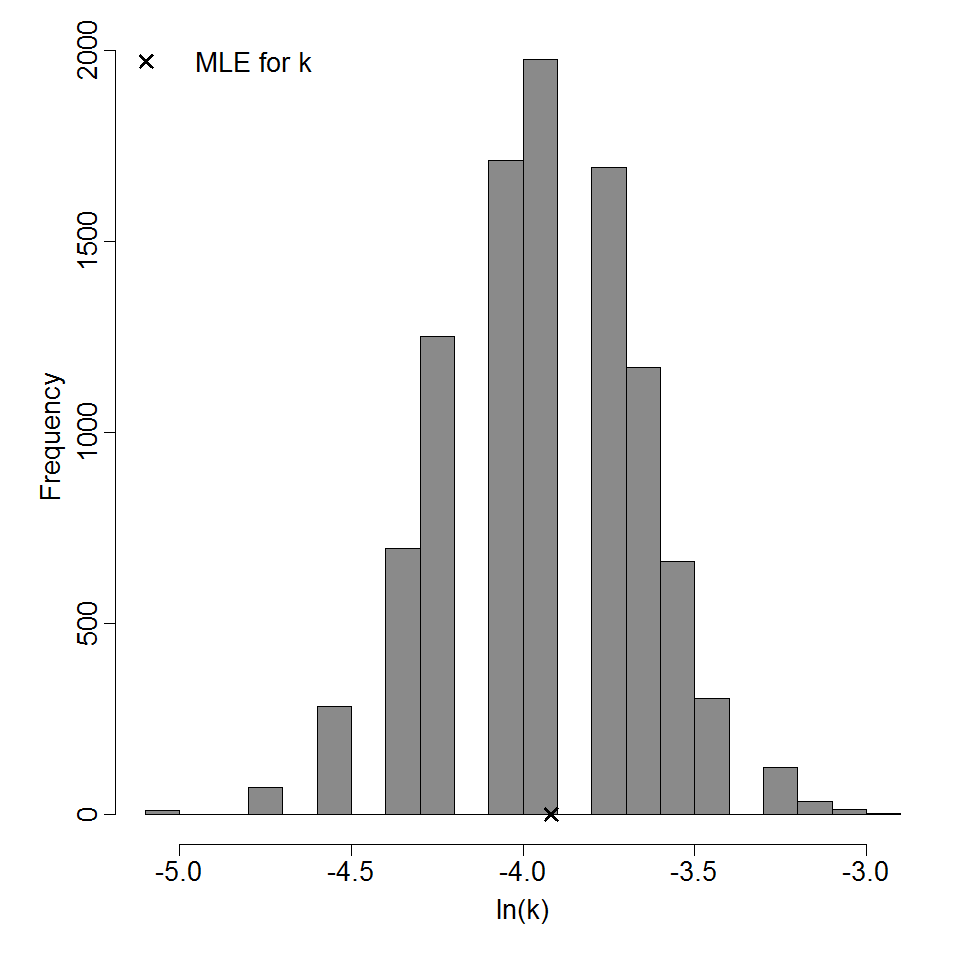
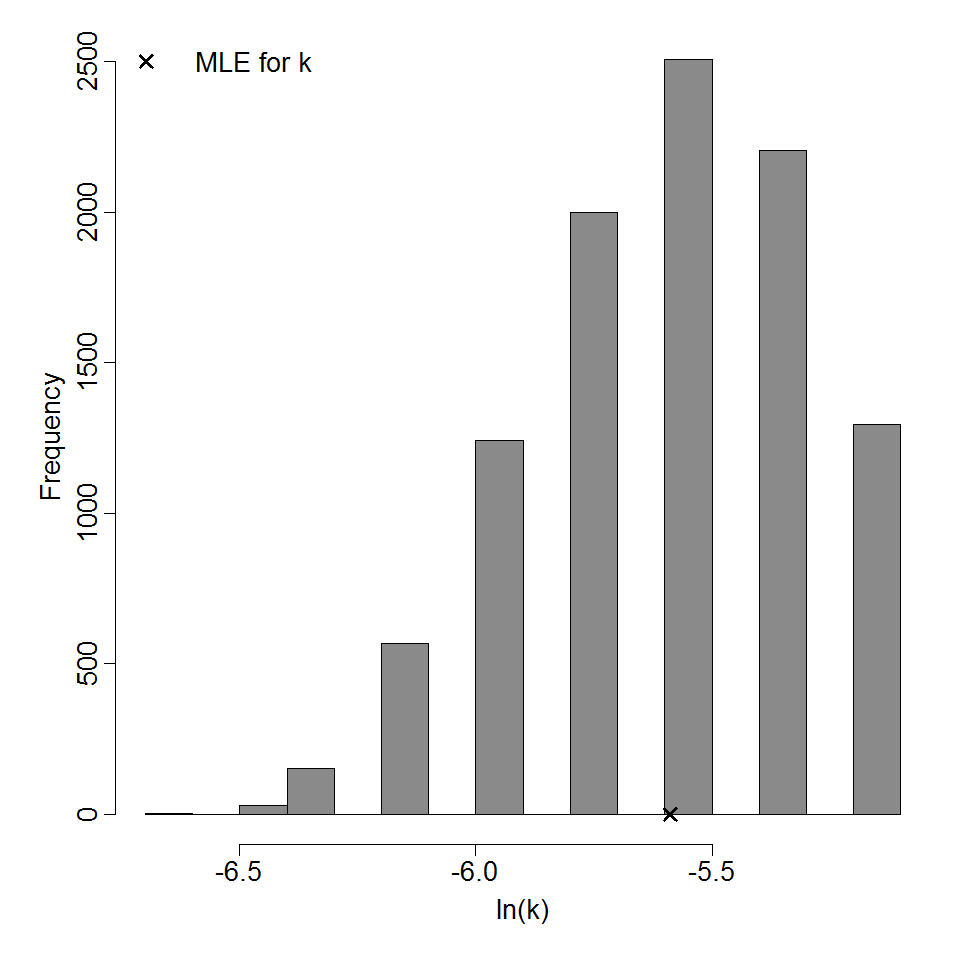
Parameter histogram for exponential model (uncertainty of the parameter)

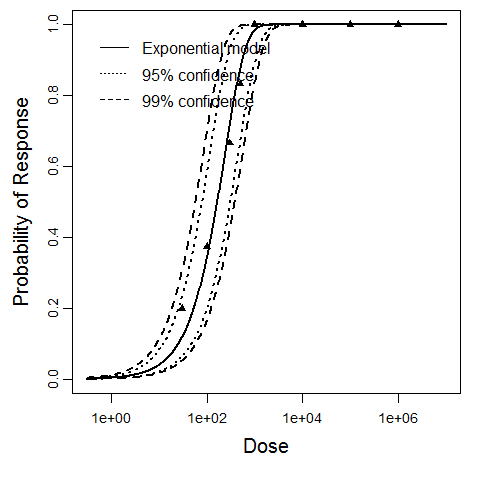
Exponential model plot, with confidence bounds around optimized model
|
|
||||||||||||||||||||||
|
||||||||||||||||||||||||||||||

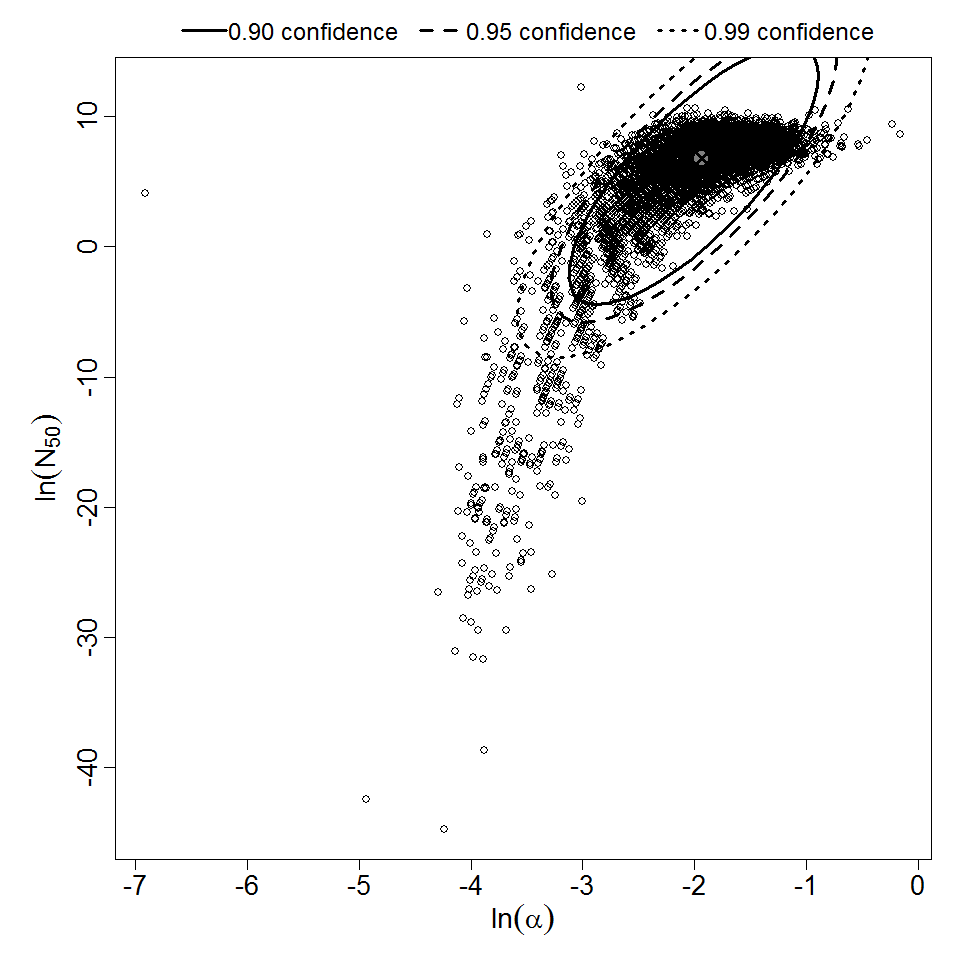
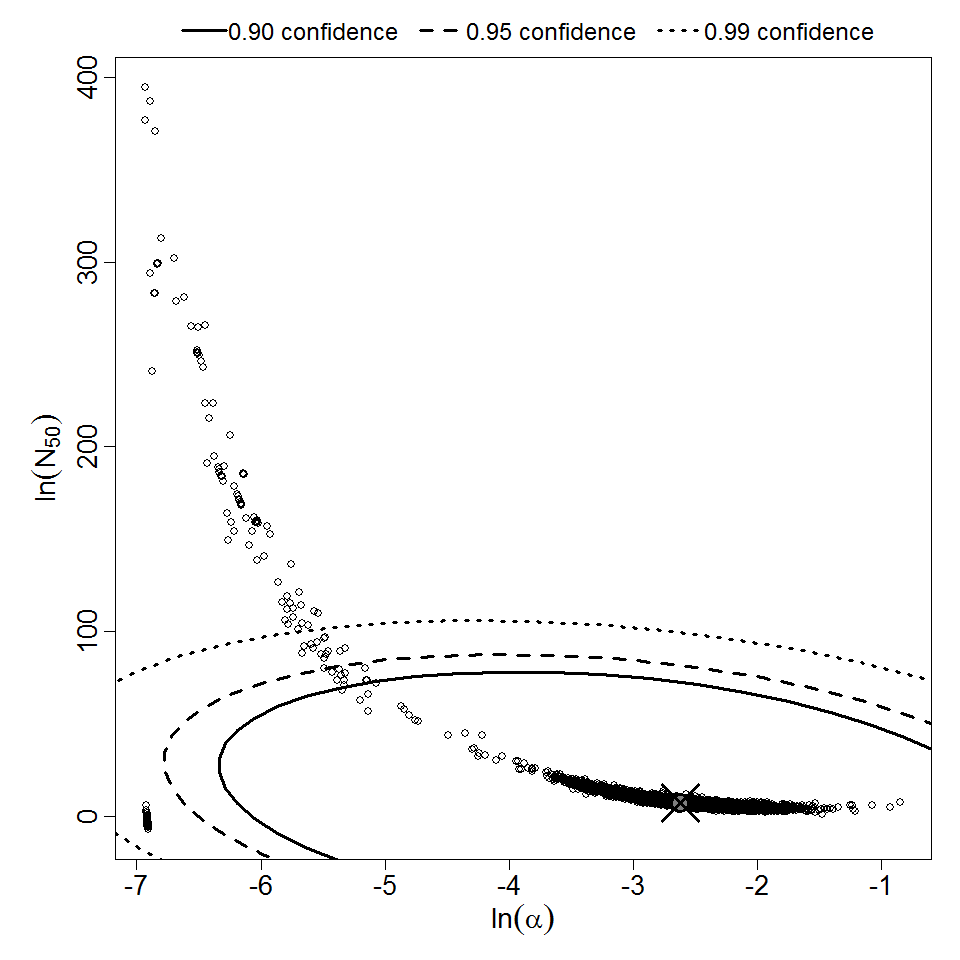
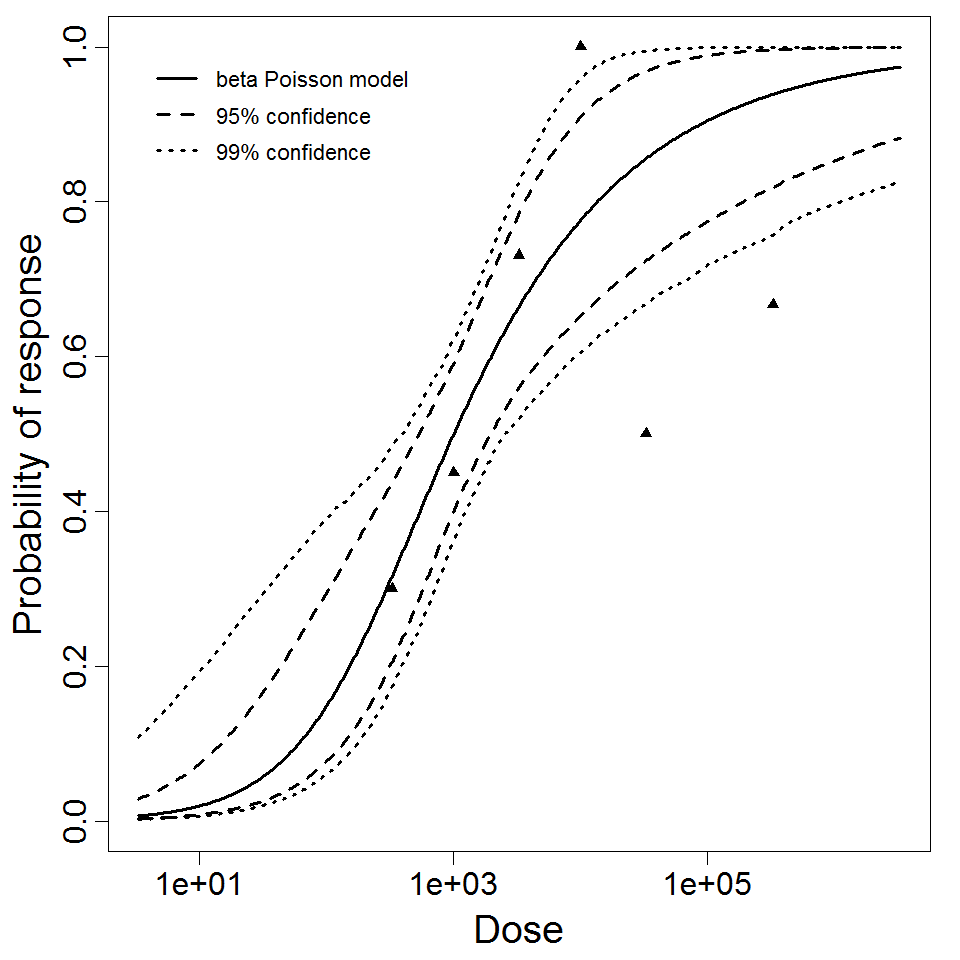
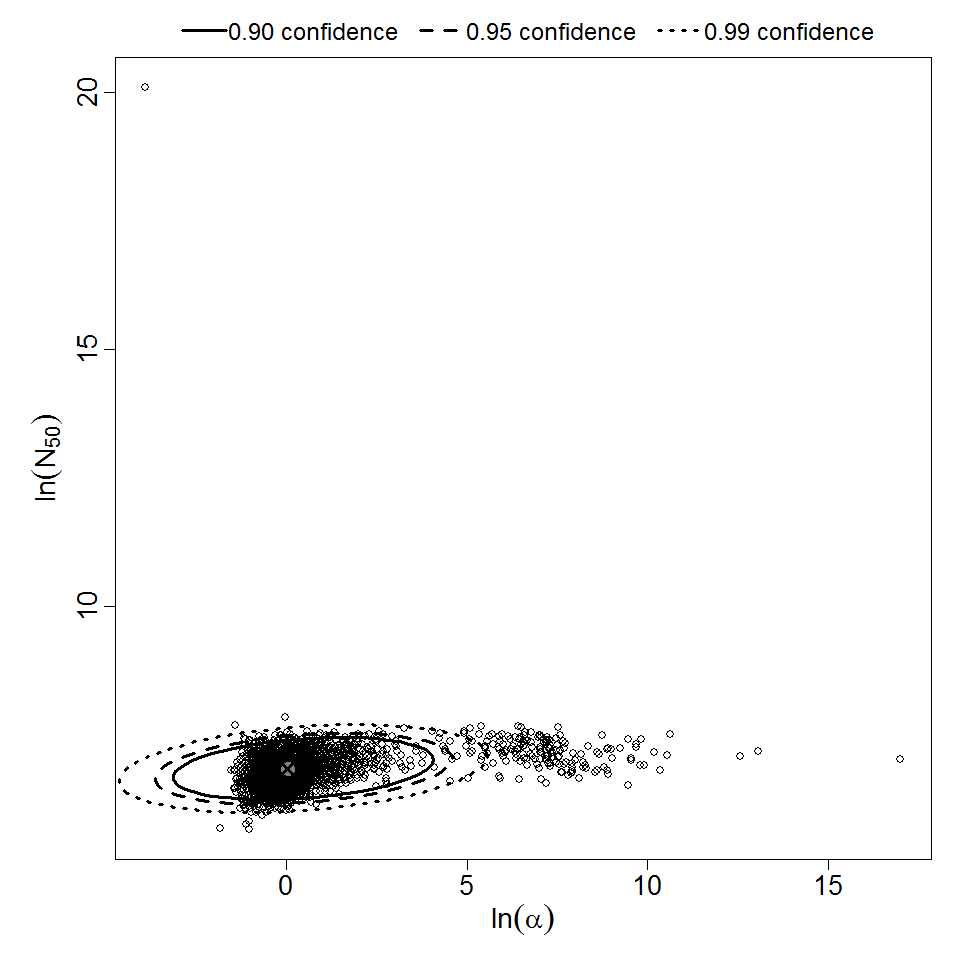
Parameter scatter plot for beta Poisson model ellipses signify the 0.9, 0.95 and 0.99 confidence of the parameters.

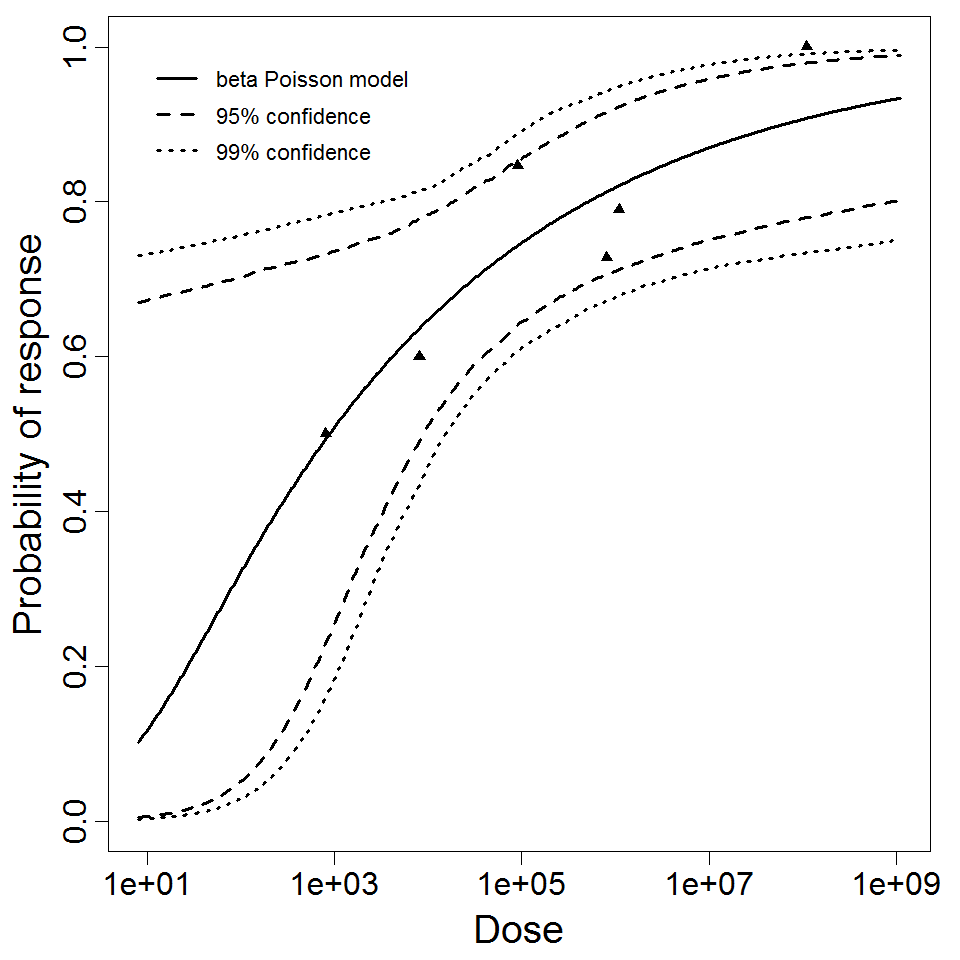
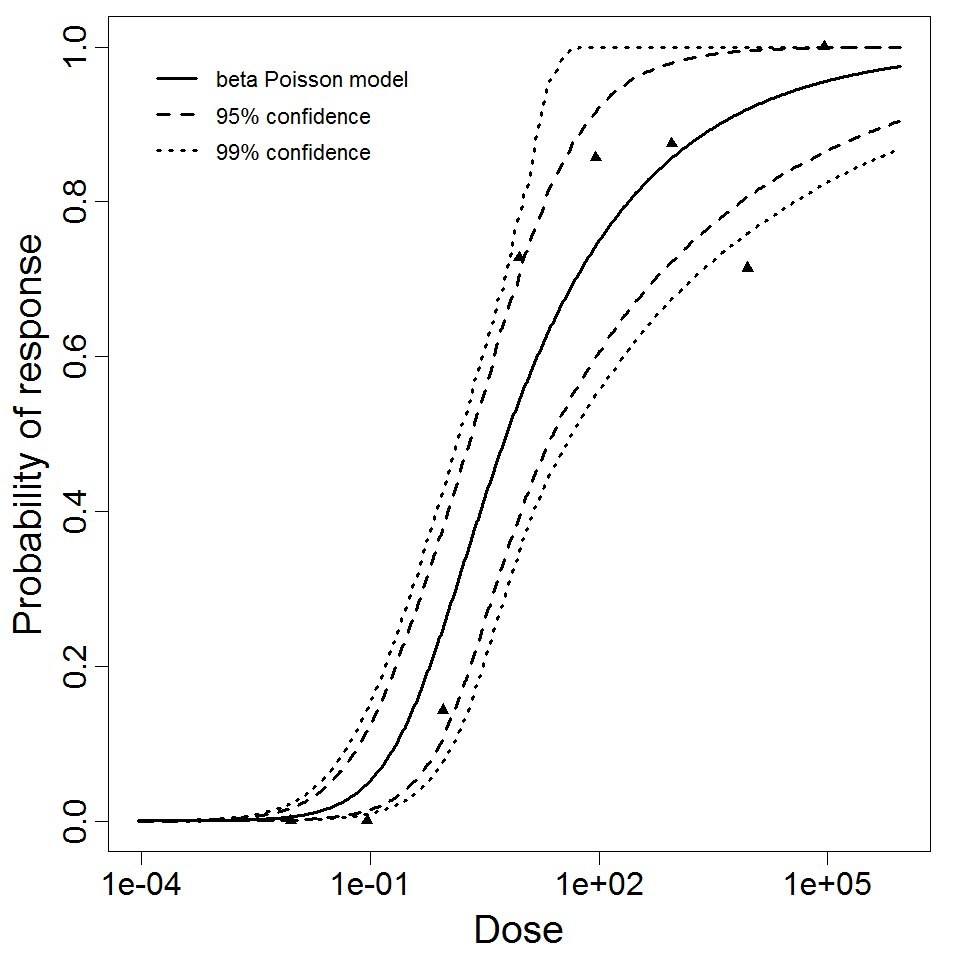
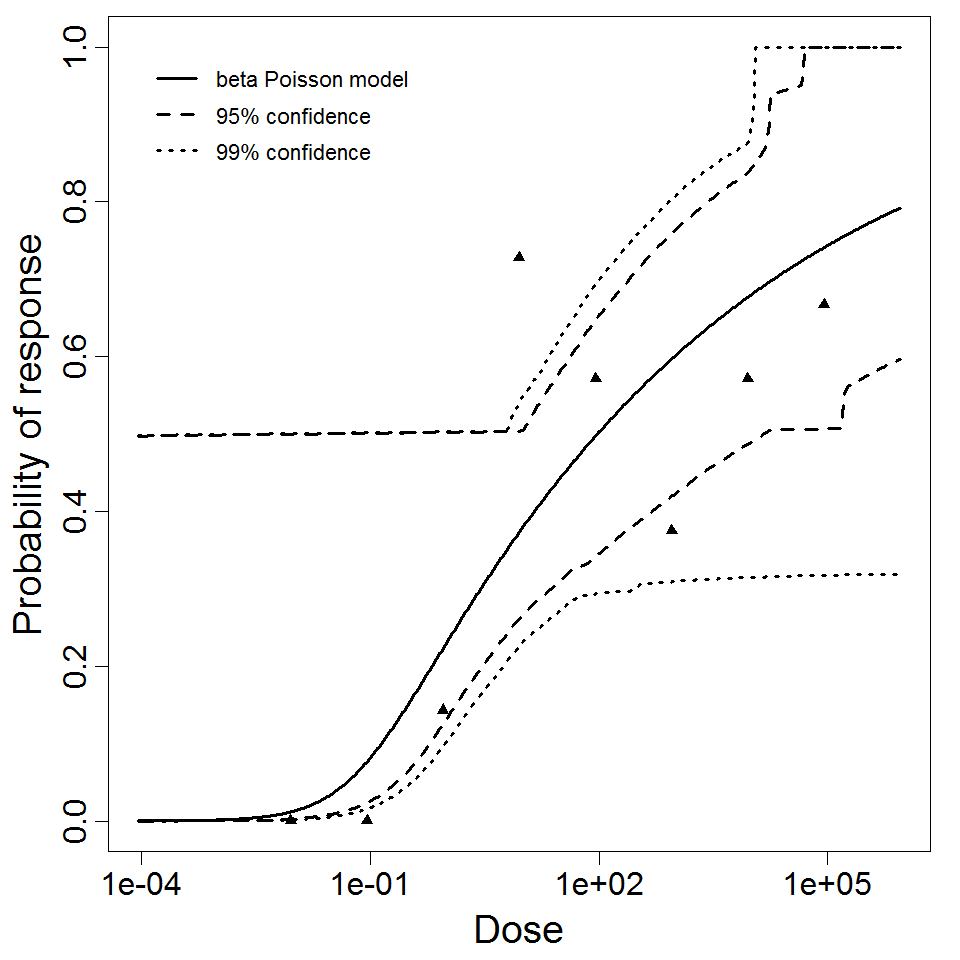
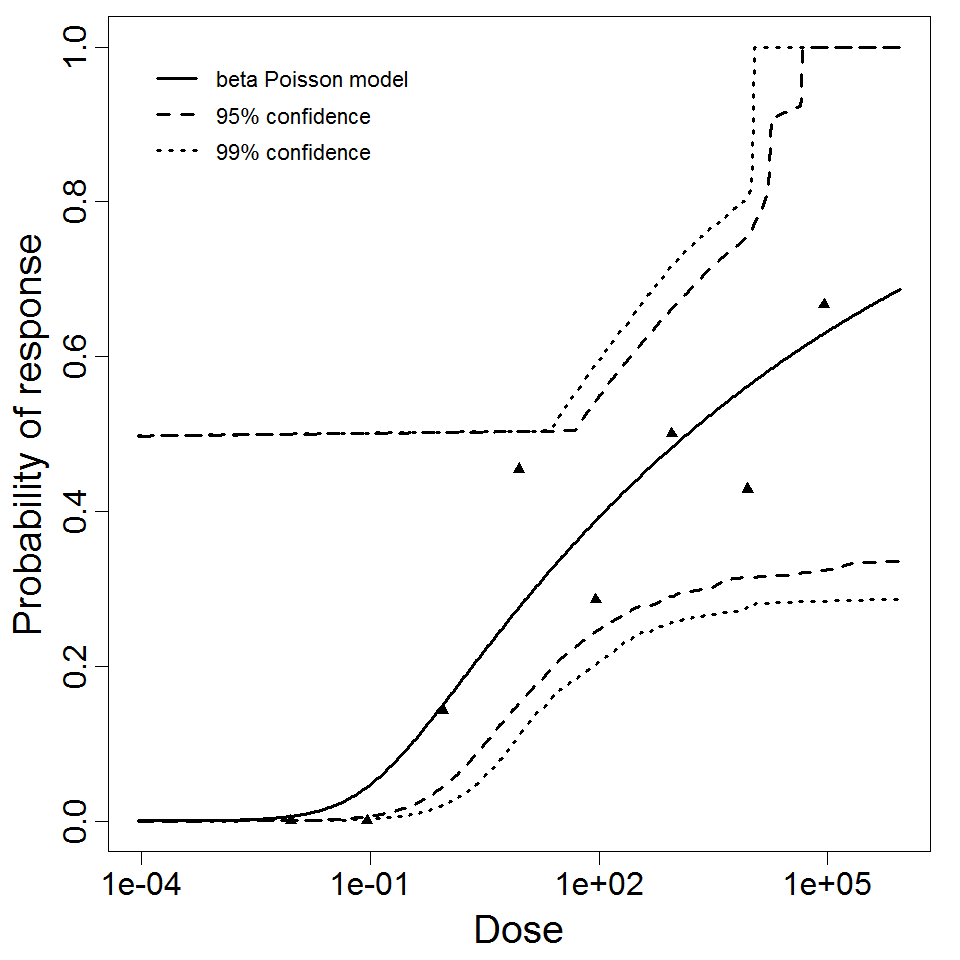
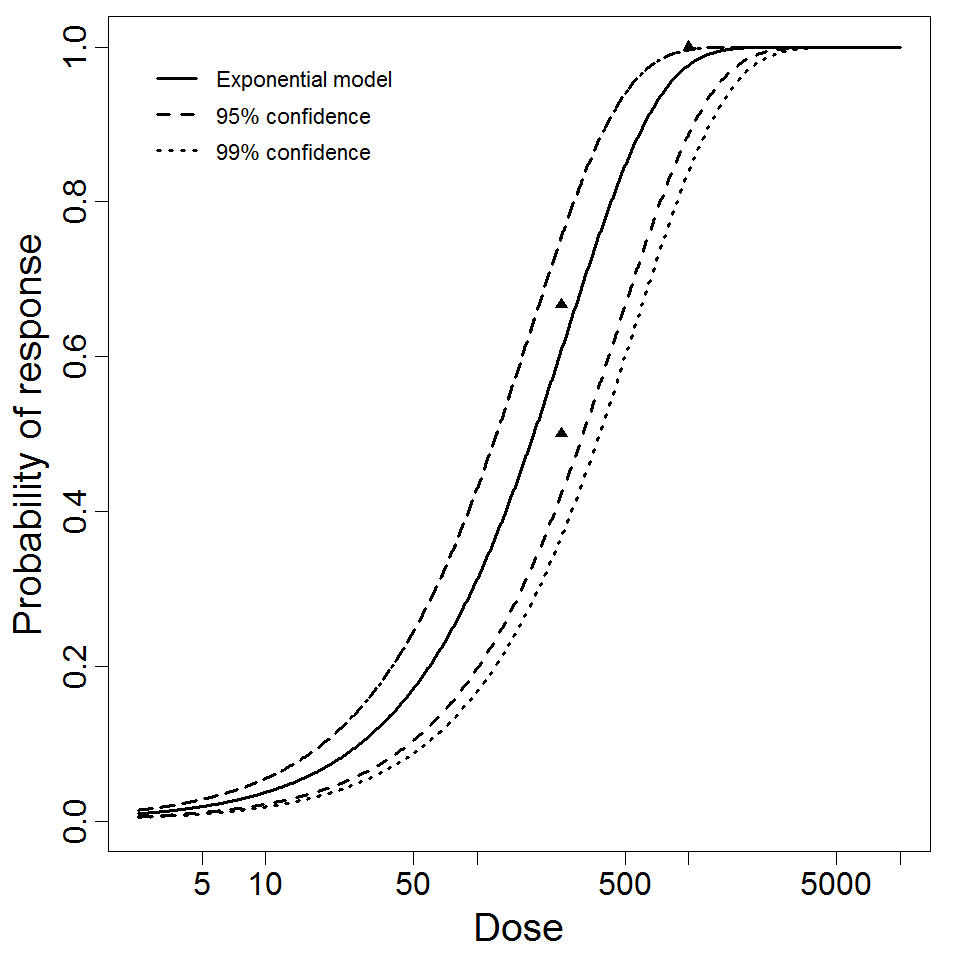
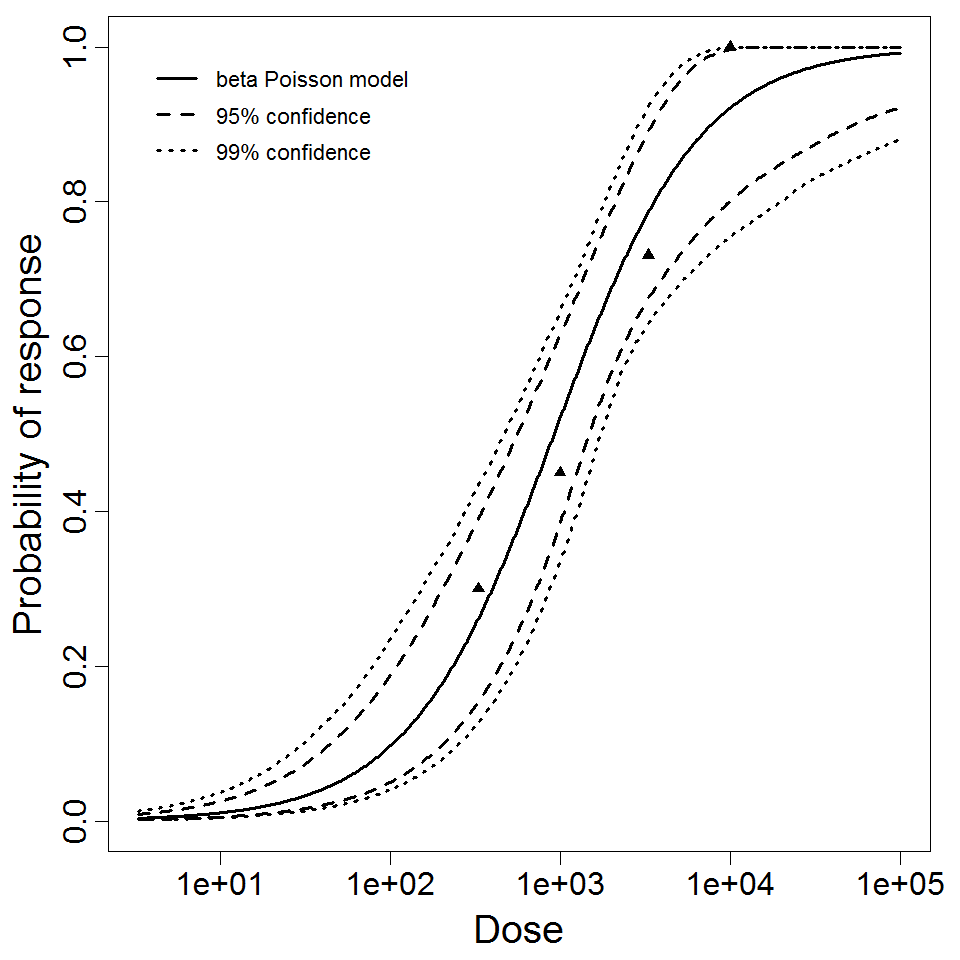
beta Poisson model plot, with confidence bounds around optimized model
Enterovirus: Dose Response Experiments
| ID | Exposure Route | # of Doses | Agent Strain | Dose Units | Host type | Μodel | LD50/ID50 | Optimized parameters | Response type | Reference |
|---|---|---|---|---|---|---|---|---|---|---|
| 62 | oral | 3.00 | porcine, PE3-ECPO-6 | PFU | pig | exponential | 2.34E+03 | k = 2.96E-04 | infection |
Cliver, D. O. (1981). Experimental infection by waterborne enteroviruses. Journal of Food Protection, 44, 861–865. Retrieved from http://www.jfoodprotection.org/doi/abs/10.4315/0362-028X-44.11.861?code=fopr-site |
| 63 | oral | 3.00 | porcine, PE7-05i | PFU | pig | exponential | 1.85E+02 | k = 3.74E-03 | infection |
Cliver, D. O. (1981). Experimental infection by waterborne enteroviruses. Journal of Food Protection, 44, 861–865. Retrieved from http://www.jfoodprotection.org/doi/abs/10.4315/0362-028X-44.11.861?code=fopr-site |
|
|
||||||||||||||||||||||
|
||||||||||||||||||||||||||||||||||||||
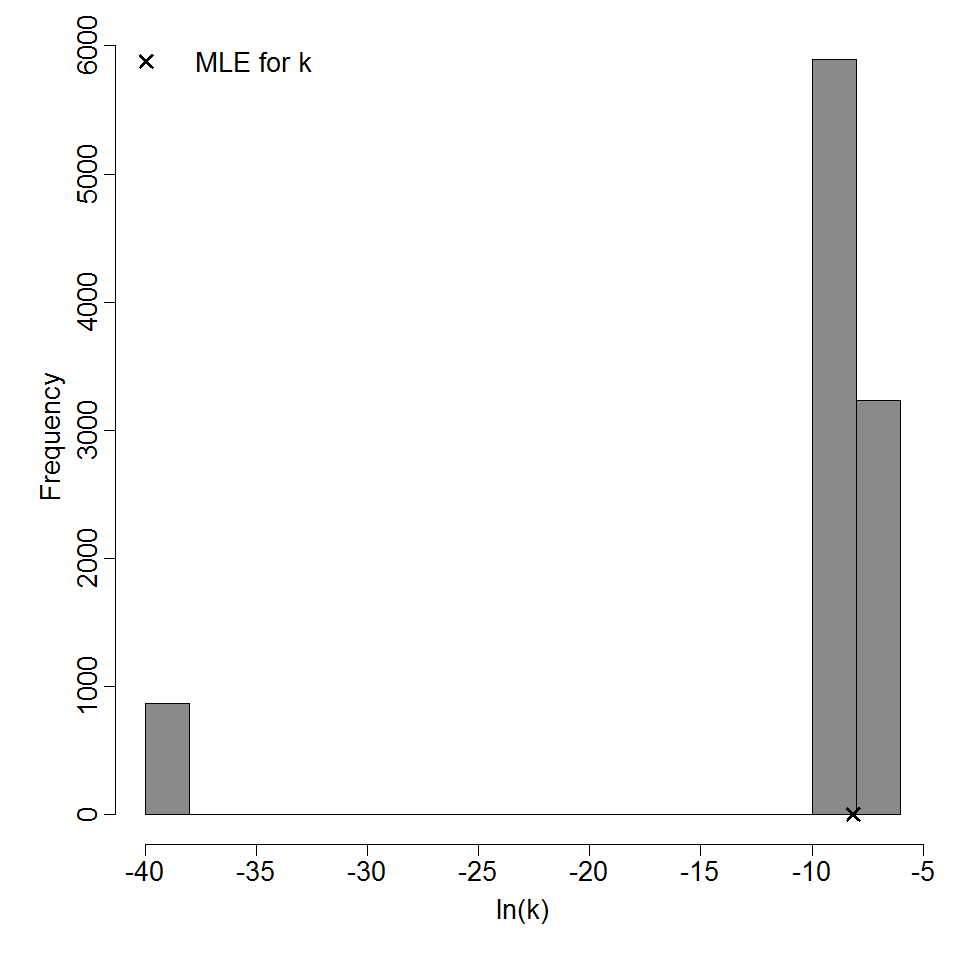
Parameter histogram for exponential model (uncertainty of the parameter)
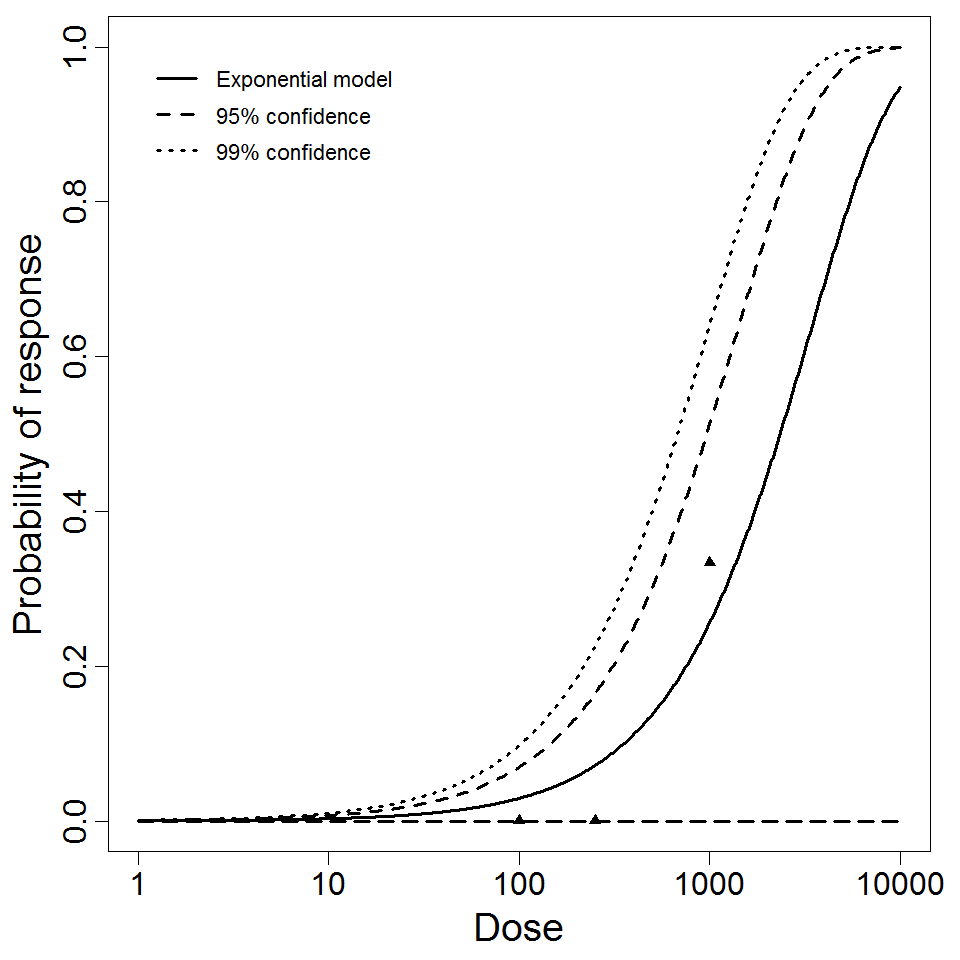
Exponential model plot, with confidence bounds around optimized model
|
|
||||||||||||||||||||||
|
||||||||||||||||||||||||||||||||||||||
Parameter histogram for exponential model (uncertainty of the parameter)
Exponential model plot, with confidence bounds around optimized model
Echovirus: Dose Response Experiments
General Overview
Echoviruses, a member of the enterovirus genus, is a type of RNA virus that were shown to be a frequent cause of simple febrile illnesses and aseptic meningitis. Most infected persons experience no symptoms or have self-limited disease.
| ID | Exposure Route | # of Doses | Agent Strain | Dose Units | Host type | Μodel | LD50/ID50 | Optimized parameters | Response type | Reference |
|---|---|---|---|---|---|---|---|---|---|---|
| 112 | oral | 6.00 | strain 12 | PFU | human | beta-Poisson | 1.01E+03 | a = 3.74E-01 N50 = 1.01E+03 | infection |
Suptel, E. A. (1963). Pathogenesis of experimental Coxsackie virus infection. Archive of Virology, 7, 61-66. |
| 256 (excluding the outliers of exp 112) | oral | 4.00 | strain 12 | PFU | human | beta-Poisson | 9.22E+02 | a = 1.06E+00 N50 = 9.22E+02 | infection |
Schiff, G. M., Stefanović, G. M., Young, E. C., Sander, D. S., Pennekamp, J. K., & Ward, R. L. (1984). Studies of echovirus-12 in volunteers: determination of minimal infectious dose and the effect of previous infection on infectious dose. The Journal of Infectious Diseases, 150, 6. Retrieved from https://academic.oup.com/jid/article-abstract/150/6/858/880281 |
|
|
||||||||||||||||||||||
|
||||||||||||||||||||||||||||||
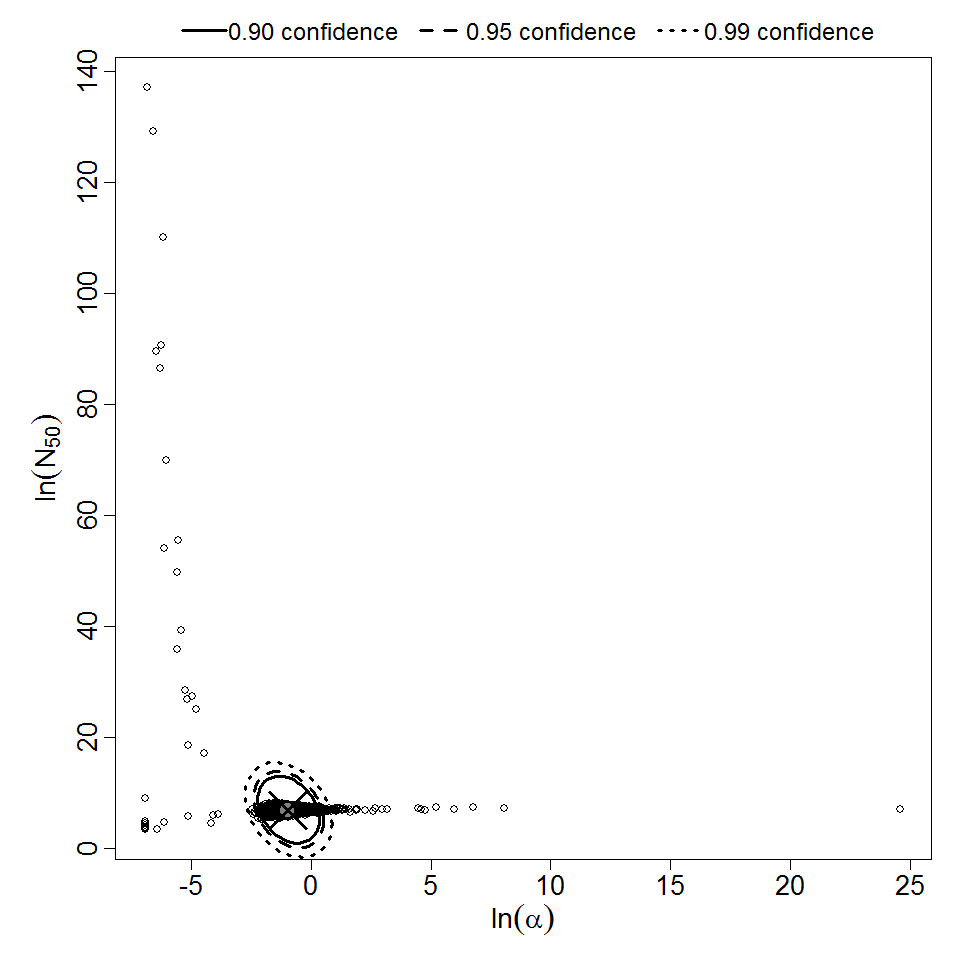
Parameter scatter plot for beta Poisson model ellipses signify the 0.9, 0.95 and 0.99 confidence of the parameters.
beta Poisson model plot, with confidence bounds around optimized model
|
|
||||||||||||||||||||||
|
||||||||||||||||||||||||||||||
Parameter scatter plot for beta Poisson model ellipses signify the 0.9, 0.95 and 0.99 confidence of the parameters.
beta Poisson model plot, with confidence bounds around optimized model
Cryptosporidium parvum: Dose Response Experiments
| ID | Exposure Route | # of Doses | Agent Strain | Dose Units | Host type | Μodel | LD50/ID50 | Optimized parameters | Response type | Reference |
|---|---|---|---|---|---|---|---|---|---|---|
| 108 | oral | 8.00 | Iowa strain | oocysts | human | exponential | 1.65E+02 | k = 4.19E-03 | infection |
DuPont, H. L., Chappell, C. L., Sterling, C. R., Okhuysen, P. C., Rose, J. B., & Jakubowski, W. . (1995). The infectivity of Cryptosporidium parvum in healthy volunteers. The New England Journal of Medicine, 332, 13. Retrieved from https://www.nejm.org/doi/full/10.1056/NEJM199503303321304 |
| 139 | oral | 8.00 | Iowa isolate | oocysts | human | exponential | 1.32E+02 | k = 5.26E-03 | infection |
Messner, M. J., Chappell, C. L., & Okhuysen, P. C. (2001). Risk Assessment for Cryptosporidium: A Hierarchical Bayesian Analysis of Human Dose Response Data. Water Research, 35, 16. Retrieved from https://www.sciencedirect.com/science/article/pii/S0043135401001191 |
| 140 | oral | 4.00 | TAMU isolate | oocysts | human | exponential | 1.21E+01 | k = 5.72E-02 | infection |
Messner, M. J., Chappell, C. L., & Okhuysen, P. C. (2001). Risk Assessment for Cryptosporidium: A Hierarchical Bayesian Analysis of Human Dose Response Data. Water Research, 35, 16. Retrieved from https://www.sciencedirect.com/science/article/pii/S0043135401001191 |
| 141 | oral | 4.00 | UCP isolate | oocysts | human | beta-Poisson | 1.79E+02 | a = 1.45E-01 N50 = 1.79E+02 | infection |
Coster, T. S., Wolf, M. K., Hall, E. R., Cassels, F. J., Taylor, D. N., Liu, C. T., … McQueen, C. E. (2007). Immune response, ciprofloxacin activity, and gender differences after human experimental challenge by two strains of enterotoxigenic Escherichia coli. Infection and Immunity, 75, 1. |
| 181 | oral | 4.00 | *C. hominis*, TU502 | oocysts | human | beta-Poisson | 1.68E+01 | a = 2.7E-01 N50 = 1.68E+01 | diarrhea |
Okhuysen, P. C., Rich, S. M., Chappell, C. L., Grimes, K. A., Widmer, G. ., Feng, X. ., & Tzipori, S. . (2002). Infectivity of a Cryptosporidium parvum Isolate of Cervine Origin for Healthy Adults and Interferon-γ Knockout Mice. Journal of Infectious Diseases, 185, 9. Retrieved from https://academic.oup.com/jid/article/185/9/1320/937719 |
| 183 | oral | 4.00 | Moredun isolate | oocysts | human | beta-Poisson | 4.55E+02 | a = 1.14E-01 N50 = 4.55E+02 | infection |
Blaser, M. J., Duncan, D. J., Warren, G. H., & W-ll, W. . (1983). Experimental Campylobacter jejuni Infection of Adult Mice. Infection and Immunity, 39, 2. |
|
| ||||||||||||||||||||||
| ||||||||||||||||||||||||||||||||||||||

|
|
||||||||||||||||||||||
|
||||||||||||||||||||||||||||||||||||||

Parameter histogram for exponential model (uncertainty of the parameter)

Exponential model plot, with confidence bounds around optimized model
|
|
||||||||||||||||||||||
|
||||||||||||||||||||||||||||||||||||||

Exponential model plot, with confidence bounds around optimized model

Parameter histogram for exponential model (uncertainty of the parameter)
|
|
||||||||||||||||||||||
|
||||||||||||||||||||||||||||||

Parameter scatter plot for beta Poisson model ellipses signify the 0.9, 0.95 and 0.99 confidence of the parameters.

beta Poisson model plot, with confidence bounds around optimized model
|
|
||||||||||||||||||||||
|
||||||||||||||||||||||||||||||

Parameter scatter plot for beta Poisson model ellipses signify the 0.9, 0.95 and 0.99 confidence of the parameters.

beta Poisson model plot, with confidence bounds around optimized model.
|
|
||||||||||||||||||||||
|
||||||||||||||||||||||||||||||
Parameter scatter plot for beta Poisson model ellipses signify the 0.9, 0.95 and 0.99 confidence of the parameters.
beta Poisson model plot, with confidence bounds around optimized model.