| Experiment ID |
165
|
|---|---|
| Pathogen | |
| Agent Strain |
ETEC 214-4 (ST)
|
| Contains Preferred Model |
No
|
| Reference |
Levine, M. M., Caplan, E. S., Waterman, D. ., Cash, R. A., Hornick, R. B., & Snyder, M. J. (1977). Diarrhea caused by Escherichia coli that produce only heat-stable enterotoxin. Infection and Immunity, 17, 1. |
| Exposure Route |
oral (in milk)
|
| Response |
diarrhea or vomiting
|
| Host type |
human
|
||||||||||||||||||||
|---|---|---|---|---|---|---|---|---|---|---|---|---|---|---|---|---|---|---|---|---|---|
| # of Doses |
3.00
|
||||||||||||||||||||
| Dose Units |
CFU
|
||||||||||||||||||||
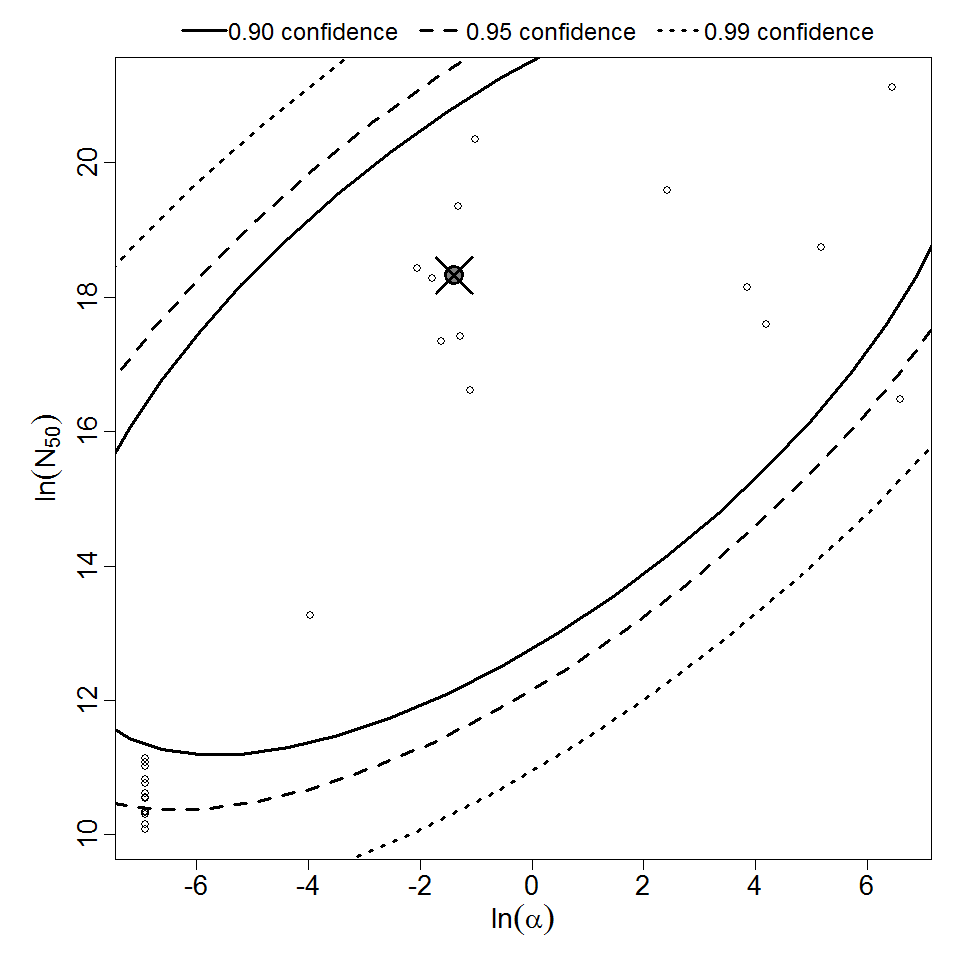
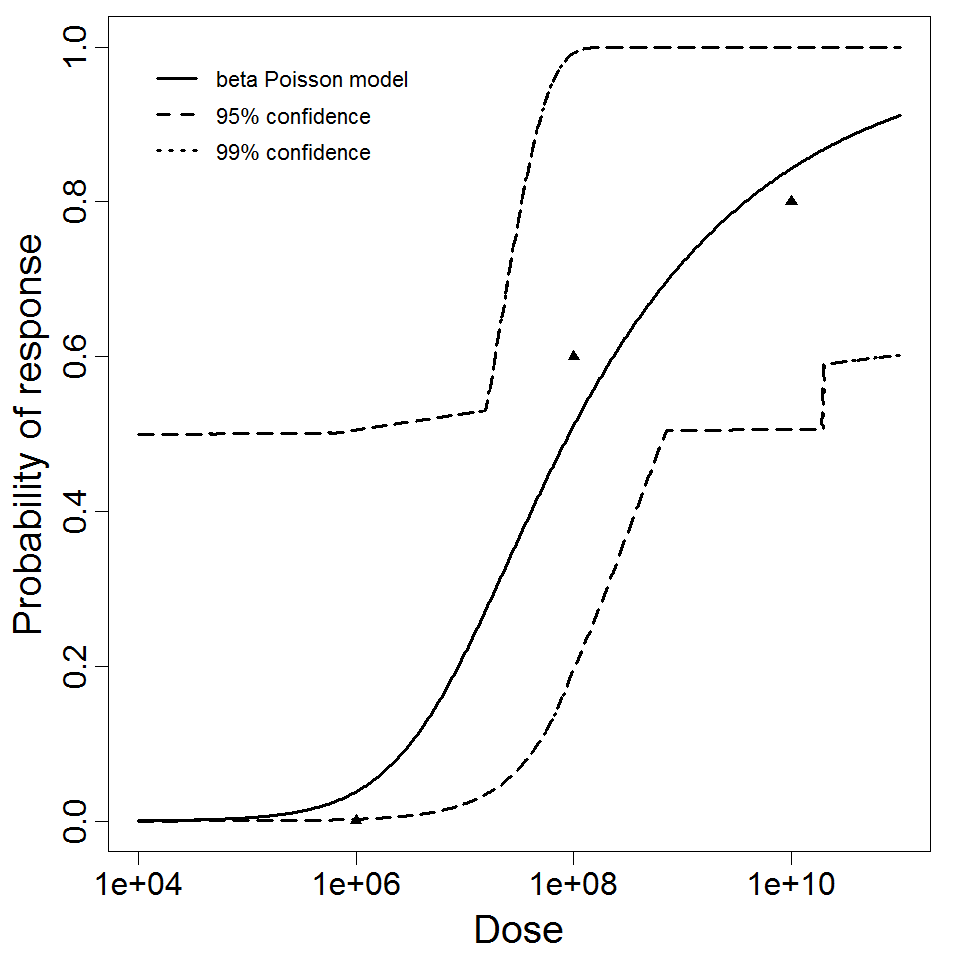
| Μodel |
beta-Poisson
|
||||||||||||||||||||
| a |
2.5E-01
|
||||||||||||||||||||
| N50 |
9.1E+07
|
||||||||||||||||||||
| LD50/ID50 |
9.1E+07
|
||||||||||||||||||||
| Experiment Dataset |
|
Description
|
| ||||||||||||||||||||||
| ||||||||||||||||||||||||||||||