| Experiment ID |
251
|
|---|---|
| Pathogen | |
| Agent Strain |
scrapie strain C506M3
|
| Contains Preferred Model |
No
|
| Reference |
Taylor, D. M., Woodgate, S. L., & Atkinson, M. J. (1995). Inactivation of the bovine spongiform encephalopathy agent by rendering procedures. Veterinary Record, 137(24). Retrieved from https://pubmed.ncbi.nlm.nih.gov/8746849/ |
| Exposure Route |
intraperitoneal
|
| Response |
death
|
| Host type |
mice
|
|---|---|
| # of Doses |
3.00
|
| Dose Units |
LD50 i.c.
|
| Μodel |
exponential
|
| k |
2.4E-05
|
| LD50/ID50 |
2.89E+04
|
Description
|
|
||||||||||||||||||||||
|
||||||||||||||||||||||||||||||||||||||

Parameter histogram for exponential model (uncertainty of the parameter)

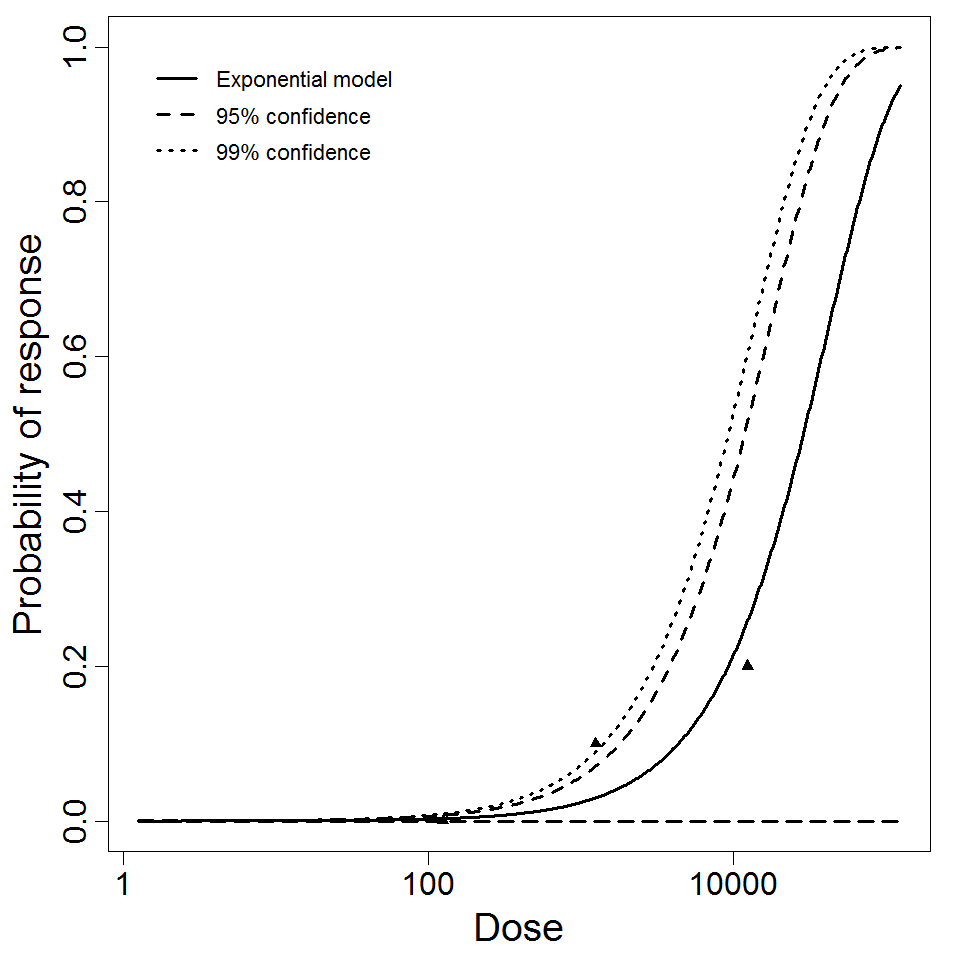
Exponential model plot, with confidence bounds around optimized model