| Experiment ID |
38, 42, 99, 165
|
|---|---|
| Pathogen | |
| Agent Strain |
ETEC B7A
|
| Contains Preferred Model |
No
|
| Reference |
DuPont, H. L., Formal, S. B., Hornick, R. B., Snyder, M. J., Libonati, J. P., Sheahan, D. G., … Kalas, J. P. (1971). Pathogenesis of Escherichia coli diarrhea. The New England Journal of Medicine, 285, 1. |
| Exposure Route |
oral (in milk)
|
| Response |
mild to severe diarrhea
|
| Host type |
human
|
||||||||||||||||||||
|---|---|---|---|---|---|---|---|---|---|---|---|---|---|---|---|---|---|---|---|---|---|
| # of Doses |
11.00
|
||||||||||||||||||||
| Dose Units |
CFU
|
||||||||||||||||||||
| Μodel |
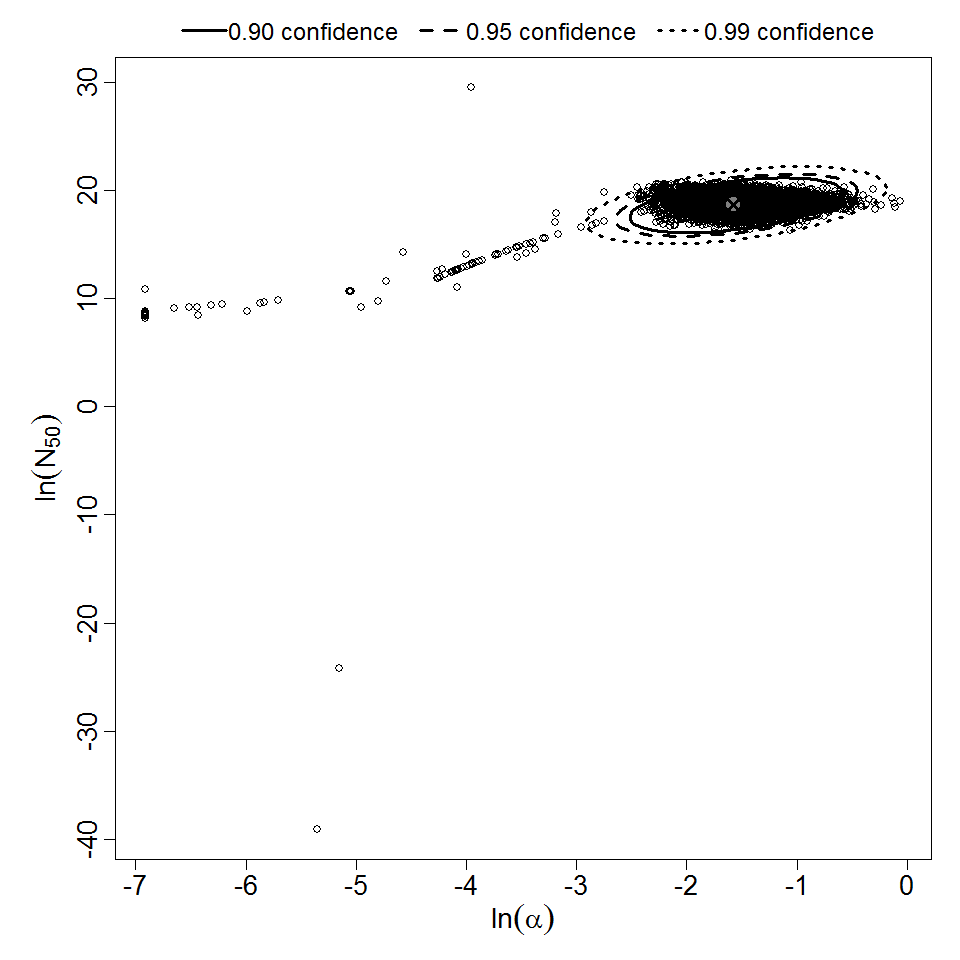
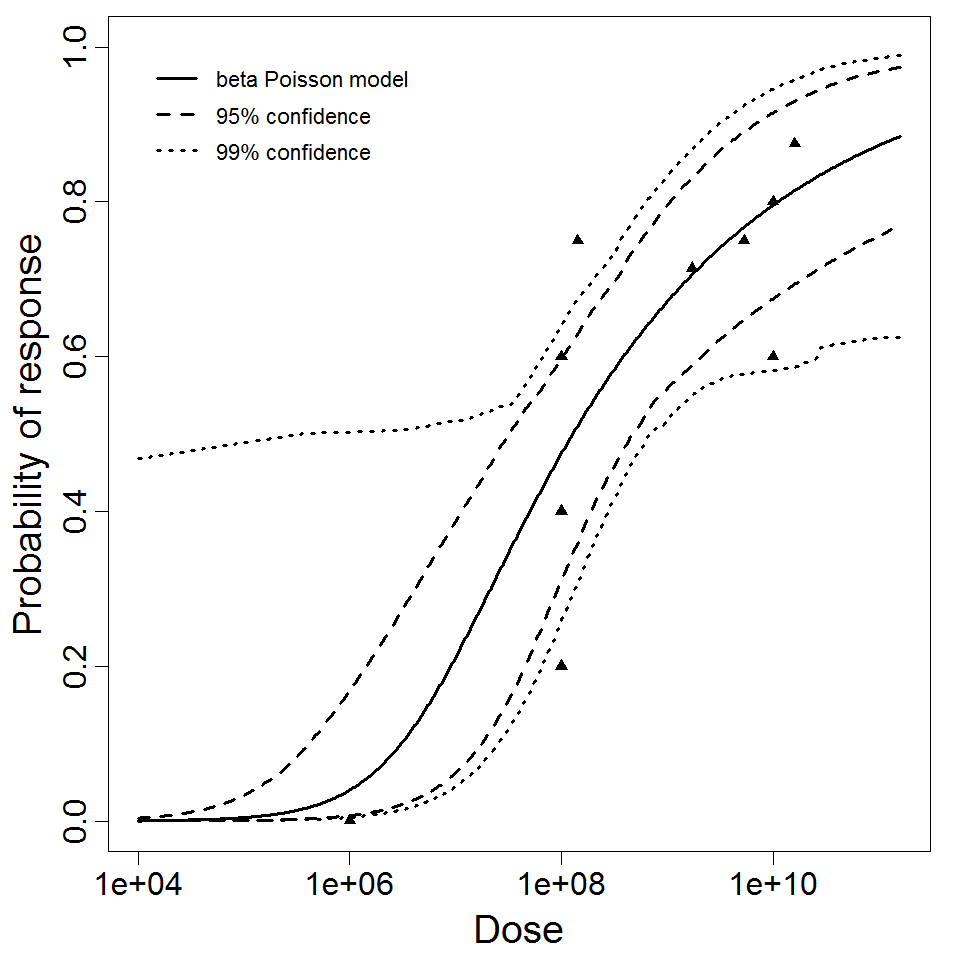
beta-Poisson
|
||||||||||||||||||||
| a |
2.06E-01
|
||||||||||||||||||||
| N50 |
1.28E+08
|
||||||||||||||||||||
| LD50/ID50 |
1.28E+08
|
||||||||||||||||||||
| Experiment Dataset |
|
Description
|
| ||||||||||||||||||||||
| ||||||||||||||||||||||||||||||