General Overview

Rhinovirus, a small icosahedral viruses made of a protein capsid that encases a single-stranded, positive-sense RNA molecule, belongs to the Picornaviridae family. About 100 different serotypes have been identified and characterized by their own specific antigens.

Rhinoviruses are responsible for 30 to 50% of adult colds and 10 to 25% of colds in children. Other cold-causing viruses are adenoviruses, coronaviruses, coxsackieviruses, echoviruses, orthomyxoviruses, paramyxoviruses, respiratory syncytial virus, and enteroviruses, each of which produces infections with slightly different patterns of symptoms and severity. Several of the above-mentioned viruses also account for other more severe illnesses, according to Bella and Rossmann.

Summary Data

Hendley et al. (1972) inoculated young adult human volunteers over the age of 21 with Rhinovirus type 39 (RV 39), strain SF 299, and rhinovirus type 14 (RV 14), strain SF 765, via intranasal exposure route. Shedding of the challenge virus and/or a fourfold or greater increase in titer of serum antibody to a homotypic rhinovirus were accepted as evidence of infection.

Summary

The responses caused by doses less than one observed in these two experiments are probably due to the uncertainties of dose counting in the original study.

ID Exposure Route # of Doses Agent Strain Dose Units Host type Μodel LD50/ID50 Optimized parameters Response type Reference
310 intranasal 6.00 type 14 TCID50 human beta-Poisson 3.83E+00 a = 2.52E-01 N50 = 3.83E+00 infection
Hendley, J. O., Edmondson, W. P., & Gwaltney, J. M. (1972). Relation between Naturally Acquired Immunity and Infectivity of Two Rhinoviruses in Volunteers. Journal of Infectious Diseases, 125, 3.
311 intranasal 6.00 type 39 TCID50 human beta-Poisson 1.9E-01 a = 7.01E-01 N50 = 1.9E-01 infection
Hendley, J. O., Edmondson, W. P., & Gwaltney, J. M. (1972). Relation between Naturally Acquired Immunity and Infectivity of Two Rhinoviruses in Volunteers. Journal of Infectious Diseases, 125, 3.
312 intranasal 6.00 type 14 TCID50 human beta-Poisson 2.22E+01 a = 1.81E-01 N50 = 2.22E+01 infection
Hendley, J. O., Edmondson, W. P., & Gwaltney, J. M. (1972). Relation between Naturally Acquired Immunity and Infectivity of Two Rhinoviruses in Volunteers. Journal of Infectious Diseases, 125, 3.
312, 313 intranasal 12.00 type 14 TCID50 human beta-Poisson 1.38E+01 a = 1.82E-01 N50 = 1.38E+01 infection
Hendley, J. O., Edmondson, W. P., & Gwaltney, J. M. (1972). Relation between Naturally Acquired Immunity and Infectivity of Two Rhinoviruses in Volunteers. Journal of Infectious Diseases, 125, 3.
313 intranasal 6.00 type 39 TCID50 human beta-Poisson 1.05E+01 a = 2,00E-01 N50 = 1.05E+01 infection
Hendley, J. O., Edmondson, W. P., & Gwaltney, J. M. (1972). Relation between Naturally Acquired Immunity and Infectivity of Two Rhinoviruses in Volunteers. Journal of Infectious Diseases, 125, 3.
64 intranasal 6.00 type 14 TCID50 human beta-Poisson 9.22E+00 a = 2.01E-01 N50 = 9.22E+00 infection
Hendley, J. O., Edmondson, W. P., & Gwaltney, J. M. (1972). Relation between Naturally Acquired Immunity and Infectivity of Two Rhinoviruses in Volunteers. Journal of Infectious Diseases, 125, 3.
65 intranasal 6.00 type 39 TCID50 human beta-Poisson 1.81E+00 a = 2.21E-01 N50 = 1.81E+00 infection
Hendley, J. O., Edmondson, W. P., & Gwaltney, J. M. (1972). Relation between Naturally Acquired Immunity and Infectivity of Two Rhinoviruses in Volunteers. Journal of Infectious Diseases, 125, 3.
Exposure Route:
intranasal
# of Doses:
6.00
Agent Strain:
type 14
Dose Units:
TCID50
Host type:
human
Μodel:
beta-Poisson
LD50/ID50:
3.83E+00
Optimized parameters: a = 2.52E-01 N50 = 3.83E+00
Response type:
infection

TITLE 
Dose INFECTION NOT

INFECTION || Total

0.5 1 4 5
1.5 2 3 5
5 3 2 5
15 2 1 3
150 14 5 19
300 5 0 5
Goodness of fit and model selection
Model Deviance Δ Degrees 
of freedom
χ20.95,1 
p-value
χ20.95,m-k 
p-value
Exponential 29.7 27.3 5 3.84 
{{{pbPbetter}}}
11.1 
1.71e-05
Beta Poisson 2.42 4 9.49 
0

selection

Beta-Poisson fits better than exponential; cannot reject good fit for beta-Poisson.
Optimized parameters for the beta-Poisson model, from 10000 bootstrapiterations
Parameter MLE estimate Percentiles
0.5% 2.5% 5% 95% 97.5% 99.5%
α 2.52E-01 9.79E-04 9.14E-02 1.16E-01 5.50E-01 6.41E-01 1.06E+00
N50 3.83E+00 9.08E-03 3.23E-01 6.41E-01 1.48E+01 2.04E+01 8.86E+01

Parameter scatter plot for beta Poisson model ellipses signify the 0.9, 0.95 and 0.99 confidence of the parameters.

beta Poisson model plot, with confidence bounds around optimized model

Exposure Route:
intranasal
# of Doses:
6.00
Agent Strain:
type 39
Dose Units:
TCID50
Host type:
human
Μodel:
beta-Poisson
LD50/ID50:
1.9E-01
Optimized parameters: a = 7.01E-01 N50 = 1.9E-01
Response type:
infection

Optimization Output for experiment 311

TITLE 
Dose INFECTION NOT

INFECTION || Total

0.05 0 2 2
0.15 1 3 4
0.5 5 2 7
1.5 18 1 19
5 1 0 1
50 19 1 20
Goodness of fit and model selection
Model Deviance Δ Degrees 
of freedom
χ20.95,1 
p-value
χ20.95,m-k 
p-value
Exponential 61.7 56.8 5 3.84 
{{{pbPbetter}}}
11.1 
5.32e-12
Beta Poisson 4.95 4 9.49 
0

selection

Beta-Poisson fits better than exponential; cannot reject good fit for beta-Poisson.
Optimized parameters for the beta-Poisson model, from 10000 bootstrapiterations
Parameter MLE estimate Percentiles
0.5% 2.5% 5% 95% 97.5% 99.5%
α 7.01E-01 2.29E-01 3.14E-01 3.63E-01 1.81E+06 3.82E+06 1.41E+07
N50 1.9E-01 2.27E-02 5.85E-02 7.93E-02 4.20E-01 4.52E-01 5.56E-01

Parameter scatter plot for beta Poisson model ellipses signify the 0.9, 0.95 and 0.99 confidence of the parameters.

beta Poisson model plot, with confidence bounds around optimized model

Exposure Route:
intranasal
# of Doses:
6.00
Agent Strain:
type 14
Dose Units:
TCID50
Host type:
human
Μodel:
beta-Poisson
LD50/ID50:
2.22E+01
Optimized parameters: a = 1.81E-01 N50 = 2.22E+01
Response type:
infection

TITLE 
Dose INFECTION NOT

INFECTION || Total

0.5 0 4 4
1.5 2 3 5
5 1 4 5
15 4 3 7
150 13 8 21
300 5 2 7
Goodness of fit and model selection
Model Deviance Δ Degrees 
of freedom
χ20.95,1 
p-value
χ20.95,m-k 
p-value
Exponential 24.3 21.5 5 3.84 
{{{pbPbetter}}}
11.1 
0.000194
Beta Poisson 2.77 4 9.49 
0

selection

Beta-Poisson fits better than exponential; cannot reject good fit for beta-Poisson.
Optimized parameters for the beta-Poisson model, from 10000 bootstrapiterations
Parameter MLE estimate Percentiles
0.5% 2.5% 5% 95% 97.5% 99.5%
α 1.81E-01 3.92E-02 7.30E-02 9.02E-02 4.00E-01 4.79E-01 7.28E-01
N50 2.22E+01 3.12E+00 5.01E+00 6.38E+00 1.22E+02 2.06E+02 1.26E+03

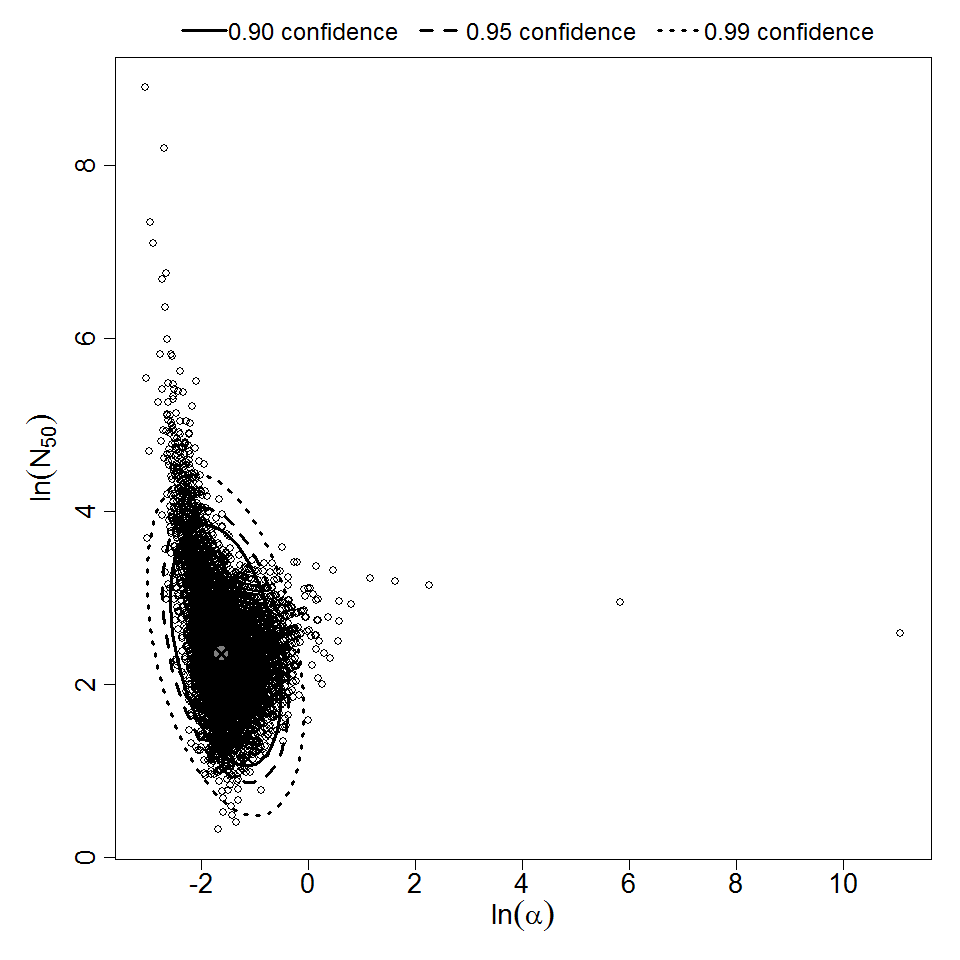
Parameter scatter plot for beta Poisson model ellipses signify the 0.9, 0.95 and 0.99 confidence of the parameters.
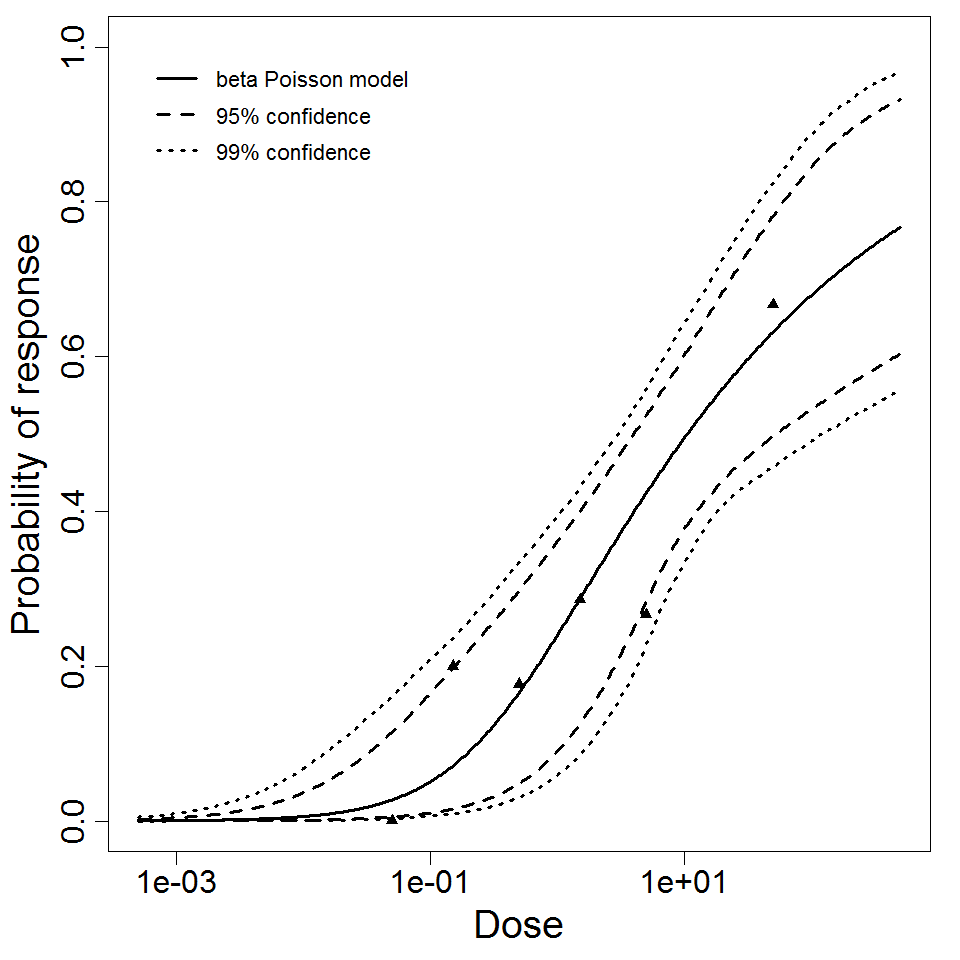
beta Poisson model plot, with confidence bounds around optimized model

Exposure Route:
intranasal
# of Doses:
12.00
Agent Strain:
type 14
Dose Units:
TCID50
Host type:
human
Μodel:
beta-Poisson
LD50/ID50:
1.38E+01
Optimized parameters: a = 1.82E-01 N50 = 1.38E+01
Response type:
infection

TITLE 
Dose INFECTION NOT

INFECTION || Total

0.05 0 4 4
0.15 1 4 5
0.5 0 4 4
0.5 3 14 17
1.5 2 3 5
1.5 4 10 14
5 1 4 5
5 4 11 15
15 4 3 7
50 28 14 42
150 13 8 21
300 5 2 7

"

Goodness of fit and model selection
Model Deviance Δ Degrees 
of freedom
χ20.95,1 
p-value
χ20.95,m-k 
p-value
Exponential 78.6 72.3 11 3.84 
{{{pbPbetter}}}
19.7 
2.8e-12
Beta Poisson 6.22 10 18.3 
0.796
{{{interpretation}}}

"

Optimized parameters for the beta-Poisson model, from 10000 bootstrapiterations
Parameter MLE estimate Percentiles
0.5% 2.5% 5% 95% 97.5% 99.5%
α 1.82E-01 1.04E-03 1.03E-01 1.14E-01 3.04E-01 3.38E-01 4.09E-01
N50 1.38E+01 2.98E+00 5.64E+00 6.67E+00 3.77E+01 4.98E+01 1.32E+02

Parameter scatter plot for beta Poisson model ellipses signify the 0.9, 0.95 and 0.99 confidence of the parameters.

beta Poisson model plot, with confidence bounds around optimized model

Exposure Route:
intranasal
# of Doses:
6.00
Agent Strain:
type 39
Dose Units:
TCID50
Host type:
human
Μodel:
beta-Poisson
LD50/ID50:
1.05E+01
Optimized parameters: a = 2,00E-01 N50 = 1.05E+01
Response type:
infection

TITLE 
Dose INFECTION NOT

INFECTION || Total

0.05 0 4 4
0.15 1 4 5
0.5 3 14 17
1.5 4 10 14
5 4 11 15
50 28 14 42
Goodness of fit and model selection
Model Deviance Δ Degrees 
of freedom
χ20.95,1 
p-value
χ20.95,m-k 
p-value
Exponential 29.2 26.2 5 3.84 
{{{pbPbetter}}}
11.1 
2.16e-05
Beta Poisson 2.93 4 9.49 
0

selection

Beta-Poisson fits better than exponential; cannot reject good fit for beta-Poisson.
Optimized parameters for the beta-Poisson model, from 10000 bootstrapiterations
Parameter MLE estimate Percentiles
0.5% 2.5% 5% 95% 97.5% 99.5%
α 2E-01 7.86E-02 9.79E-02 1.11E-01 4.65E-01 5.58E-01 8.66E-01
N50 1.05E+01 3.00E+00 3.98E+00 4.65E+00 3.67E+01 5.32E+01 1.22E+02

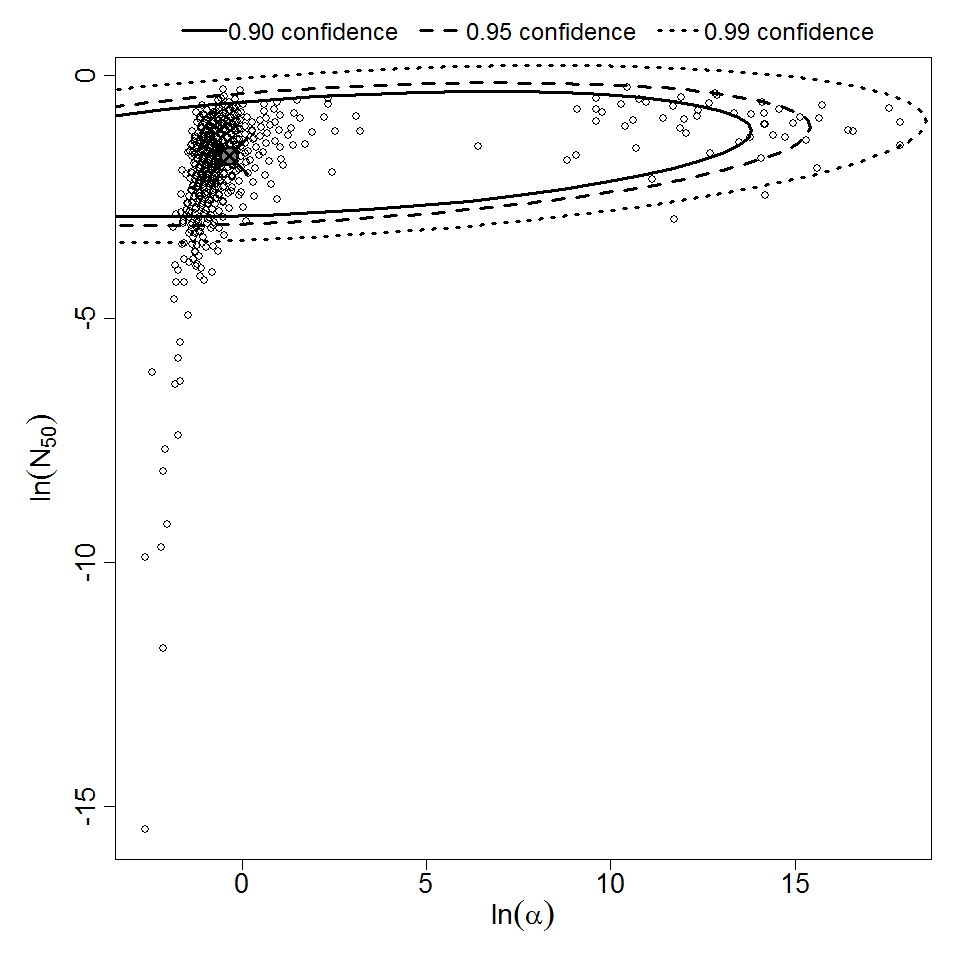
Parameter scatter plot for beta Poisson model ellipses signify the 0.9, 0.95 and 0.99 confidence of the parameters.

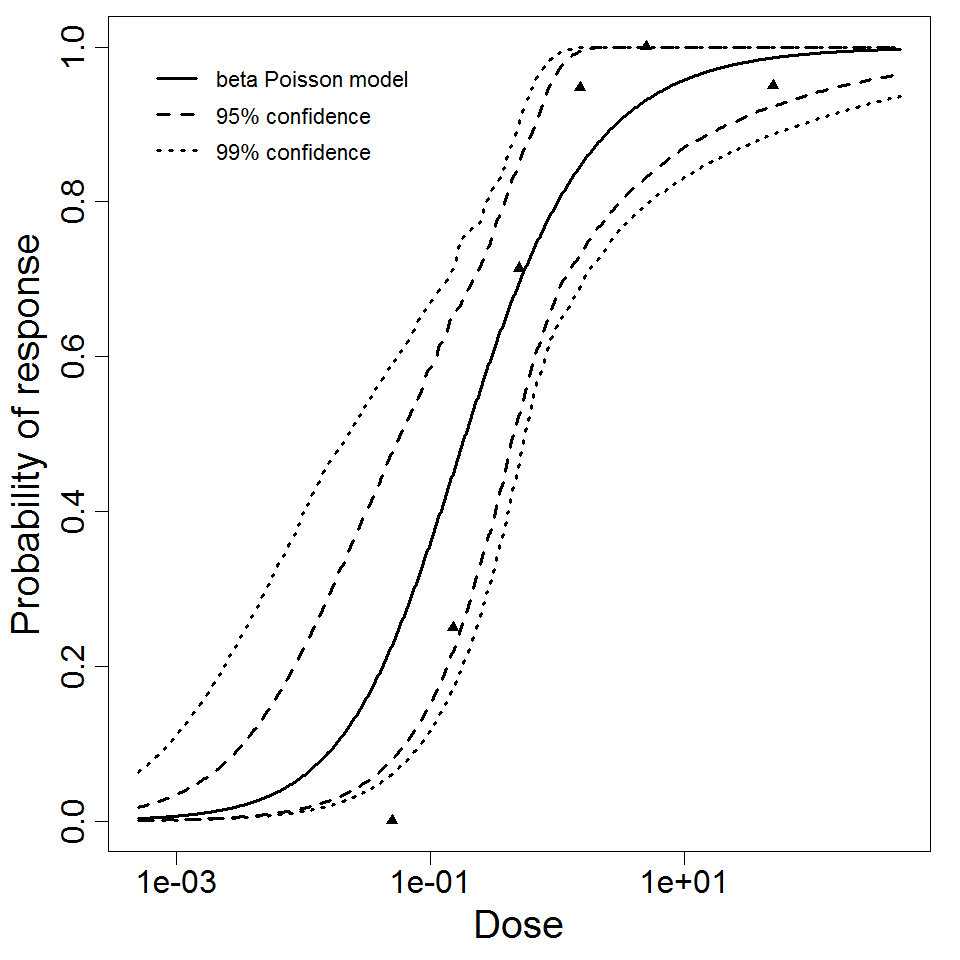
beta Poisson model plot, with confidence bounds around optimized model
Exposure Route:
intranasal
# of Doses:
6.00
Agent Strain:
type 14
Dose Units:
TCID50
Host type:
human
Μodel:
beta-Poisson
LD50/ID50:
9.22E+00
Optimized parameters: a = 2.01E-01 N50 = 9.22E+00
Response type:
infection

human/type 14 strain SF 765model data 
Dose Infected Non-infected Total
0.5 1 8 9
1.5 4 6 10
5 4 6 10
15 6 4 10
150 27 13 40
300 10 2 12


Goodness of fit and model selection
Model Deviance Δ Degrees 
of freedom
χ20.95,1 
p-value
χ20.95,m-k 
p-value
Exponential 51.8 50.2 5 3.84 
1.42e-12
11.1 
5.8e-10
Beta Poisson 1.68 4 9.49 
0.794
Beta-Poisson fits better than exponential; cannot reject good fit for beta-Poisson.


Optimized parameters for the beta-Poisson model, from 10000 bootstrap iterations
Parameter MLE estimate Percentiles
0.5% 2.5% 5% 95% 97.5% 99.5%
α 2.01E-01 7.76E-02 1.07E-01 1.22E-01 3.36E-01 3.69E-01 4.61E-01
N50 9.22E+00 1.41E+00 2.57E+00 3.40E+00 2.47E+01 3.14E+01 5.26E+01


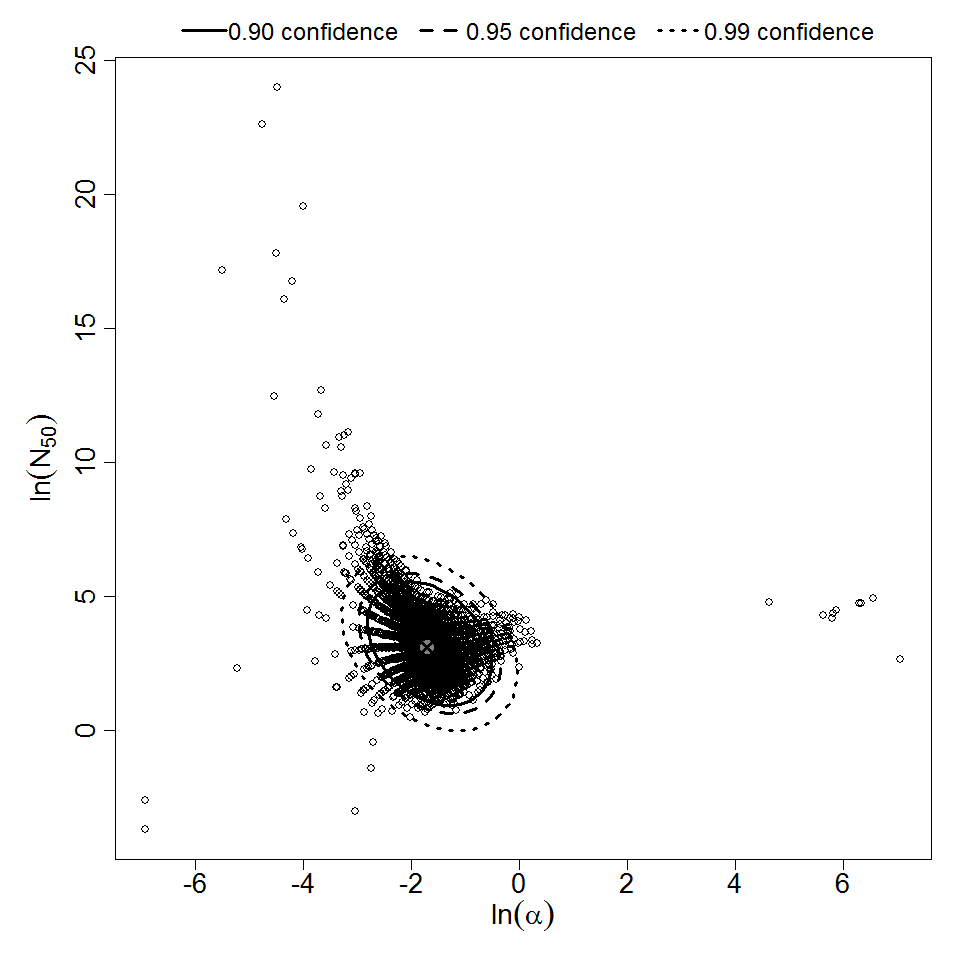
Parameter scatter plot for beta Poisson model ellipses signify the 0.9, 0.95 and 0.99 confidence of the parameters.

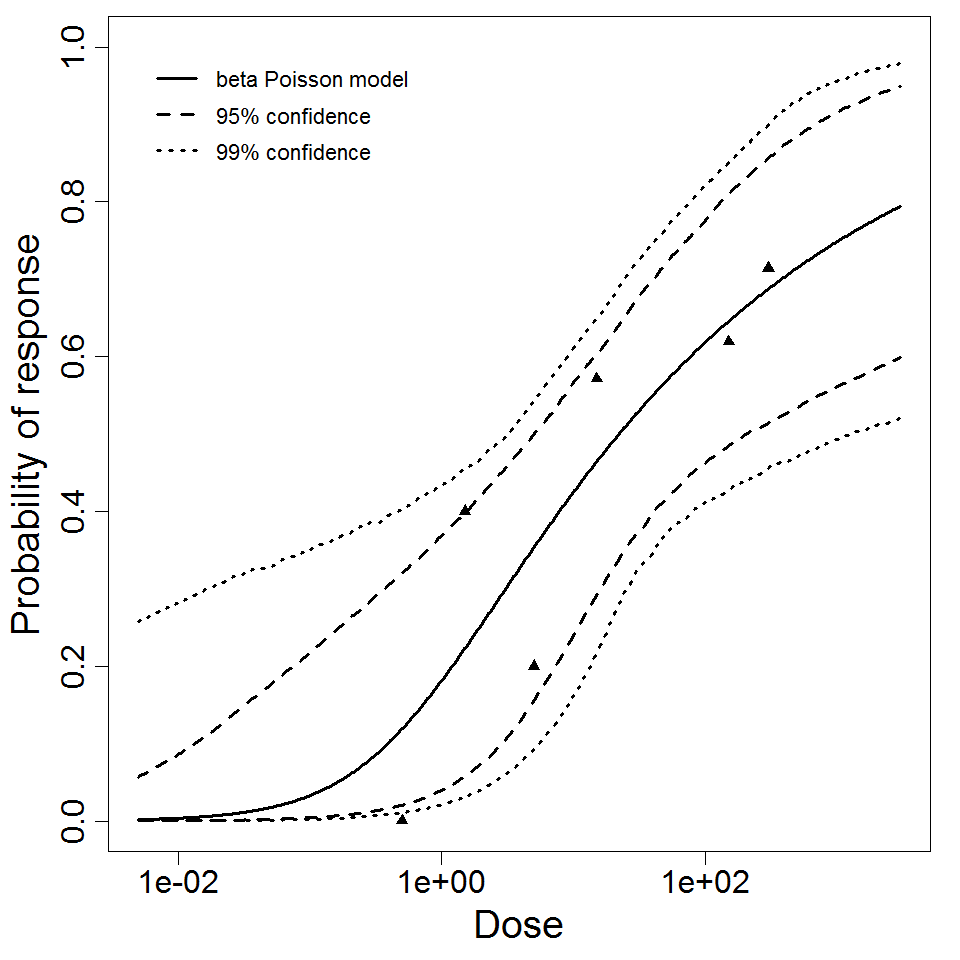
beta Poisson model plot, with confidence bounds around optimized model
Highest quality
Exposure Route:
intranasal
# of Doses:
6.00
Agent Strain:
type 39
Dose Units:
TCID50
Host type:
human
Μodel:
beta-Poisson
LD50/ID50:
1.81E+00
Optimized parameters: a = 2.21E-01 N50 = 1.81E+00
Response type:
infection

human/type 39 strain SF 299 model data 
Dose Infected Non-infected Total
0.05 0 11 11
0.15 2 7 9
0.5 8 16 24
5 5 11 16
50 47 15 62


Goodness of fit and model selection
Model Deviance Δ Degrees 
of freedom
χ20.95,1 
p-value
χ20.95,m-k 
p-value
Exponential 50.3 44.3 4 3.84 
2.76e-11
9.49 
3.06e-10
Beta Poisson 6.01 3 7.81 
0.111
Beta-Poisson fits better than exponential; cannot reject good fit for beta-Poisson.


Optimized parameters for the beta-Poisson model, from 10000 bootstrap iterations
Parameter MLE estimate Percentiles
0.5% 2.5% 5% 95% 97.5% 99.5%
α 2.24E-01 9.88E-04 1.40E-01 1.53E-01 3.71E-01 4.27E-01 7.63E-01
N50 3.29E+00 1.90E-02 1.34E+00 1.59E+00 7.67E+00 9.27E+00 1.59E+01


Parameter scatter plot for beta Poisson model ellipses signify the 0.9, 0.95 and 0.99 confidence of the parameters.

beta Poisson model plot, with confidence bounds around optimized model
References

  • Bella, J. ., & Rossmann, M. G. (1999). Rhinoviruses and their ICAM receptors. Journal of Structural Biology, 128, 69–74. Retrieved from https://www.sciencedirect.com/science/article/pii/S1047847799941436
  • Hendley, J. O., Edmondson, W. P., & Gwaltney, J. M. (1972). Relation between Naturally Acquired Immunity and Infectivity of Two Rhinoviruses in Volunteers. Journal of Infectious Diseases, 125, 3.
  • Hendley, O. ., Edmondson, W. P. , Jr, & Gwaltney, J. M. , Jr. (1972). Relation between naturally acquired immunity and infectivity of two rhinoviruses in volunteers. Journal of Infectious Diseases, 125, 243–248.