Description
|
| ||||||||||||||||||||||
| ||||||||||||||||||||||||||||||
# of Doses
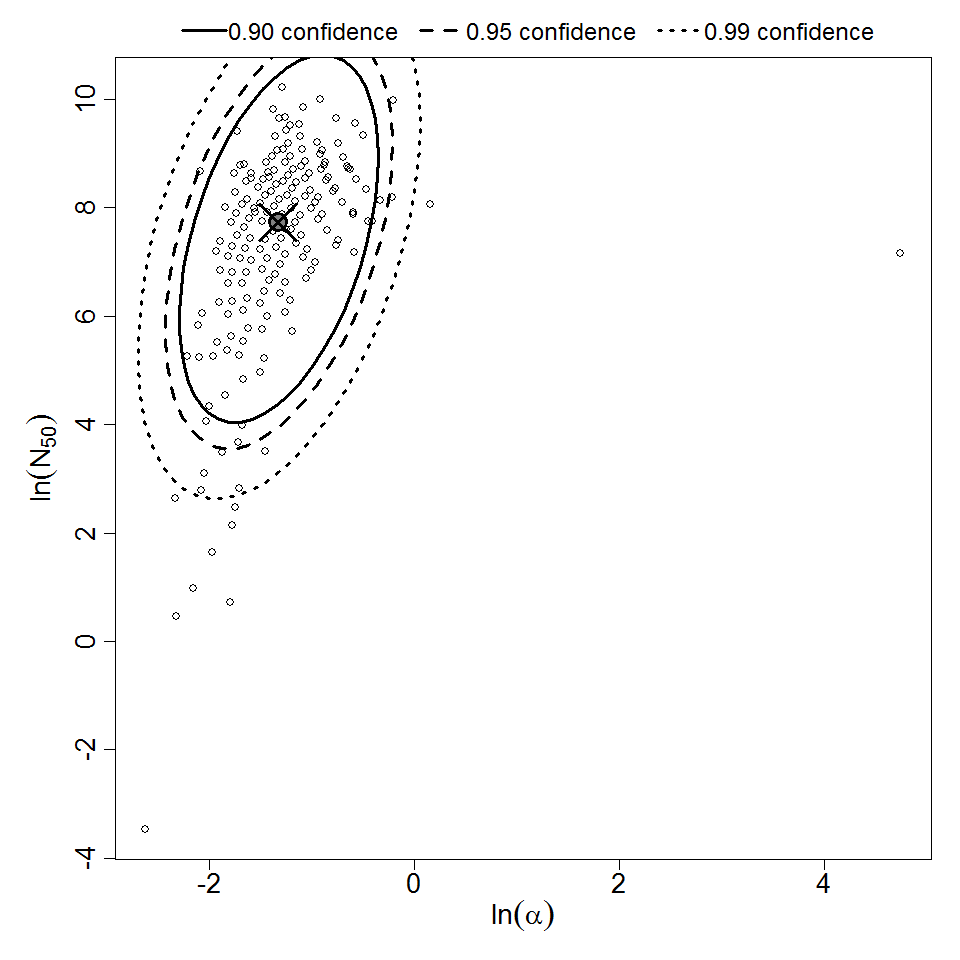
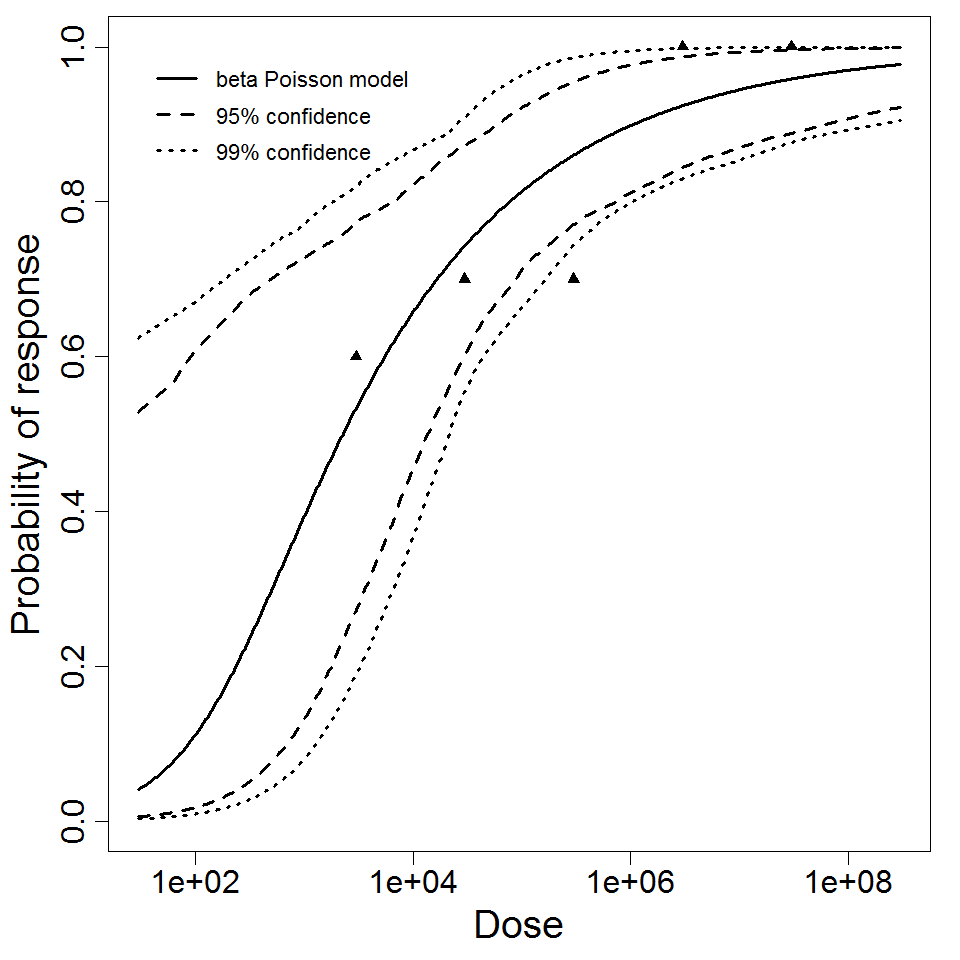
5.00
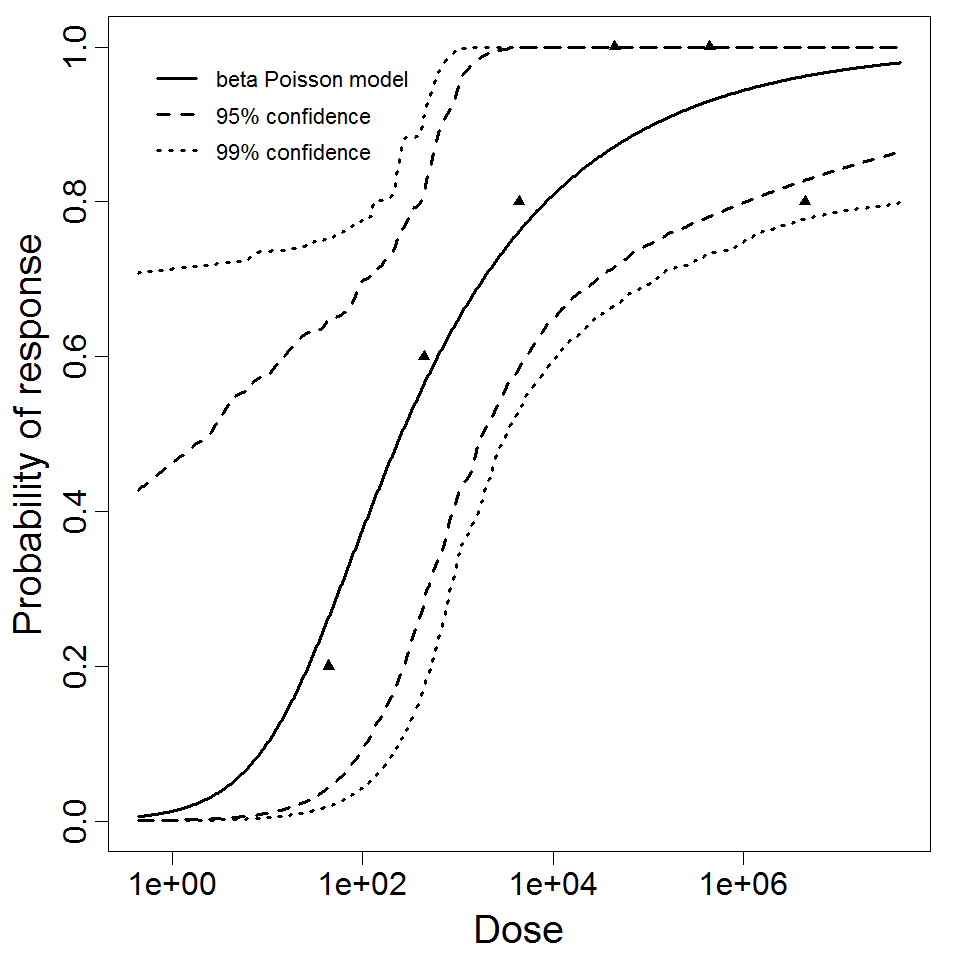
Μodel
N50
2.27E+03
LD50/ID50
2.27E+03
Dose Units
Response
Exposure Route
Contains Preferred Model
a
2.65E-01
Agent Strain
316c
Experiment ID
23
Host type
Experiment Dataset
Description
| ||||||||||||||||||||||
| ||||||||||||||||||||||||||||||
# of Doses
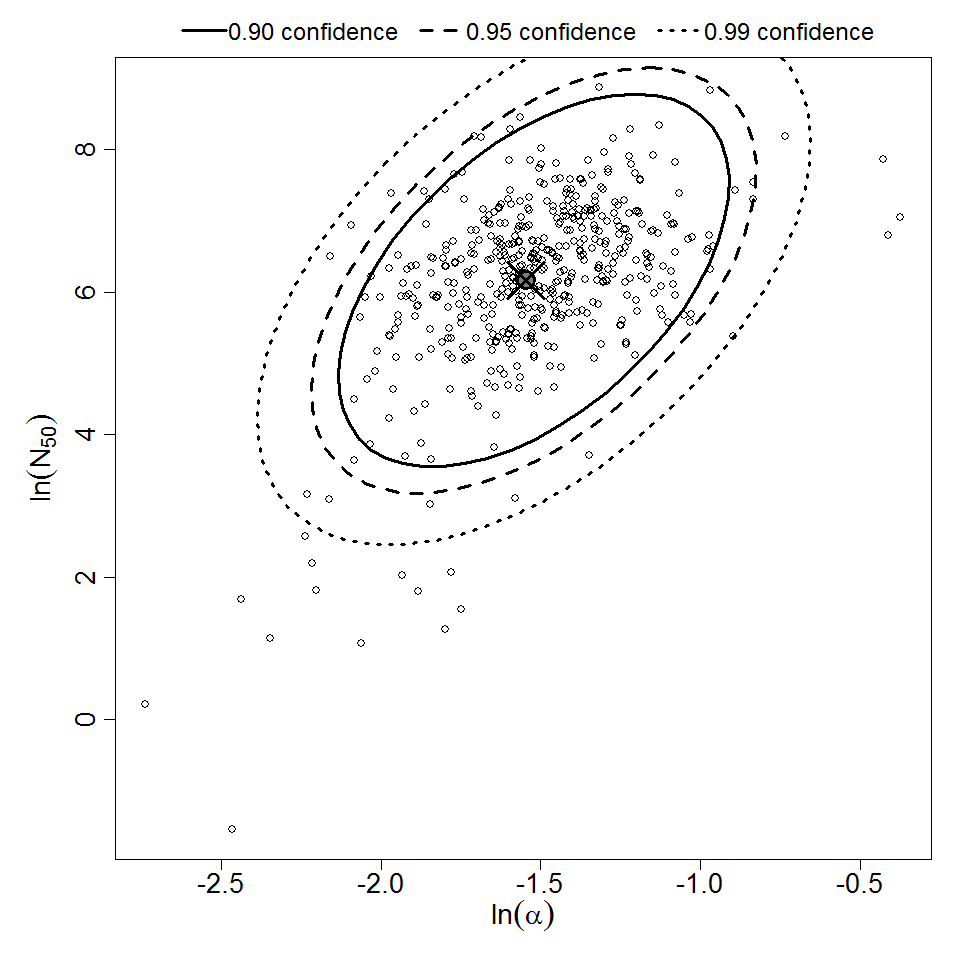
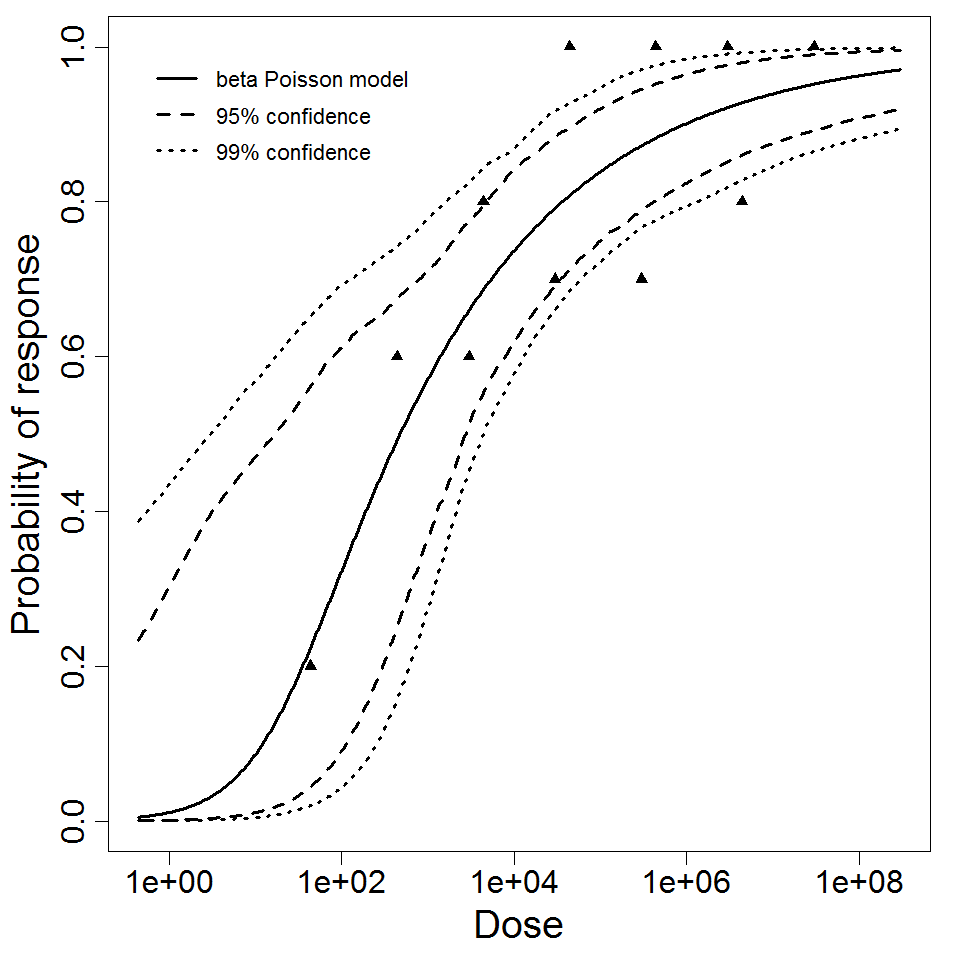
11.00
Μodel
N50
4.77E+02
LD50/ID50
4.77E+02
Dose Units
Response
Exposure Route
Contains Preferred Model
a
2.13E-01
Agent Strain
W294, 316c
Experiment ID
21,23
Host type
Experiment Dataset
Description
|
| ||||||||||||||||||||||
| ||||||||||||||||||||||||||||||

# of Doses
6.00
Μodel
N50
2.55E+02
LD50/ID50
2.55E+02
Dose Units
Response
Exposure Route
Contains Preferred Model
a
2.67E-01
Agent Strain
W294
Experiment ID
21
Host type
Experiment Dataset