| Experiment ID | Acanth_Cornea1 |
|---|---|
| Pathogen | |
| Contains Preferred Model | 0 |
| Status | fitted |
| Host type | |||||||||||||||||||||
|---|---|---|---|---|---|---|---|---|---|---|---|---|---|---|---|---|---|---|---|---|---|
| # of Doses | 4.00 | ||||||||||||||||||||
| Μodel | |||||||||||||||||||||
| k | 1.01E-04 | ||||||||||||||||||||
| LD50/ID50 | 6,886 | ||||||||||||||||||||
| Dose Units | |||||||||||||||||||||
| Response | |||||||||||||||||||||
| Agent Strain | Acanthamoeba Ac118 | ||||||||||||||||||||
| Exposure Route | |||||||||||||||||||||
| Experiment Dataset |
| ||||||||||||||||||||
| Resampled Parameters |
Description:
Badenoch et al. (1990)[1] studied the combined effect of Acanthamoeba Ac118 (a group III isolate) and the bacterium Corynebacterium xerosis on the corneas of female Porton rats. A constant dose of 104 C. xerosis with increasing doses of Acanthamoeba spp. were injected into incisions in the rat corneas using a microsyringe (Badenoch et al. 1990)[1].
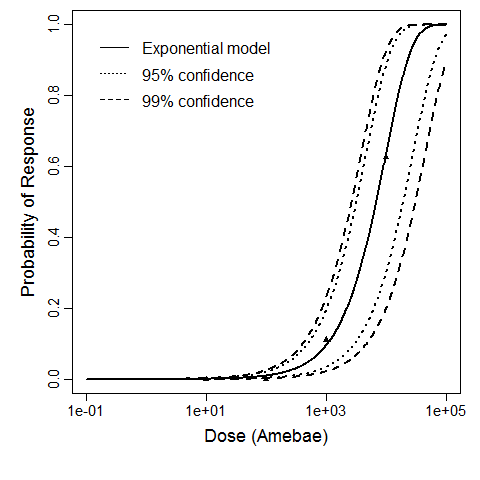
The exponential model provided the best fit to the data.
Figure 1: Plot of the exponential model fit to Experiment 1 with upper and lower 95% and 99% confidence
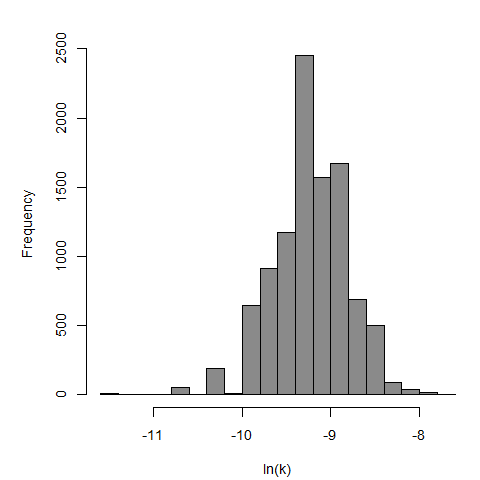
Figure 2: Histogram of the 10,000 bootstrap replicates of k for the best fitting exponential model fit to Experiment 1
 QMRA
QMRA 
