General Overview
Pseudomonas aeruginosa is a Gram-negative, aerobic rod belonging to the bacterial family Pseudomonadaceae. Like other members of the genus, Pseudomonas aeruginosa is a free-living bacterium, commonly found in soil, water and biofilms. However, it occurs regularly on the surfaces of plants and occasionally on the surfaces of animals. Pseudomonas aeruginosa is an opportunistic pathogen, meaning that it exploits some break in the host defenses to initiate an infection. (CDC 1990, Todar 2012) .
Pseudomonas aeruginosa generally invades the body or organs lacking natural defenses, and usually the infection are chronic rather than acute, evoking little systemic response. When introduced into the cornea, however, as in penetration by a foreign body or in contaminated medicines, it acts with extreme virulence, in many cases causing blindness and even necessitating enucleation (Spencer, 1953) . It is the organism most frequently implicated in contact lens related keratitis (Lawin-Brüssel et al., 1993) .
http://www.cdc.gov/mmwr/preview/mmwrhtml/00001546.htm
Summary Data
Lawin-Brussel et al. (1993) studied the effect of Pseudomonas aeruginosa in experimental contact lens related microbial keratitis. Forty white New Zealand rabbits were used in the experiment. New and worn soft contact lenses were soaked in 5 ml bacterial suspension of different concentrations for an hour, then fitted into the eyes of the rabbit (one lense per rabbit). The clinical findings after seven days of contact lens wear and additional 48 hours of P. aeruginosa contaminated lens wear were recorded. The experimental dose unit was CFU/ml. However, Lawin-Brussel et al. (1993) had observed quantification of bacterial attachment on soft contact lens after an hour of soaking in different concentration of P. aeruginosa. Based on the figure, the bacterial attachment on a lens was calculated as the dose.
| CFU/ml | CFU (per lens) |
|---|---|
| 100 | 63.22 |
| 10000 | 2220.49 |
| 100000 | 13159.77 |
| 1000000 | 77991.7 |
| 10000000 | 86799.77 |
| 100000000 | 462219,6 |
Similarly, Hazlett et al (1978) studied the susceptibility of newborn and infant mice to eye infection by P. aeruginosa. 15-16-day old mice were infected by topical application of P. aeruginosa of various dilutions onto wounded and unwounded corneas. None of the infected mice died of bacteremia and only those mice receiving corneal wounding before infection showed keratitis and eye shrinkage. Moreover, no cataract formation was detected in the mice.
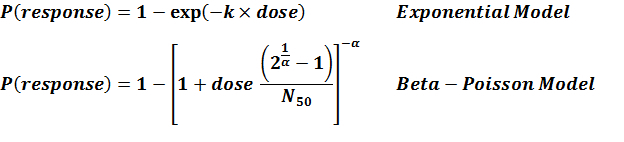
Recommended Model
The pooled model (experiment number 297 and 298) was recommended as both the data could statistically pooled and more data in the model means improvement in fits. The recommended model is as the marker of severe eye infection , it could be either corneal ulceration or stromal ulceration.
| ID | Exposure Route | # of Doses | Agent Strain | Dose Units | Host type | Μodel | LD50/ID50 | Optimized parameters | Response type | Reference |
|---|---|---|---|---|---|---|---|---|---|---|
| 286 | contact lens | 5.00 | ATCC 19660 | CFU | Swiss webster mice | exponential | 7.88E+06 | k = 8.8E-08 | infection (Keratitis) |
Hazlett, L. D., Rosen, D. D., & Berk, R. S. (1978). Age-Related Susceptibility to Pseudomonas aeruginosa Ocular Infections in Mice. Infection and Immunity, 20, 1. |
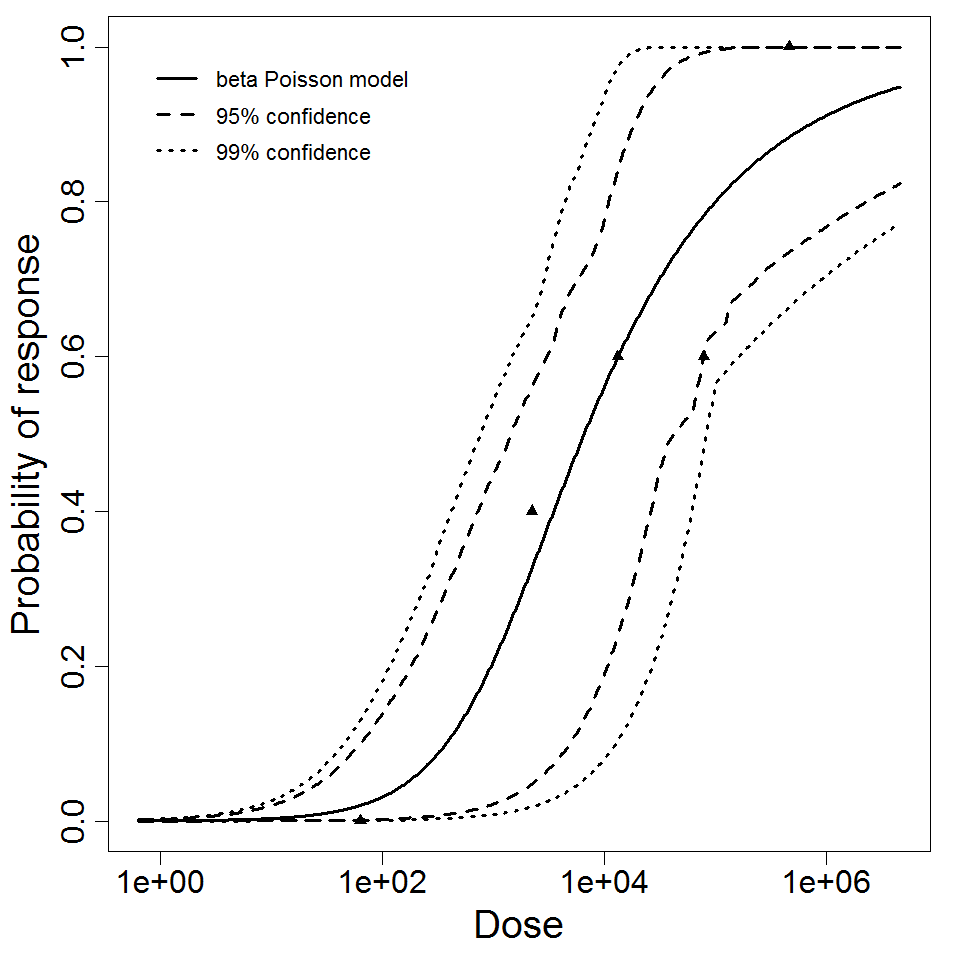
| 297 | contact lens | 5.00 | CFU | white rabbit | beta-Poisson | 6.57E+03 | a = 3.55E-01 N50 = 6.57E+03 | corneal ulceration |
Lawin-Brüssel, C. A., Refojo, M. F., Leong, F. L., Hanninen, L. ., & Kenyon, K. R. (1993). Effect of Pseudomonas aeruginosa concentration in experimental contact lens-related microbial keratitis. Cornea, 12, 1. |
|
| 297 & 298 | contact lens | 10.00 | CFU | white rabbit | beta-Poisson | 1.85E+04 | a = 1.9E-01 N50 = 1.85E+04 | corneal ulceration |
Lawin-Brüssel, C. A., Refojo, M. F., Leong, F. L., Hanninen, L. ., & Kenyon, K. R. (1993). Effect of Pseudomonas aeruginosa concentration in experimental contact lens-related microbial keratitis. Cornea, 12, 1. |
|
| 298 | contact lens | 5.00 | CFU | white rabbit | beta-Poisson | 1.52E+05 | a = 1.09E-01 N50 = 1.52E+05 | Severe stromal ulceration |
Lawin-Brüssel, C. A., Refojo, M. F., Leong, F. L., Hanninen, L. ., & Kenyon, K. R. (1993). Effect of Pseudomonas aeruginosa concentration in experimental contact lens-related microbial keratitis. Cornea, 12, 1. |
|
|
||||||||||||||||||||||
|
||||||||||||||||||||||||||||||||||||||
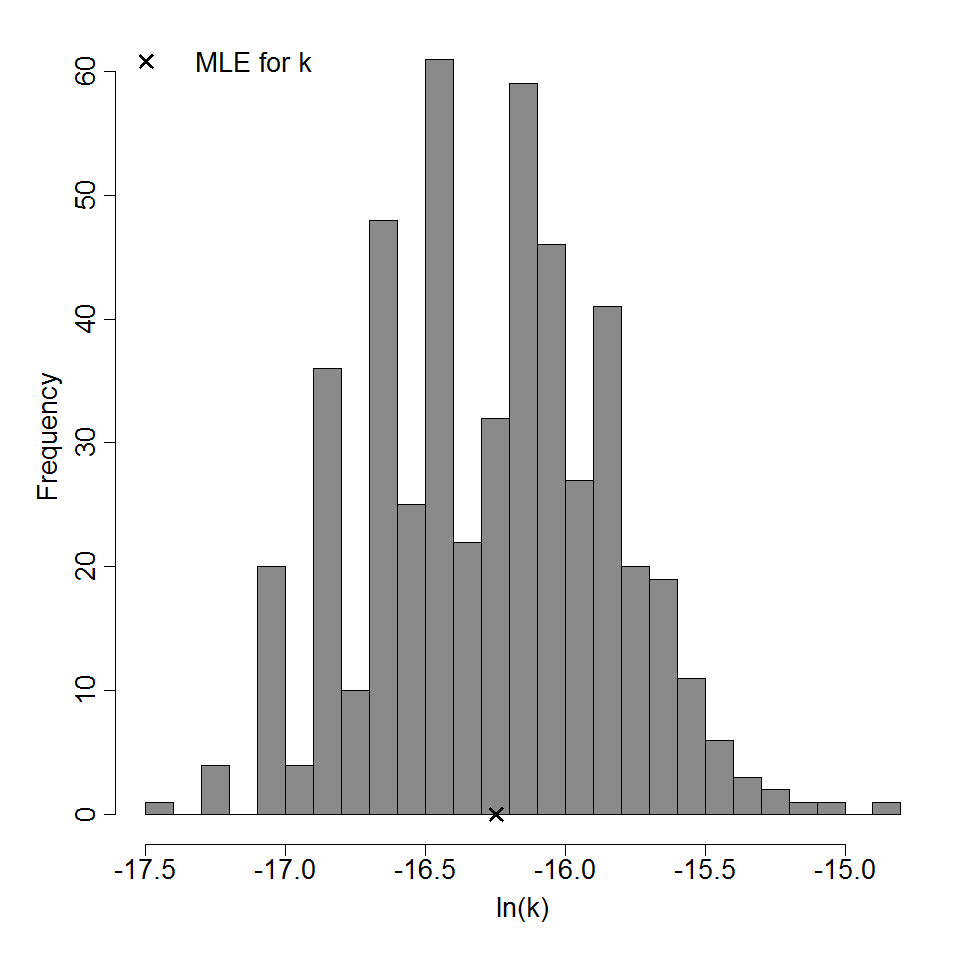
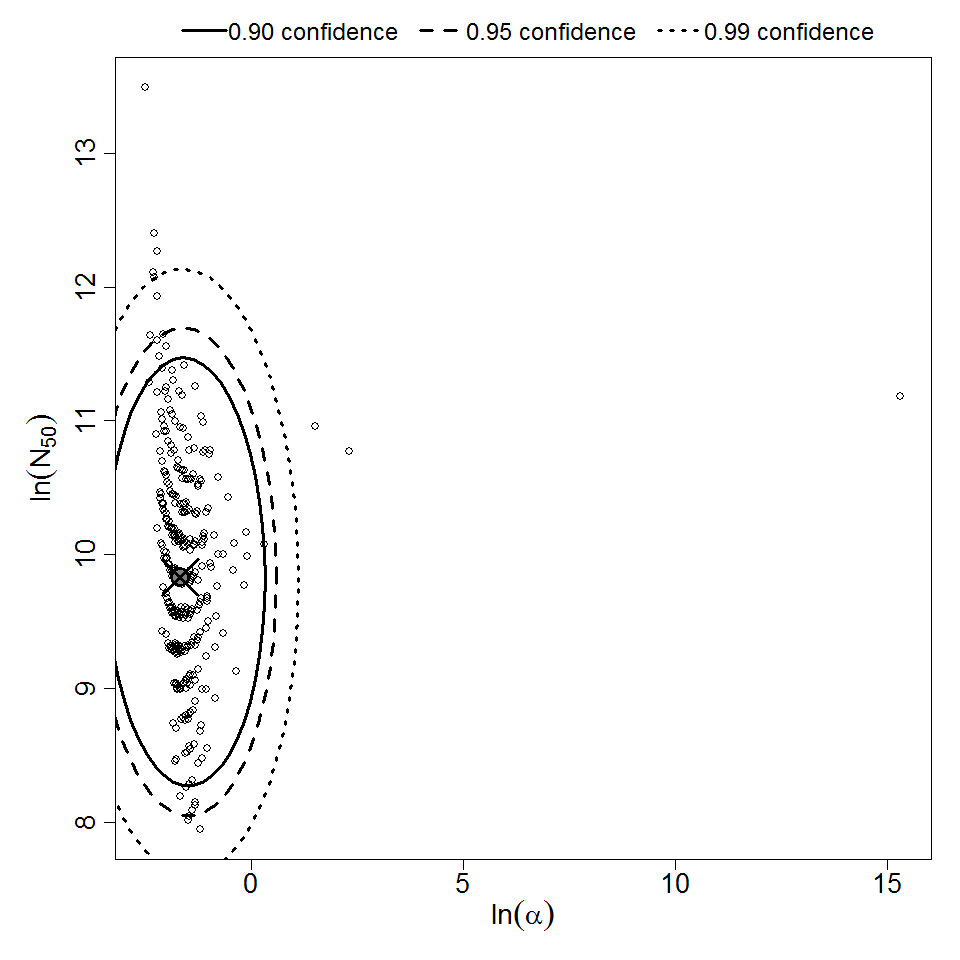
Parameter histogram for exponential model (uncertainty of the parameter)
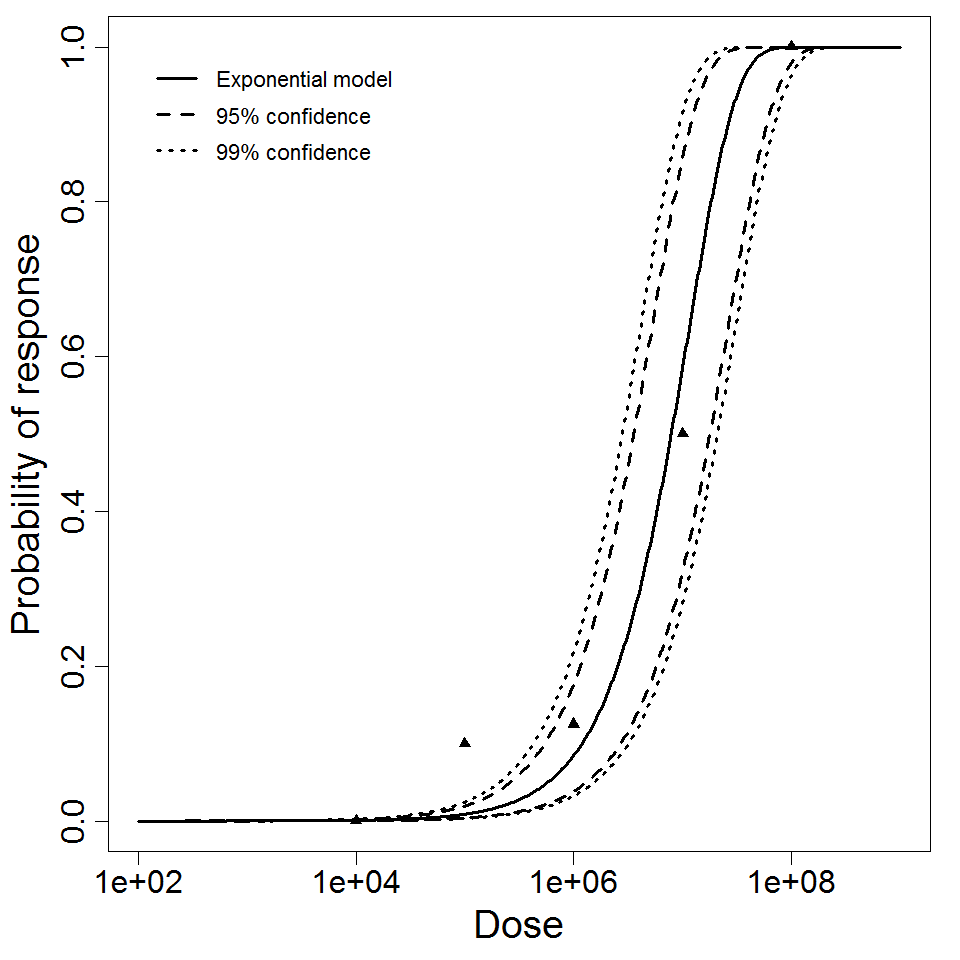
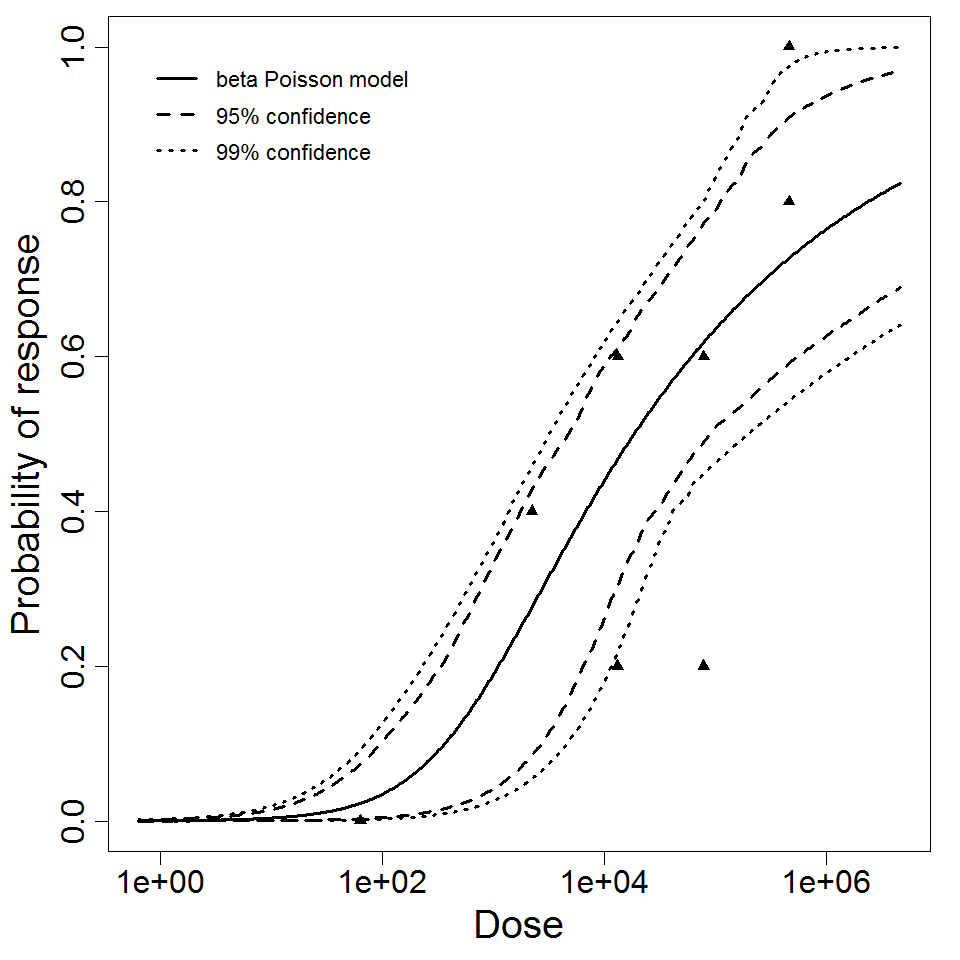
Exponential model plot, with confidence bounds around optimized model
|
|
||||||||||||||||||||||
|
||||||||||||||||||||||||||||||

Parameter histogram for exponential model (uncertainty of the parameter)
Exponential model plot, with confidence bounds around optimized model
|
||||||||||||||||||||||
|
||||||||||||||||||||||||||||||
Parameter histogram for exponential model (uncertainty of the parameter)
Exponential model plot, with confidence bounds around optimized model
|
|
||||||||||||||||||||||
|
||||||||||||||||||||||||||||||
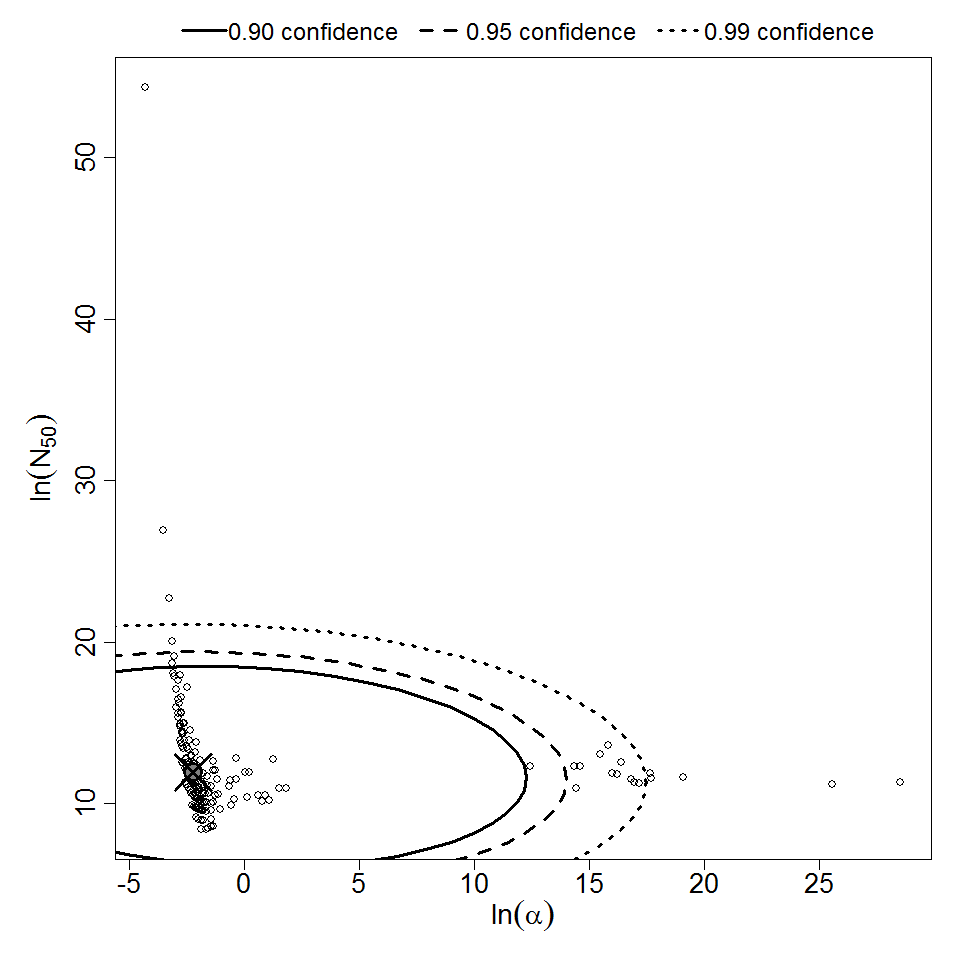
Parameter histogram for exponential model (uncertainty of the parameter)
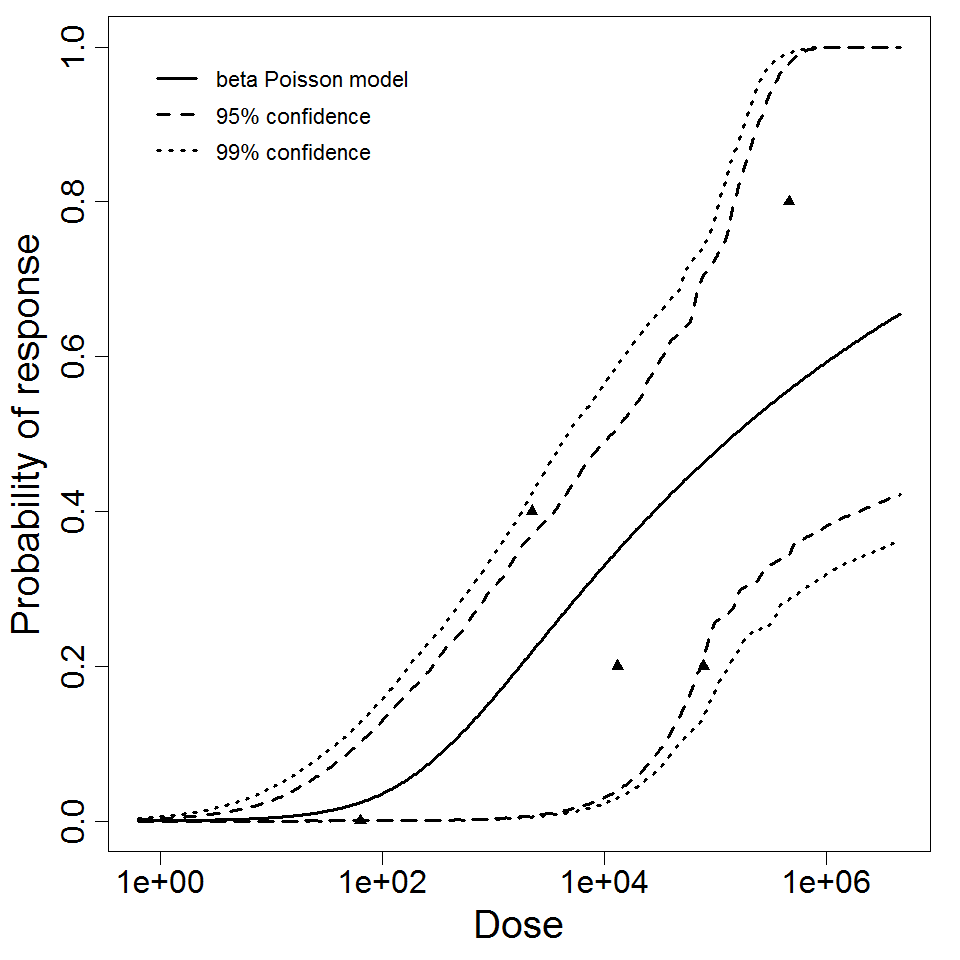
Exponential model plot, with confidence bounds around optimized model