General Overview
Salmonella, a genus of rod-shaped, gram-negative, non-spore forming, predominantly motile enterobacteria, causes more than 104 cases of infections per year in United States. [1] Non-typhoidal salmonellae are important causes of many foodborne infections. Approximately 45,000 cases and 600 deaths have been reported annually to the Centers for Disease Control in the past decade. Salmonellae have a wide range of hosts and are strongly associated with agricultural products. [2]
http://wwwnc.cdc.gov/eid/article/10/1/pdfs/03-0171.pdf
Summary Data
Meynell G.G. and Meynell E.W. (1958) inoculated albino (PGMS) mice intraperitoneally with the Salmonella typhimurium strains 216 and 219 and challenged albino (Tuck) mice with Salmonella typhimurium strain 533 via the intraperitoneal route. [3]
Recommended Model
Experiment number 246 is recommended model based on the least LD50 value. Although the strains were different and so the virulences, the estimated risk should be in conservative side.
References
- (1988). A review of human salmonellosis: III. Magnitude of Salmonella infection in the United States. Reviews of infectious diseases. 10, 111-124.
- Citekey 1276 not found
- (1958). The growth of micro-organisms in vivo with particular reference to the relation between dose and latent period. The Journal of Hygiene. 56(3),
| ID | # of Doses | Agent Strain | Dose Units | Host type | Μodel | Optimized parameters | Response type | Reference |
|---|---|---|---|---|---|---|---|---|
| 246 | 10 | strain 216 and 219 | CFU | mice | beta-Poisson |
a = 2.1E-01 LD50/ID50 = 4.98E+01 N50 = 4.98E+01 |
death | "The growth of micro-organisms in vivo with particular reference to the relation between dose and latent period." The Journal of Hygiene. 56.3 (1958). |
| 247 | 11 | strain 533 | CFU | mice | beta-Poisson |
a = 6.21E-02 LD50/ID50 = 3.46E+07 N50 = 3.46E+07 |
death | "The growth of micro-organisms in vivo with particular reference to the relation between dose and latent period." The Journal of Hygiene. 56.3 (1958). |
| 248 | 7 | strain 533 | CFU | mice | beta-Poisson |
a = 1.08E-01 LD50/ID50 = 9.66E+06 N50 = 9.66E+06 |
death | "The Broad Street pump revisited: response of volunteers to ingested cholera vibrios." Bulletin of the New York Academy of Medicine. 47 (1971): 10. |
LD50/ID50 = 4.98E+01
N50 = 4.98E+01
|
|
||||||||||||||||||||||
|
||||||||||||||||||||||||||||||

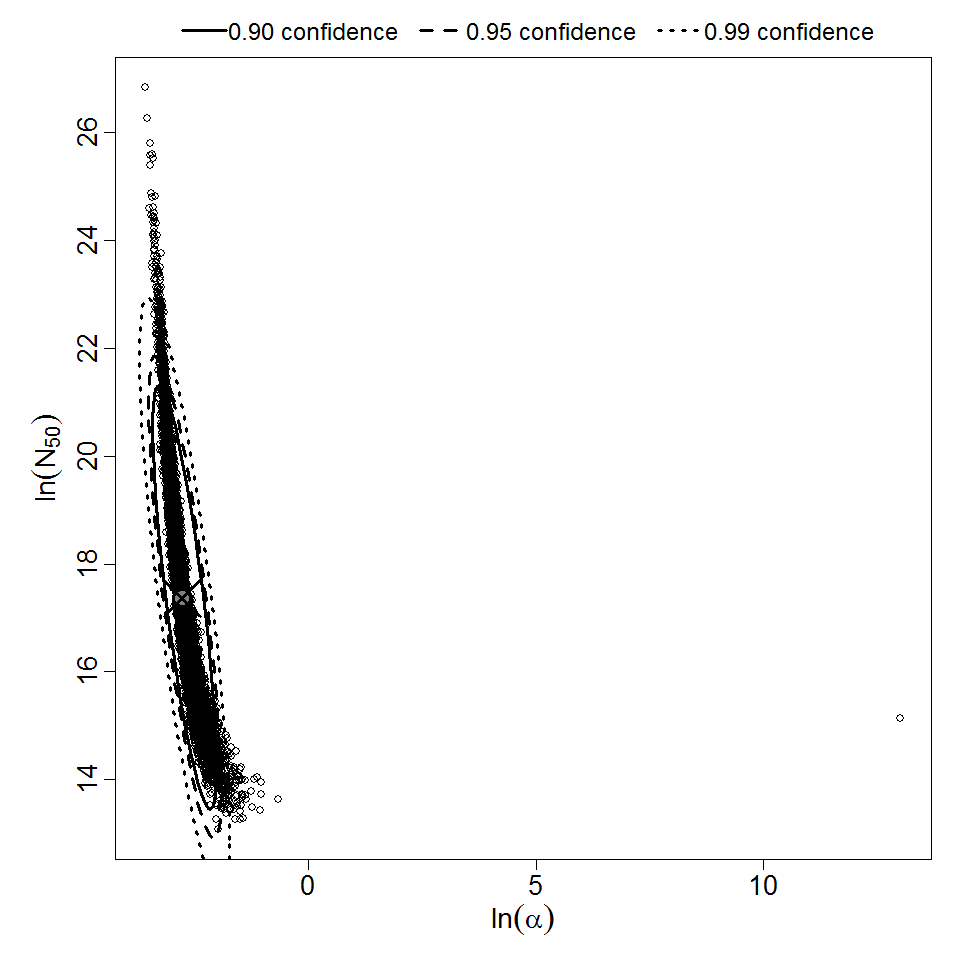
Parameter scatter plot for beta Poisson model ellipses signify the 0.9, 0.95 and 0.99 confidence of the parameters.

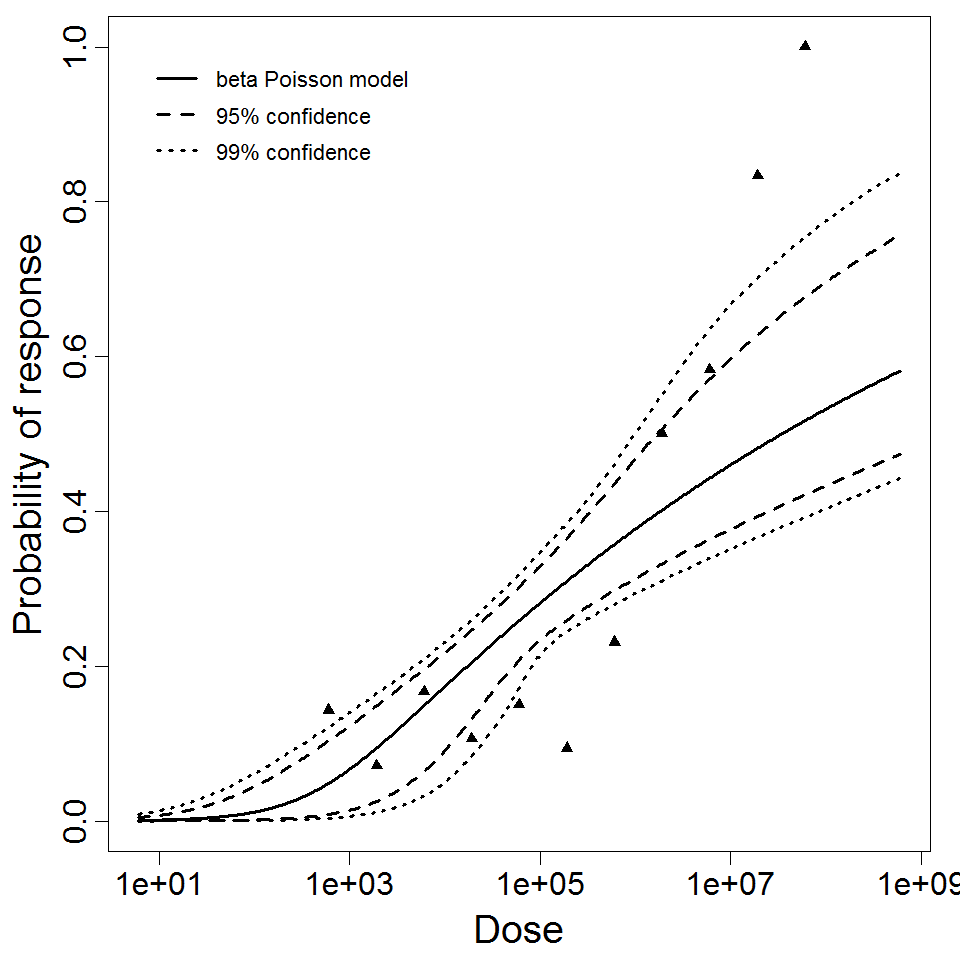
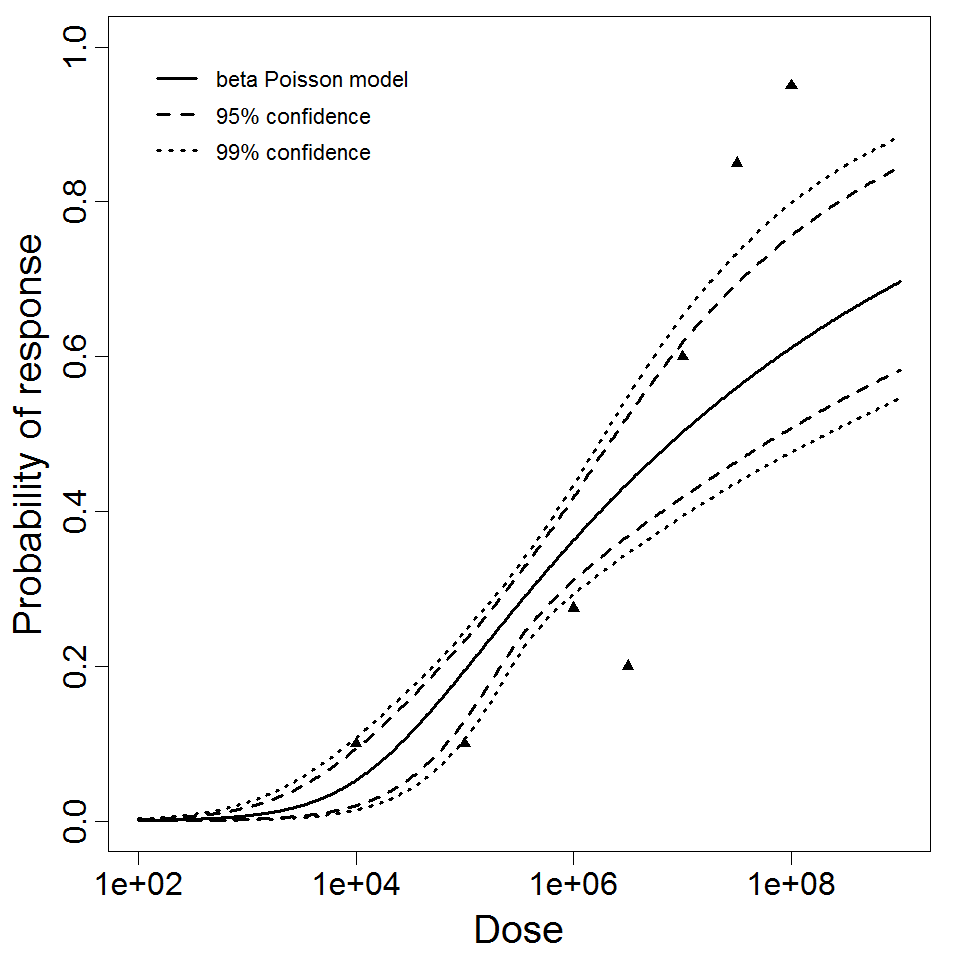
beta Poisson model plot, with confidence bounds around optimized model
References
LD50/ID50 = 3.46E+07
N50 = 3.46E+07
|
|
||||||||||||||||||||||
|
||||||||||||||||||||||||||||||
Parameter scatter plot for beta Poisson model ellipses signify the 0.9, 0.95 and 0.99 confidence of the parameters.
beta Poisson model plot, with confidence bounds around optimized model
References
LD50/ID50 = 9.66E+06
N50 = 9.66E+06
|
|
||||||||||||||||||||||
|
||||||||||||||||||||||||||||||

Parameter scatter plot for beta Poisson model ellipses signify the 0.9, 0.95 and 0.99 confidence of the parameters.
beta Poisson model plot, with confidence bounds around optimized model