Description
|
|
||||||||||||||||||||||
|
||||||||||||||||||||||||||||||||||||||

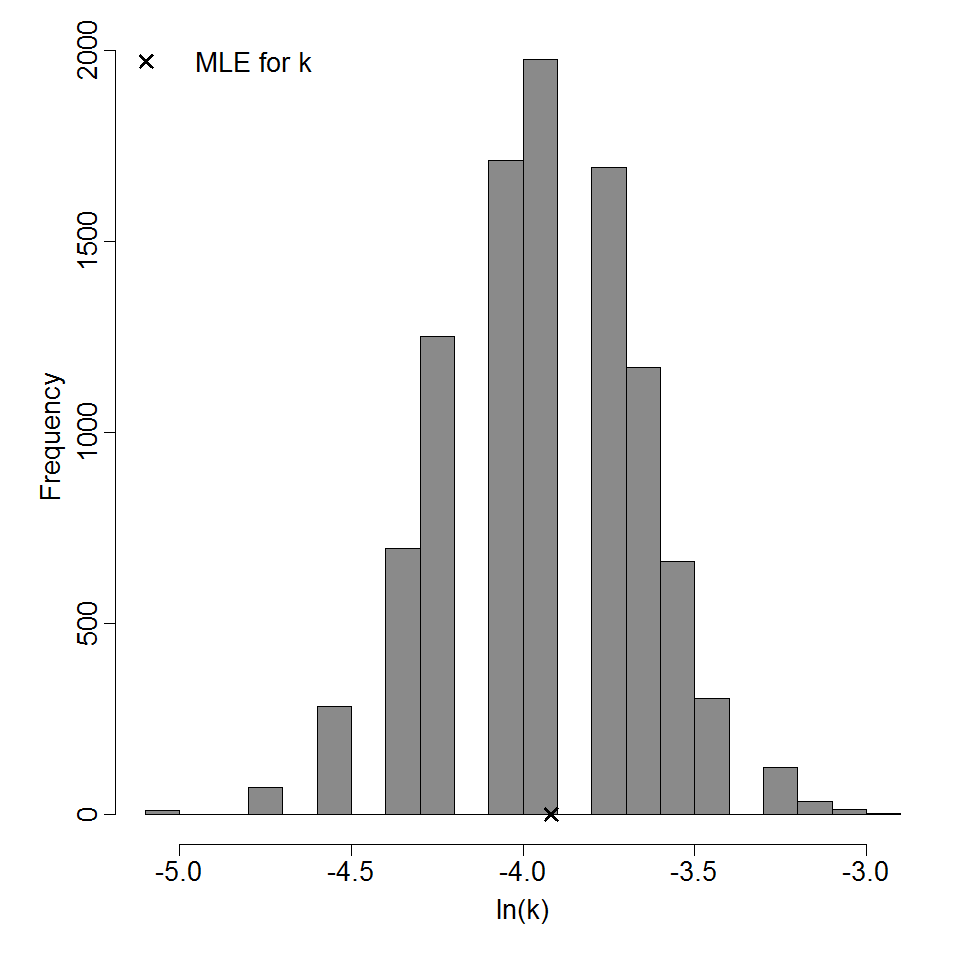
Parameter histogram for exponential model (uncertainty of the parameter)
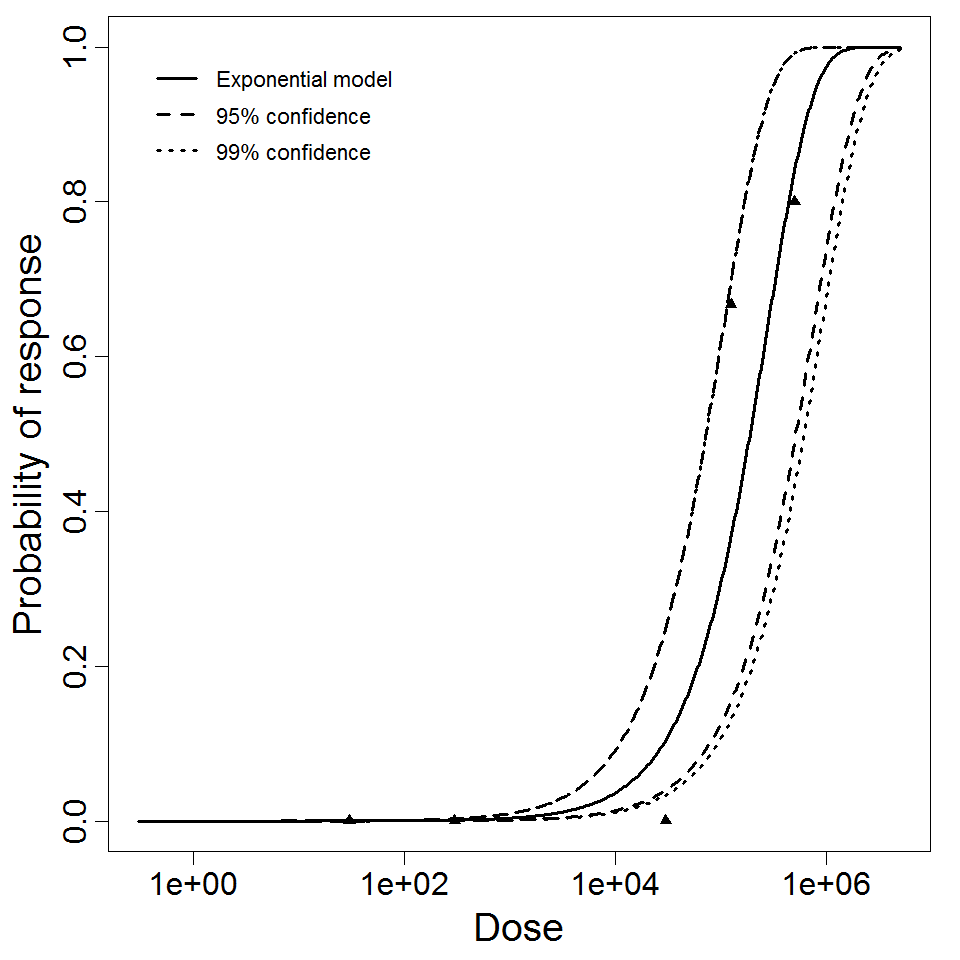
Exponential model plot, with confidence bounds around optimized model
# of Doses
5.00
Μodel
LD50/ID50
1.89E+05
Dose Units
Response
Exposure Route
Contains Preferred Model
k
3.68E-06
Agent Strain
From infected humans
Experiment ID
48
Host type
Description
|
|
||||||||||||||||||||||
|
||||||||||||||||||||||||||||||

Parameter scatter plot for beta Poisson model ellipses signify the 0.9, 0.95 and 0.99 confidence of the parameters.

beta Poisson model plot, with confidence bounds around optimized model
# of Doses
4.00
Μodel
N50
1.46E+04
LD50/ID50
1.46E+04
Dose Units
Response
Exposure Route
Contains Preferred Model
a
1.37E-01
Agent Strain
From infected humans
Experiment ID
47
Host type
Description
|
|
||||||||||||||||||||||
|
||||||||||||||||||||||||||||||||||||||
Parameter histogram for exponential model (uncertainty of the parameter)

Exponential model plot, with confidence bounds around optimized model
# of Doses
8.00
Μodel
LD50/ID50
3.48E+01
Dose Units
Response
Exposure Route
Contains Preferred Model
k
1.99E-02
Agent Strain
From an infected human
Experiment ID
46
Host type
Description
|
|
||||||||||||||||||||||
|
||||||||||||||||||||||||||||||

Parameter scatter plot for beta Poisson model ellipses signify the 0.9, 0.95 and 0.99 confidence of the parameters.

beta Poisson model plot, with confidence bounds around optimized model.
# of Doses
5.00
Μodel
N50
3.41E+02
LD50/ID50
3.41E+02
Dose Units
Response
Exposure Route
Contains Preferred Model
a
1.01E-01
Agent Strain
From an infected human
Experiment ID
45
Host type