Badenoch et al. (1990) studied the combined effect of Acanthamoeba Ac118 (a group III isolate) and the bacterium Corynebacterium xerosis on the corneas of female Portion rats. A constant dose of 106 C. xerosis with increasing doses of Acanthamoeba spp. were injected into incisions in the rat corneas using a microsyringe.
The exponential model provided the best fit to the data.
| Dose (no. of organisms) | Positive Response | Negative Response | Total Subjects/Responses | |
|---|---|---|---|---|
| 10 | 0 | 8 | 8 | |
| 100 | 0 | 16 | 16 | |
| 1000 | 7 | 17 | 24 | |
| 10000 | 10 | 0 | 10 |
| Model | Deviance | Δ | Degrees of freedom |
χ20.95,1 p-value |
χ20.95,m-k p-value |
| Exponential | 9.88 | 6.48 | 5 | 3.84 0.011 |
11.1 0.0788 |
| beta Poisson | 3.4 | 4 | 9.49 0.494 |
||
| beta-Poisson fits better than exponential; can not reject good fit for beta-Poisson | |||||
| Parameter | MLE Estimate | 0.5% | 2.5% | 5% | 95% | 97.5% | 99.5% |
| α | 6.95E-01 | 2.69E-01 | 3.39E-01 | 3.78E-01 | 2.56E+0 | 2.28E+01 | 1.18E+03 |
| N50 | 3.39E+03 | 3.58E+01 | 2.47E+02 | 4.67E+02 | 1.09E+04 | 1.26E+04 | 1.85E+04 |
| Dose (CFU) | Infected | Non-Infected | Total |
|---|---|---|---|
| 5500 | 7 | 3 | 10 |
| 32400 | 7 | 3 | 10 |
| 55000 | 9 | 1 | 10 |
| 251000 | 10 | 0 | 10 |
| 550000 | 10 | 0 | 10 |
| 2820000 | 10 | 0 | 10 |
|
|
||||||||||||||||||||||
|
||||||||||||||||||||||||||||||
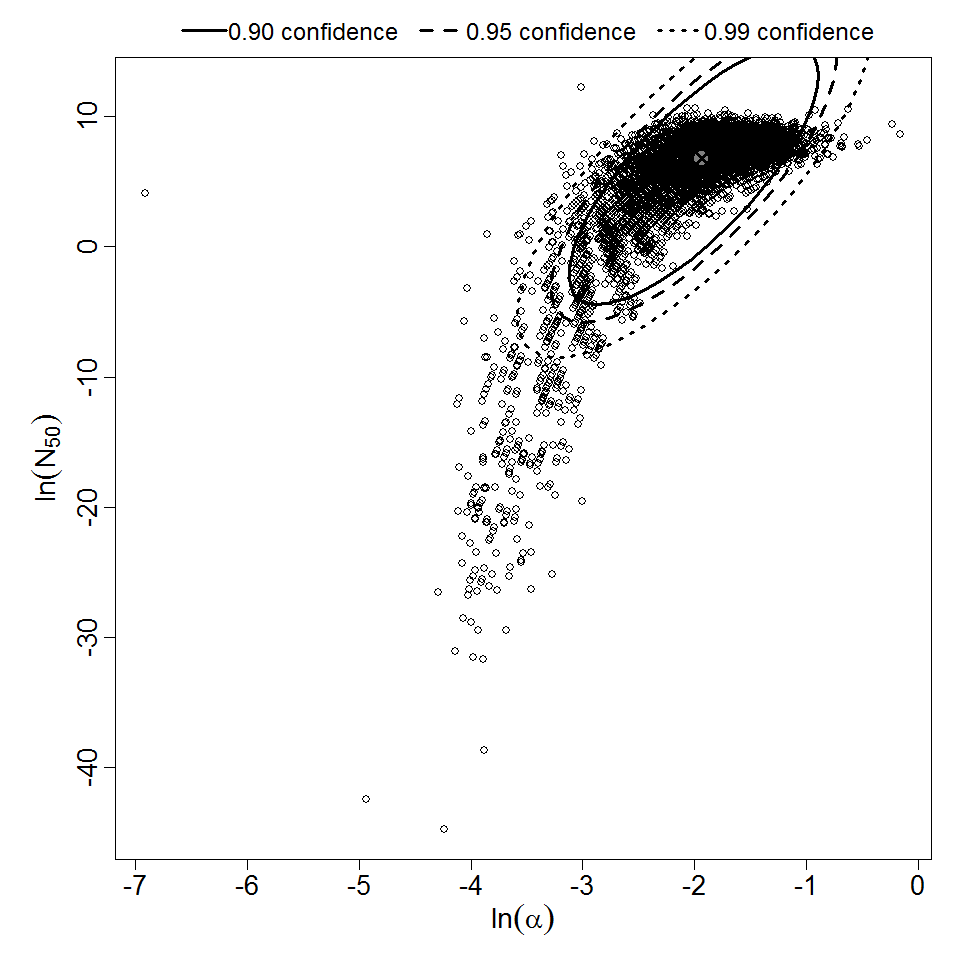
Parameter scatter plot for beta Poisson model ellipses signify the 0.9, 0.95 and 0.99 confidence of the parameters.
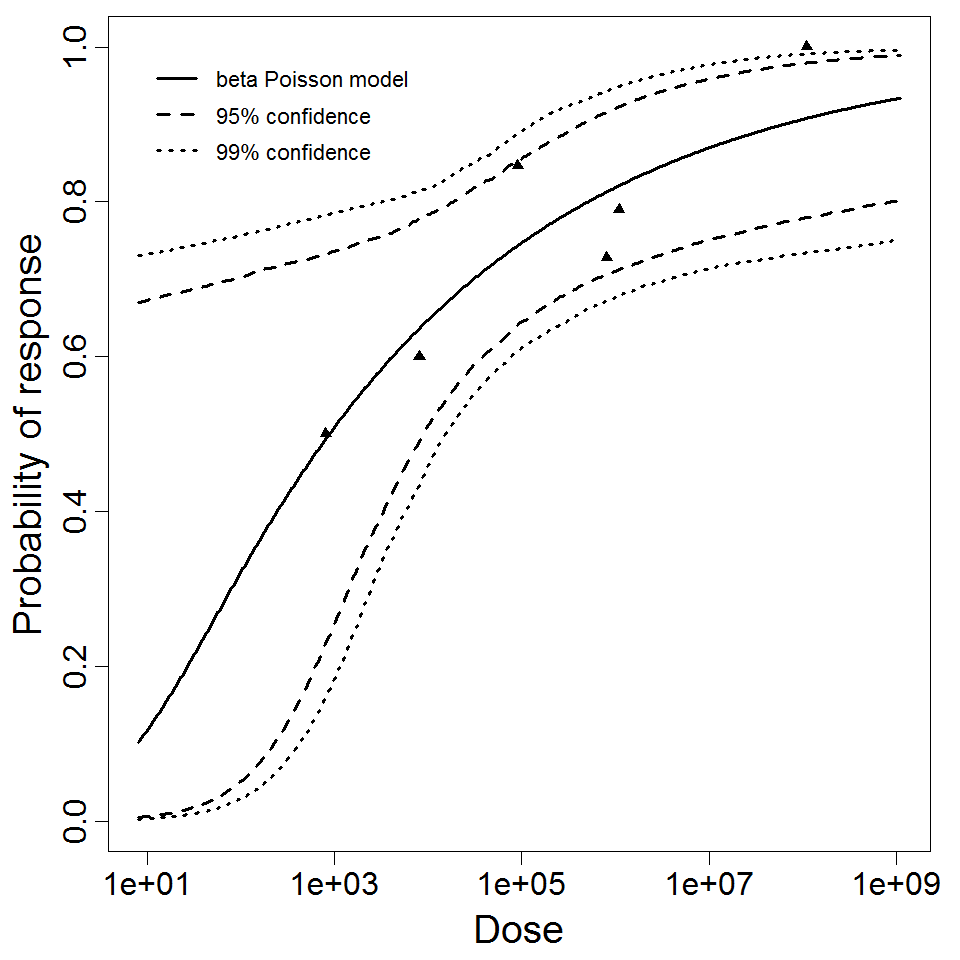
beta Poisson model plot, with confidence bounds around optimized model
|
|
||||||||||||||||||||||
|
||||||||||||||||||||||||||||||
Parameter scatter plot for beta Poisson model ellipses signify the 0.9, 0.95 and 0.99 confidence of the parameters.
beta Poisson model plot, with confidence bounds around optimized model
|
|
||||||||||||||||||||||
|
||||||||||||||||||||||||||||||||||||||
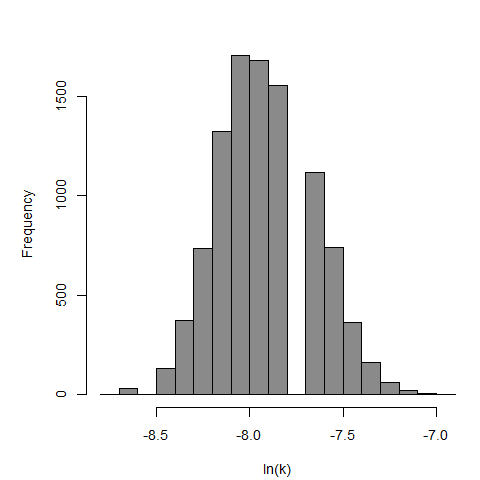
Parameter histogram for exponential model (uncertainty of the parameter)
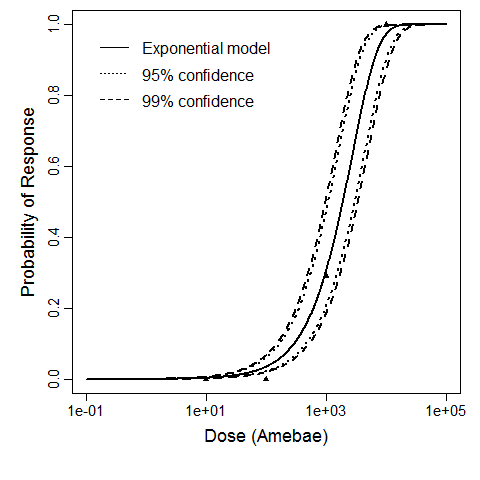
Exponential model plot, with confidence bounds around optimized model
|
|
||||||||||||||||||||||
|
||||||||||||||||||||||||||||||
Parameter scatter plot for beta Poisson model ellipses signify the 0.9, 0.95 and 0.99 confidence of the parameters.
beta Poisson model plot, with confidence bounds around optimized model
Badenoch et al. (1990) studied the combined effect of Acanthamoeba Ac118 (a group III isolate) and the bacterium Corynebacterium xerosis on the corneas of female Porton rats. A constant dose of 104 C. xerosis with increasing doses of Acanthamoeba spp. were injected into incisions in the rat corneas using a microsyringe (Badenoch et al. 1990).
The exponential model provided the best fit to the data.


| Dose (no. of organisms) | Positive Responses | Negative Responses | Total Subjects/Responses | |
|---|---|---|---|---|
| 10 | 0 | 8 | 8 | |
| 100 | 0 | 16 | 16 | |
| 1000 | 2 | 16 | 18 | |
| 10000 | 5 | 3 | 8 |
|
||||||||||||||||||||||
|
||||||||||||||||||||||||||||||||||||||
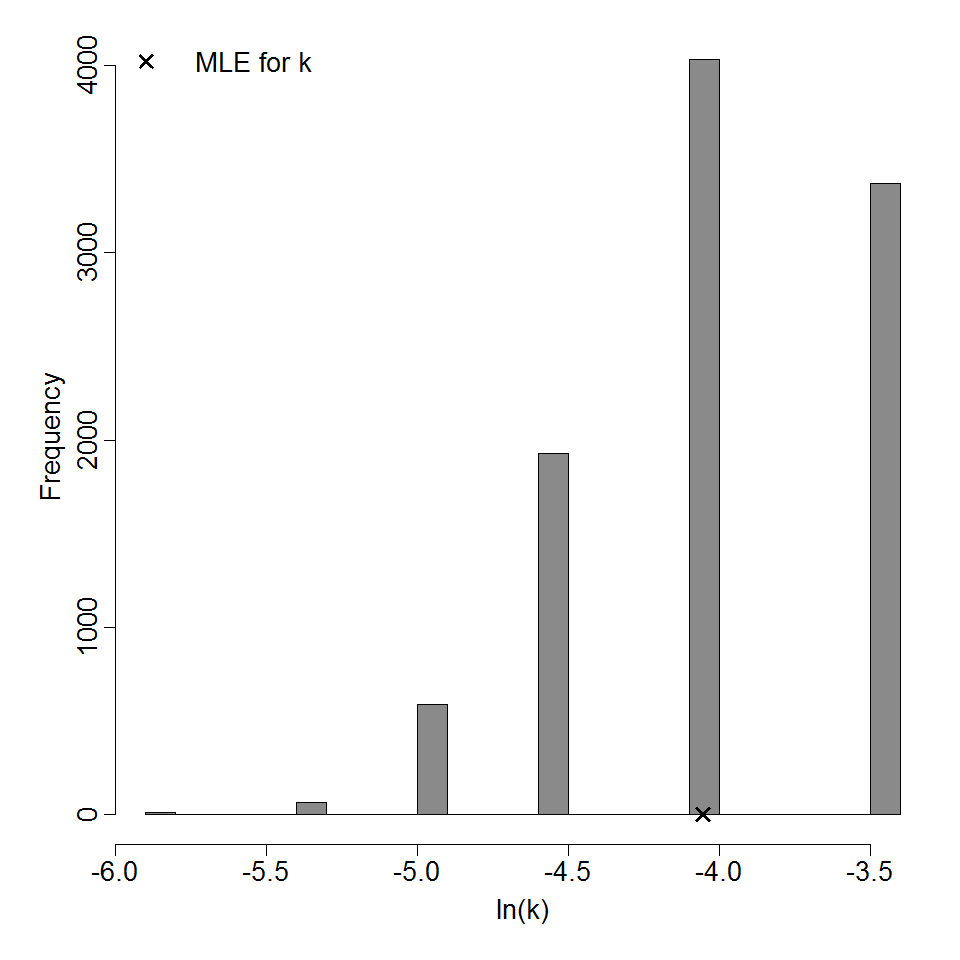
Parameter histogram for exponential model (uncertainty of the parameter)
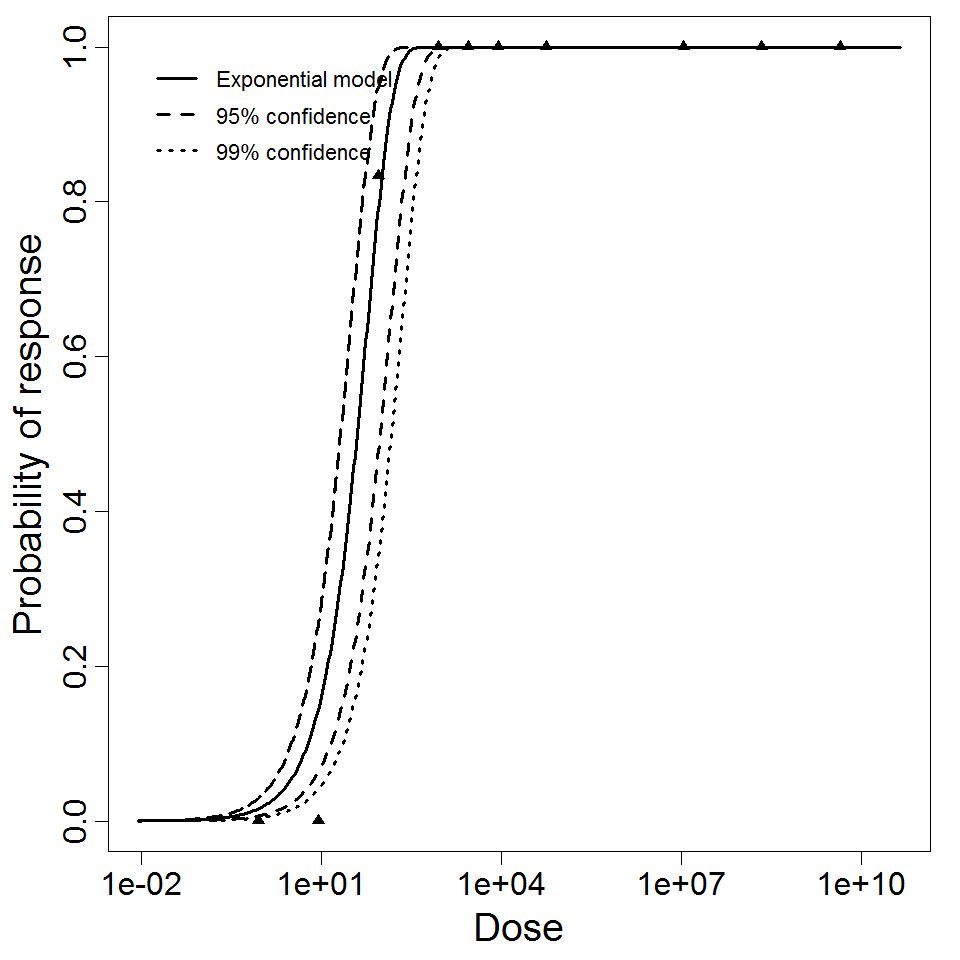
Exponential model plot, with confidence bounds around optimized model
|
|
||||||||||||||||||||||
|
||||||||||||||||||||||||||||||
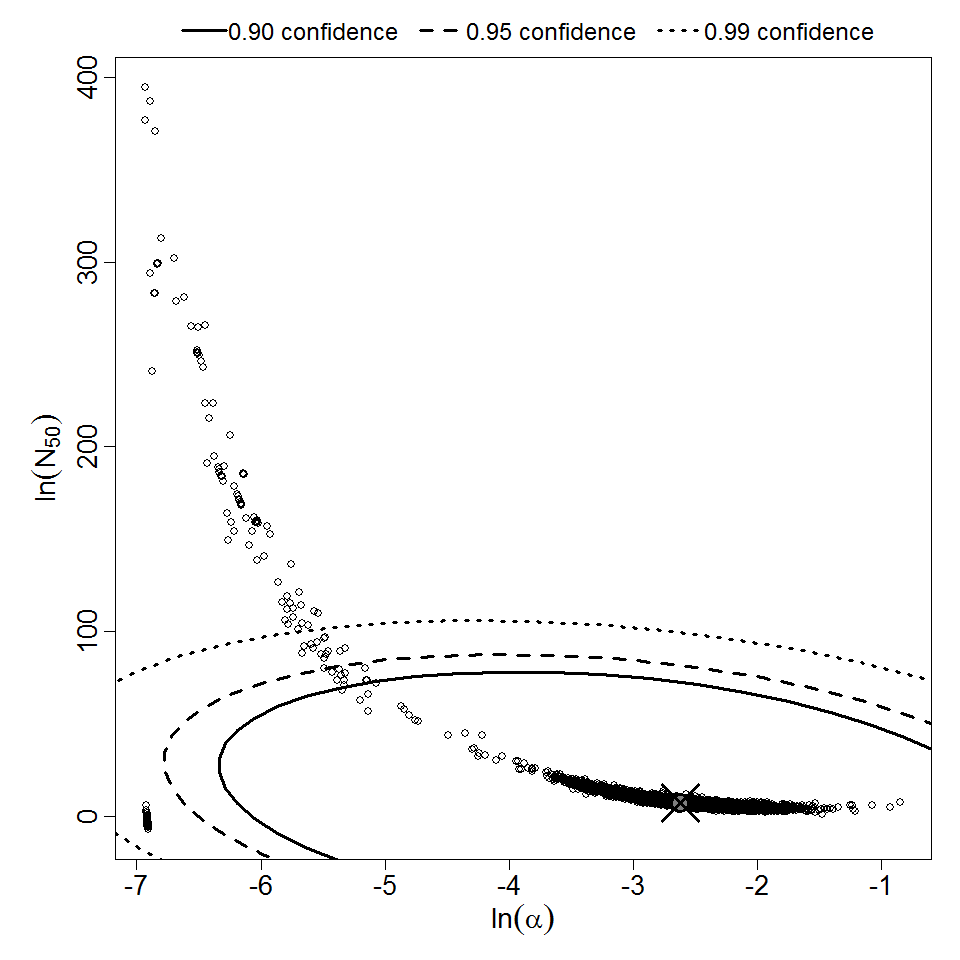
Parameter scatter plot for beta Poisson model ellipses signify the 0.9, 0.95 and 0.99 confidence of the parameters.
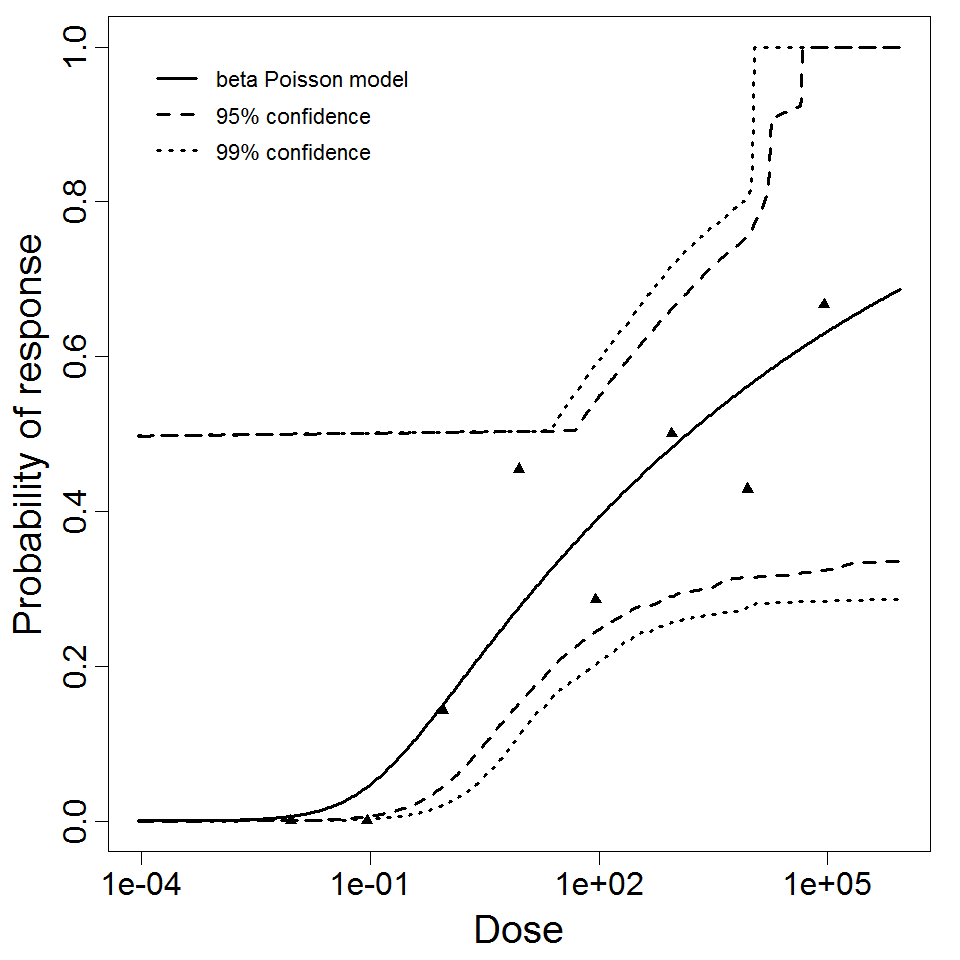
beta Poisson model plot, with confidence bounds around optimized model
|
|
||||||||||||||||||||||
|
||||||||||||||||||||||||||||||

Parameter scatter plot for beta Poisson model ellipses signify the 0.9, 0.95 and 0.99 confidence of the parameters.

beta Poisson model plot, with confidence bounds around optimized model