Campylobacter jejuni and Campylobacter coli: Dose Response Models
| ID | Exposure Route | # of Doses | Agent Strain | Dose Units | Host type | Μodel | LD50/ID50 | Optimized parameters | Response type | Reference |
|---|---|---|---|---|---|---|---|---|---|---|
| 184 | intragastric | 5.00 | type strain for serotype PEN 1 | CFU | mice | exponential | 7.69E+05 | k = 9.01E-07 | infection |
Blaser, M. J., Duncan, D. J., Warren, G. H., & W-ll, W. . (1983). Experimental Campylobacter jejuni Infection of Adult Mice. Infection and Immunity, 39, 2. |
| 185 | intragastric | 5.00 | type strain for serotype PEN 2 | CFU | mice | beta-Poisson | 6.68E+04 | a = 3.19E-01 N50 = 6.68E+04 | infection |
Blaser, M. J., Duncan, D. J., Warren, G. H., & W-ll, W. . (1983). Experimental Campylobacter jejuni Infection of Adult Mice. Infection and Immunity, 39, 2. |
| 186 | intragastric | 5.00 | type strain for serotype PEN 3 | CFU | mice | beta-Poisson | 3.14E+04 | a = 1.17E-01 N50 = 3.14E+04 | infection |
Blaser, M. J., Duncan, D. J., Warren, G. H., & W-ll, W. . (1983). Experimental Campylobacter jejuni Infection of Adult Mice. Infection and Immunity, 39, 2. |
Exposure Route:
intragastric
# of Doses:
5.00
Agent Strain:
type strain for serotype PEN 1
Dose Units:
CFU
Host type:
mice
Μodel:
exponential
LD50/ID50:
7.69E+05
Optimized parameters:
k = 9.01E-07
Response type:
infection
|
|
||||||||||||||||||||||
|
||||||||||||||||||||||||||||||||||||||
Parameter histogram for exponential model (uncertainty of the parameter)
Exponential model plot, with confidence bounds around optimized model
Exposure Route:
intragastric
# of Doses:
5.00
Agent Strain:
type strain for serotype PEN 2
Dose Units:
CFU
Host type:
mice
Μodel:
beta-Poisson
LD50/ID50:
6.68E+04
Optimized parameters:
a = 3.19E-01
N50 = 6.68E+04
Response type:
infection
|
|
||||||||||||||||||||||
|
||||||||||||||||||||||||||||||
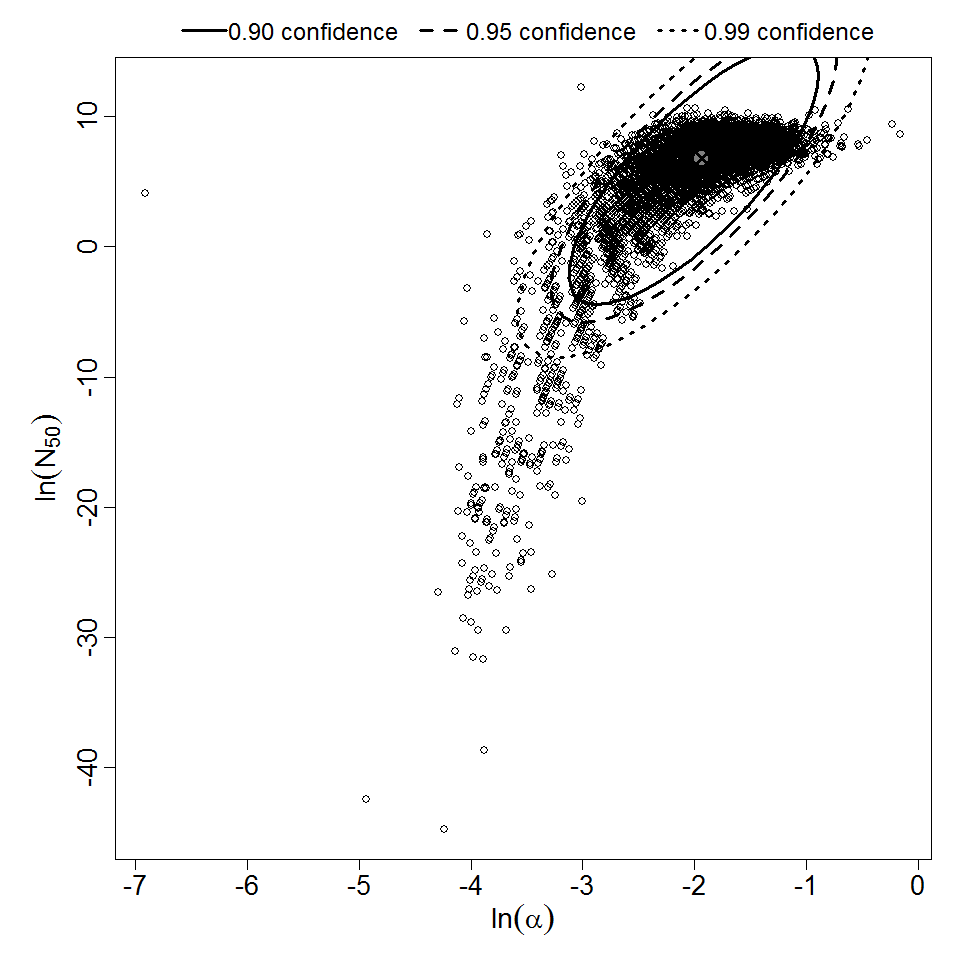
Parameter scatter plot for beta Poisson model ellipses signify the 0.9, 0.95 and 0.99 confidence of the parameters.
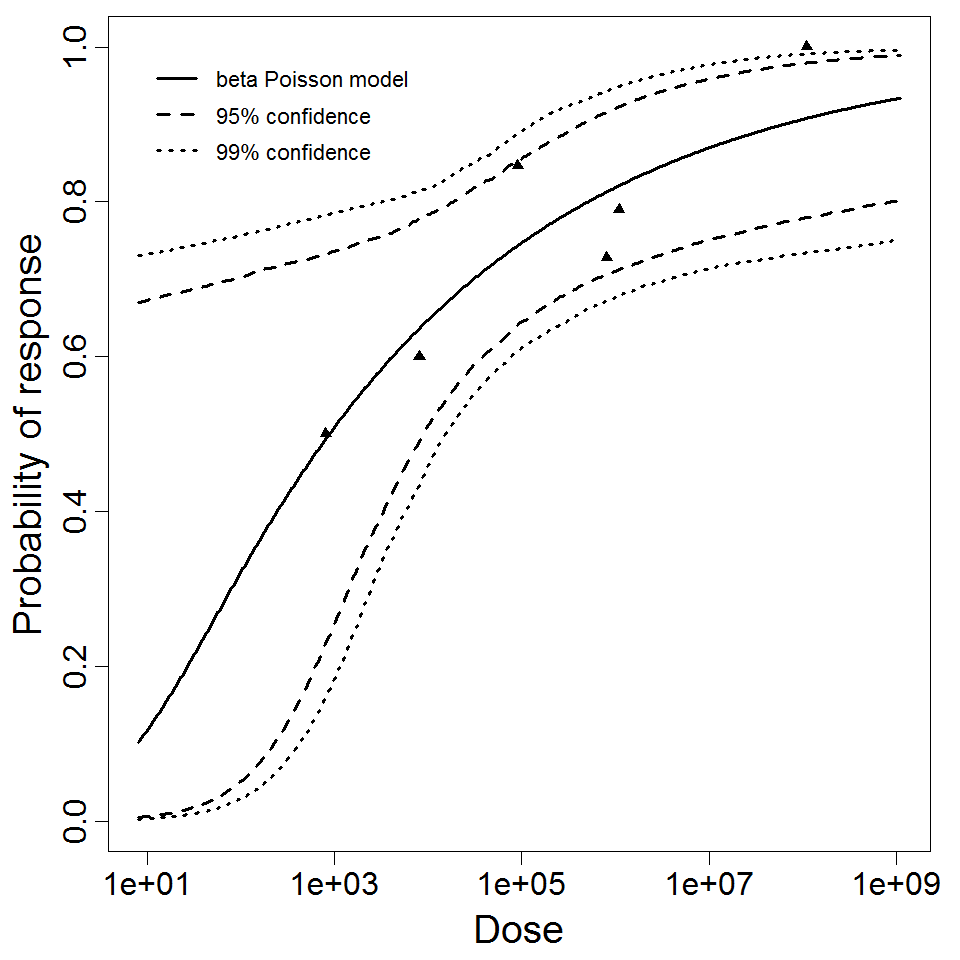
beta Poisson model plot, with confidence bounds around optimized model
Exposure Route:
intragastric
# of Doses:
5.00
Agent Strain:
type strain for serotype PEN 3
Dose Units:
CFU
Host type:
mice
Μodel:
beta-Poisson
LD50/ID50:
3.14E+04
Optimized parameters:
a = 1.17E-01
N50 = 3.14E+04
Response type:
infection
|
|
||||||||||||||||||||||
|
||||||||||||||||||||||||||||||
Parameter scatter plot for beta Poisson model ellipses signify the 0.9, 0.95 and 0.99 confidence of the parameters.
beta Poisson model plot, with confidence bounds around optimized model
Description
|
||||||||||||||||||||||
|
||||||||||||||||||||||||||||||||||||||
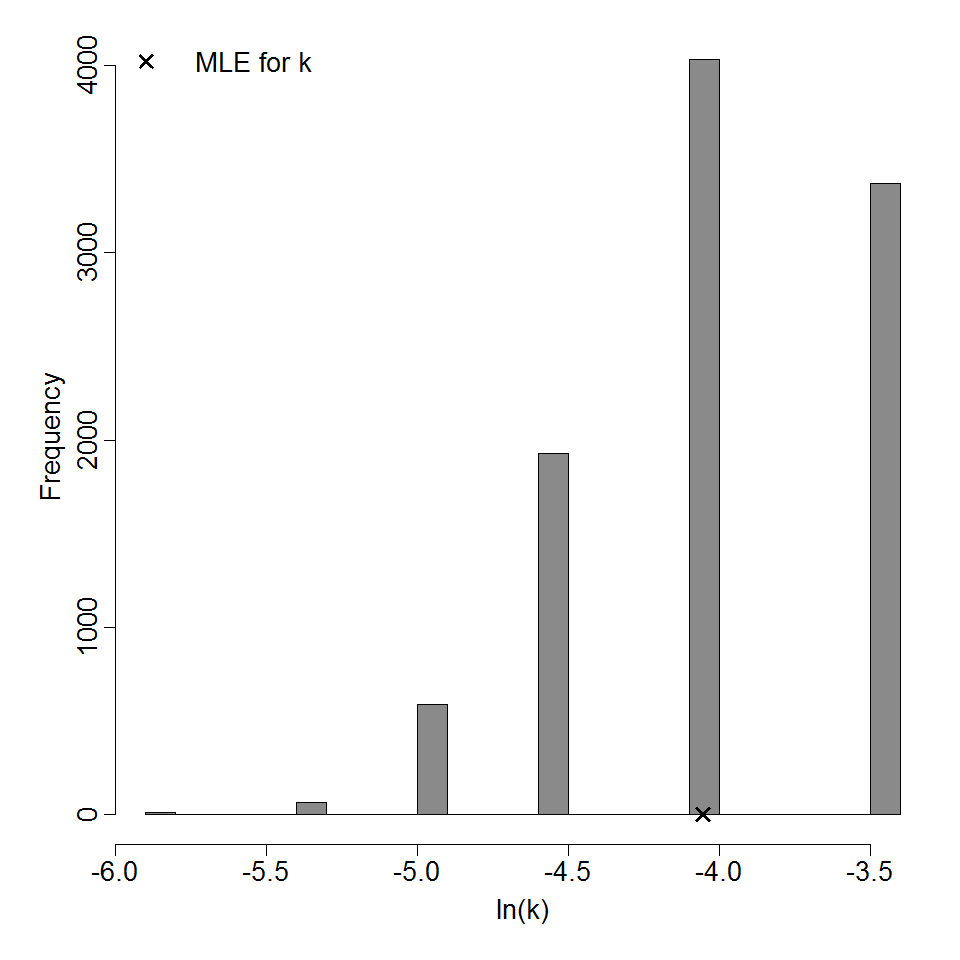
Parameter histogram for exponential model (uncertainty of the parameter)
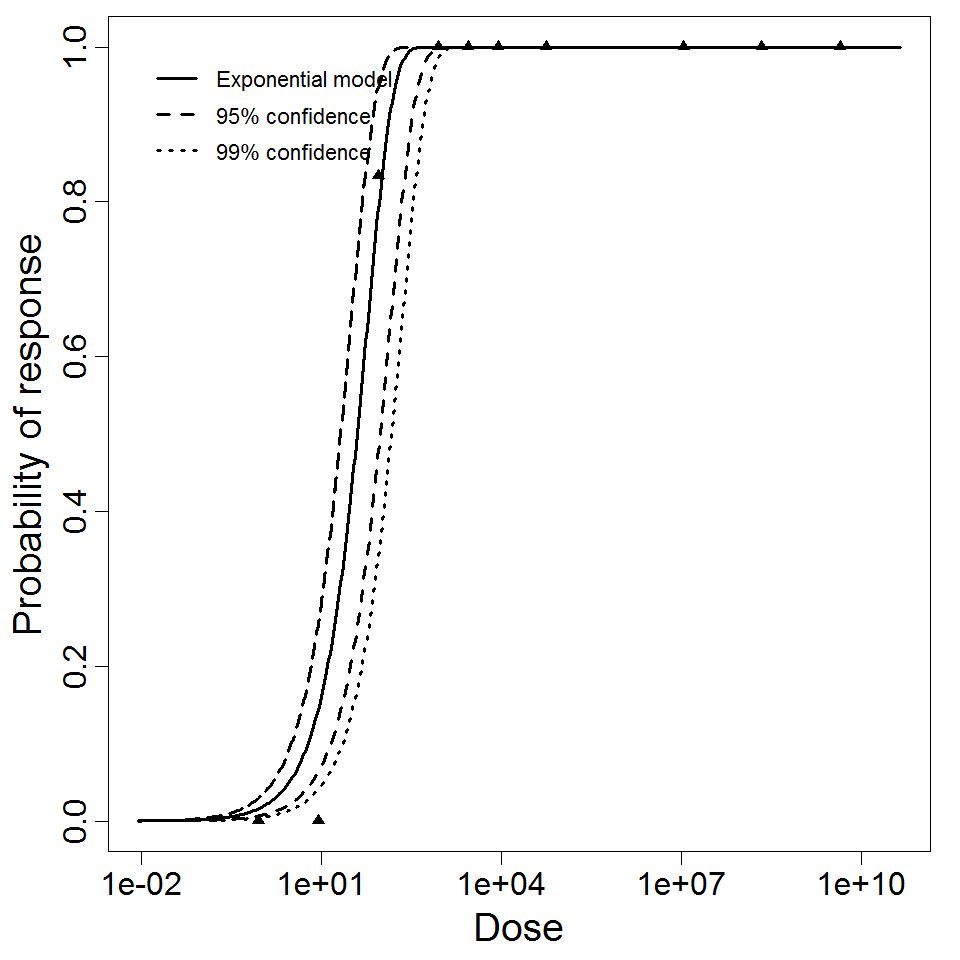
Exponential model plot, with confidence bounds around optimized model
# of Doses
10.00
Μodel
LD50/ID50
4E+01
Dose Units
Response
Exposure Route
Contains Preferred Model
k
1.73E-02
Agent Strain
OSU (ATCC VR892)
Experiment ID
68
Host type