Červa (1967a,b) studied white mice of the Czechoslovak H-strain weighing 13-15 grams inoculated intranasally by placing 0.02 mL of the A1 strain of Acanthamoeba over the nares of the ethyl-ether anesthetized mice (Cerva, 1967b).
The beta-Poisson model provided the best fit to the data.
Cerva, L. (1967b). Intranasal, Intrapulmonary, and Intracardial Inoculation of Experimental Animals with Hartmanella castellanii. Folia Parasitologica (Praha), 14, 207–215.
| Dose (no. of organisms) | Positive Response | Negative Response | Total Subjects/Responses |
|---|---|---|---|
| 3 | 0 | 20 | 20 |
| 30 | 2 | 18 | 20 |
| 300 | 1 | 19 | 20 |
| 3000 | 9 | 11 | 20 |
Culbertson et al. (1966) studied the pathogenicity of the HN-3 strain of A. castellanii (Culbertson et al., 1966; Marciano-Cabral & Cabral, 2003) on ether-anesthetized-specific-pathogen-free (SPF) mice. Cultures of amebae were grown in trypticase soy broth and diluted so that 0.03 mL of a concentrated suspension could be instilled intranasally into the mice by placing fluid over the nares (Culbertson et al., 1966; Culbertson, Ensminger, & Overton, 1965a; Culbertson, Ensminger, & Overton, 1965b).
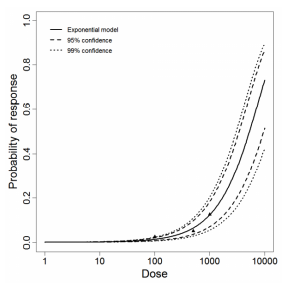
The exponential model provided the best fit to the data.


Culbertson, C. G., Ensminger, P. W., & Overton, W. M. (1966). Hartmannella (Acanthamoeba): Experimental Chronic, Granulomatous Brain Infections Produced by New Isolates of Low Virulence. The American Journal of Clinical Pathology, 46(3), 305–314.
| Dose (no. of organisms) | Positive Response | Negative Response | Total Subjects/Responses |
|---|---|---|---|
| 100 | 2 | 78 | 80 |
| 500 | 9 | 71 | 80 |
| 1000 | 21 | 59 | 80 |
Culbertson et al. (1966) studied the pathogenicity of the HN-3 strain of A. castellanii (Culbertson et al., 1966; Marciano-Cabral & Cabral, 2003) on ether-anesthetized-specific-pathogen-free (SPF) mice. Cultures of amebae were grown in trypticase soy broth and diluted so that 0.03 mL of a concentrated suspension could be instilled intranasally into the mice by placing fluid over the nares (Culbertson et al., 1966; Culbertson, Ensminger, & Overton, 1965a; Culbertson, Ensminger, & Overton, 1965b).
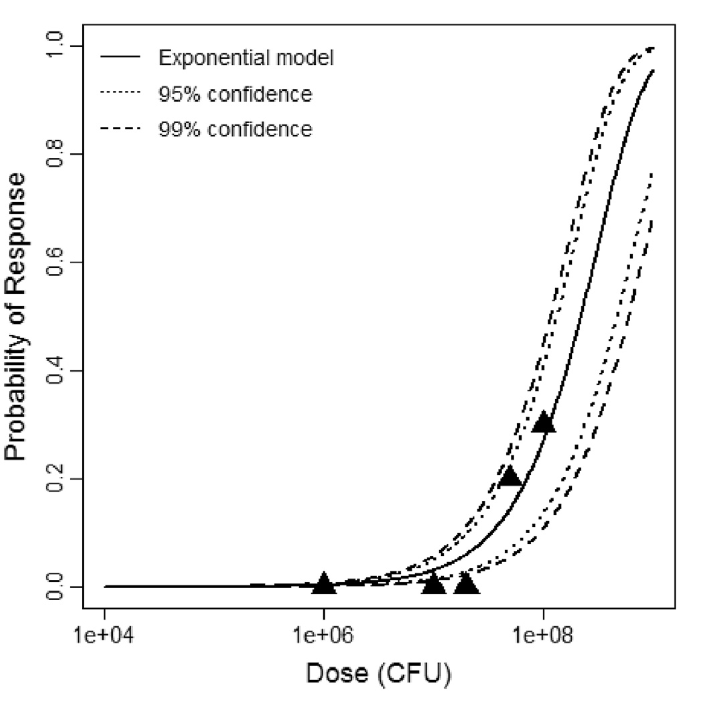
The exponential model provided the best fit to the data.

Culbertson, C. G., Holmes, D. H., & Overton, W. M. (1965b). Hartmanella castellani (Acanthamoeba sp.). The American Journal of Clinical Pathology, 43(4), 361–364.
Culbertson, C. G., Ensminger, P. W., & Overton, W. M. (1966). Hartmannella (Acanthamoeba): Experimental Chronic, Granulomatous Brain Infections Produced by New Isolates of Low Virulence. The American Journal of Clinical Pathology, 46(3), 305–314.
| Dose (no. of organisms) | Positive Response | Negative Response | Total Subjects/Responses |
|---|---|---|---|
| 100 | 7 | 73 | 80 |
| 500 | 31 | 49 | 80 |
| 1000 | 43 | 37 | 80 |
Culbertson et al. (1966) studied the pathogenicity of the HN-3 strain of A. castellanii (Culbertson et al., 1966; Marciano-Cabral & Cabral, 2003) on ether-anesthetized-specific-pathogen-free (SPF) mice. Cultures of amebae were grown in trypticase soy broth and diluted so that 0.03 mL of a concentrated suspension could be instilled intranasally into the mice by placing fluid over the nares (Culbertson et al., 1966; Culbertson, Ensminger, & Overton, 1965a; Culbertson, Ensminger, & Overton, 1965b).
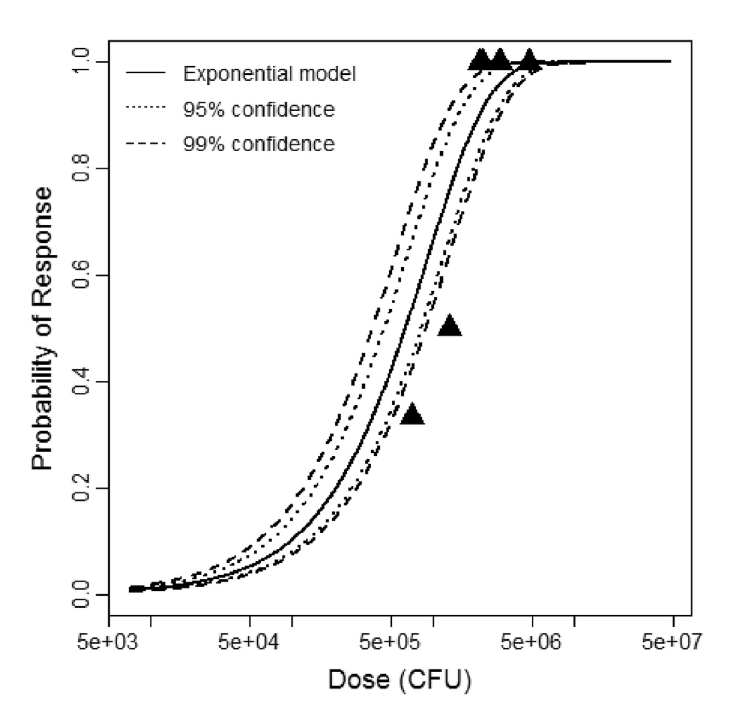
The exponential model provided the best fit to the data.

Culbertson, C. G., Holmes, D. H., & Overton, W. M. (1965b). Hartmanella castellani (Acanthamoeba sp.). The American Journal of Clinical Pathology, 43(4), 361–364.
Culbertson, C. G., Ensminger, P. W., & Overton, W. M. (1966). Hartmannella (Acanthamoeba): Experimental Chronic, Granulomatous Brain Infections Produced by New Isolates of Low Virulence. The American Journal of Clinical Pathology, 46(3), 305–314.
| Dose (no. of organsims) | Positive Responses | Negative Responses | Total Subjects/Responses |
|---|---|---|---|
| 100 | 2 | 78 | 80 |
| 500 | 4 | 76 | 80 |
| 1000 | 10 | 70 | 80 |
|
|
||||||||||||||||||||||
|
||||||||||||||||||||||||||||||
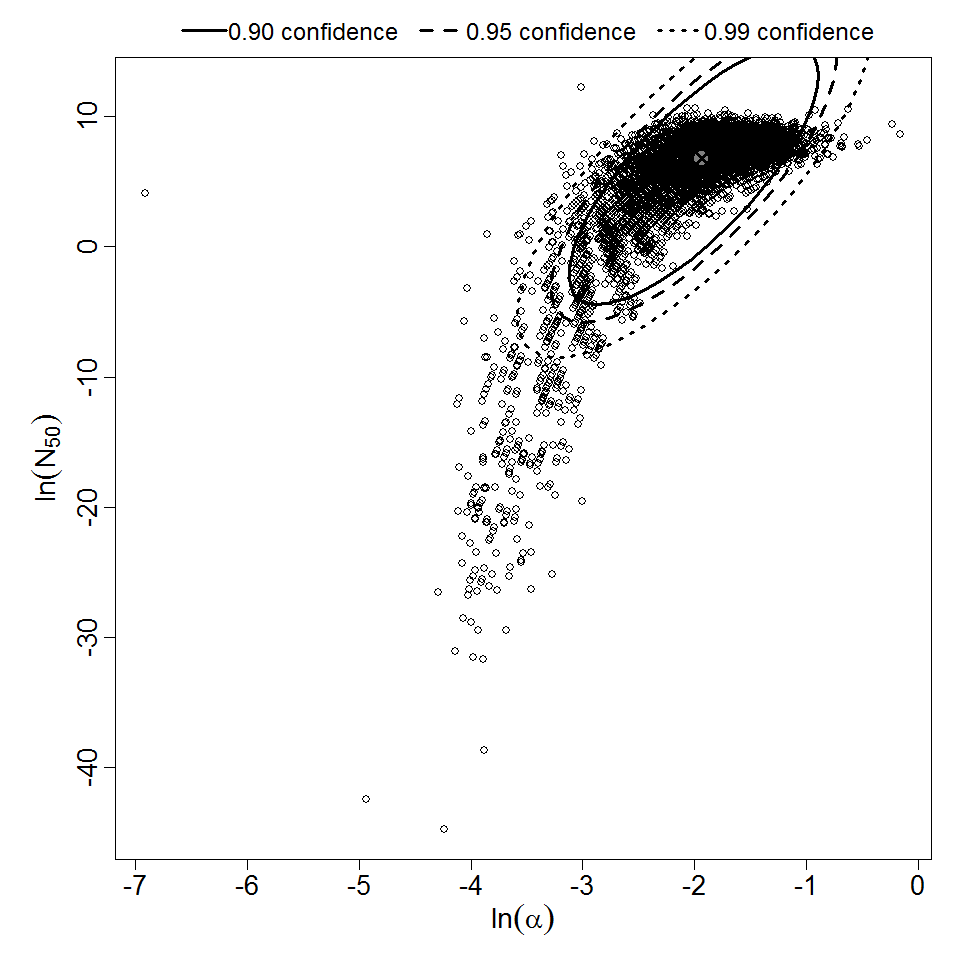
Parameter scatter plot for beta Poisson model ellipses signify the 0.9, 0.95 and 0.99 confidence of the parameters.
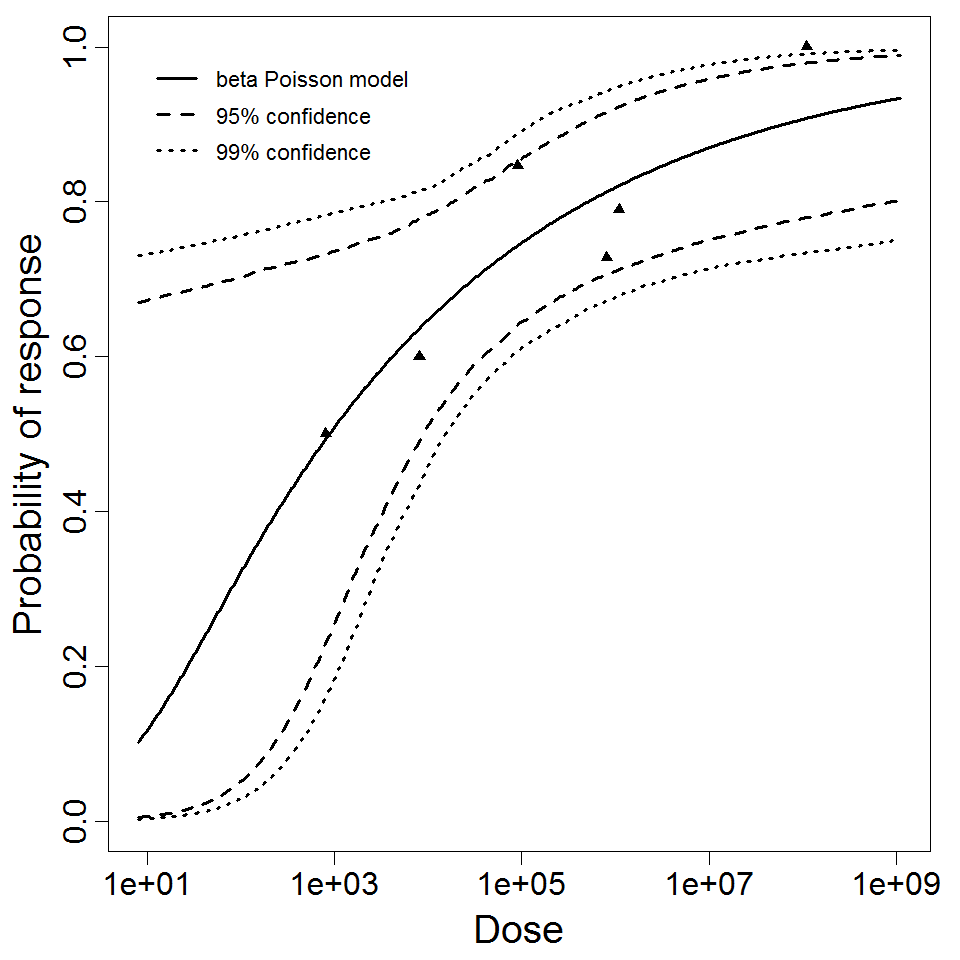
beta Poisson model plot, with confidence bounds around optimized model
|
|
||||||||||||||||||||||
|
||||||||||||||||||||||||||||||
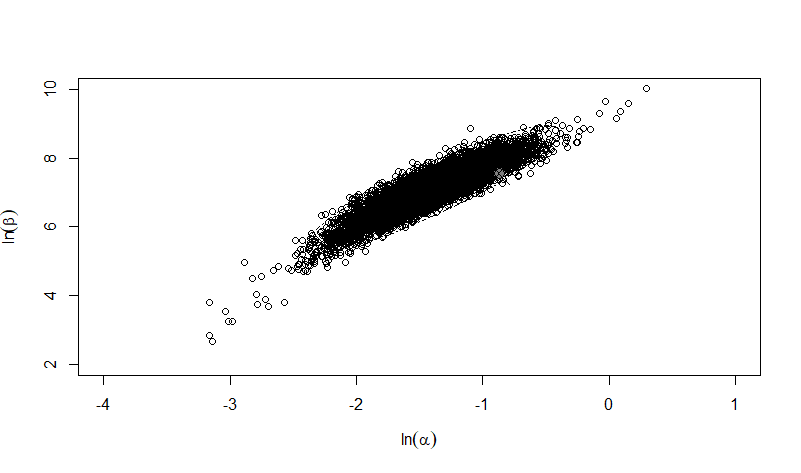
Parameter scatter plot for beta Poisson model ellipses signify the 0.9, 0.95 and 0.99 confidence of the parameters.
beta Poisson model plot, with confidence bounds around optimized model
|
|
||||||||||||||||||||||
|
||||||||||||||||||||||||||||||||||||||
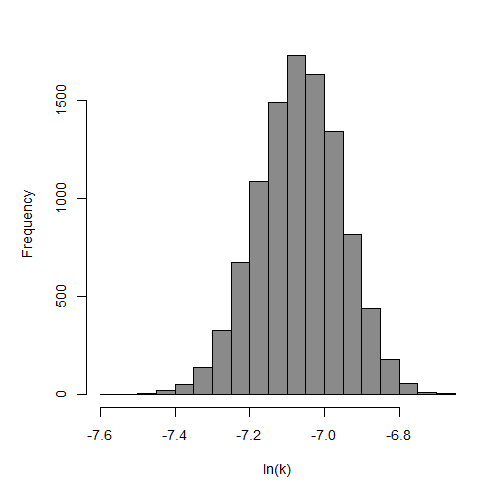
Parameter histogram for exponential model (uncertainty of the parameter)
Exponential model plot, with confidence bounds around optimized model
The same exposure route and endpoint was evaluated for Experiments 3 and 4 (Cerva, 1967b; Culbertson et al. 1966)[6] [5]. A pooling analysis was attempted and successful. The beta-Poisson model provided a good fit to the pooled data and is shown below in Figure 1. Note: both the exact and approximate beta-Poisson models were fit to the data. The figures shown below and the csv file of bootstrapped parameter replicates are for the best fitting parameters of the exact beta-Poisson model. The successful pooling of multiple datasets generally increases the confidence in the estimated model parameters.
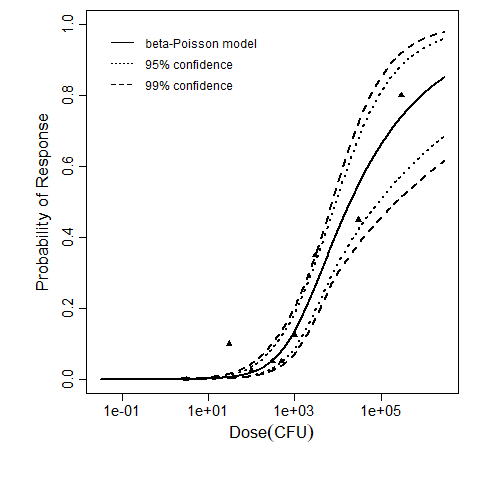
[6] Cerva, L. (1967b). Intranasal, Intrapulmonary, and Intracardial Inoculation of Experimental Animals with Hartmanella castellanii. Folia Parasitologica (Praha), 14, 207–215.
[5] Culbertson, C. G., Ensminger, P. W., & Overton, W. M. (1966). Hartmannella (Acanthamoeba): Experimental Chronic, Granulomatous Brain Infections Produced by New Isolates of Low Virulence. The American Journal of Clinical Pathology, 46(3), 305–314.