Description
|
|
||||||||||||||||||||||
|
||||||||||||||||||||||||||||||
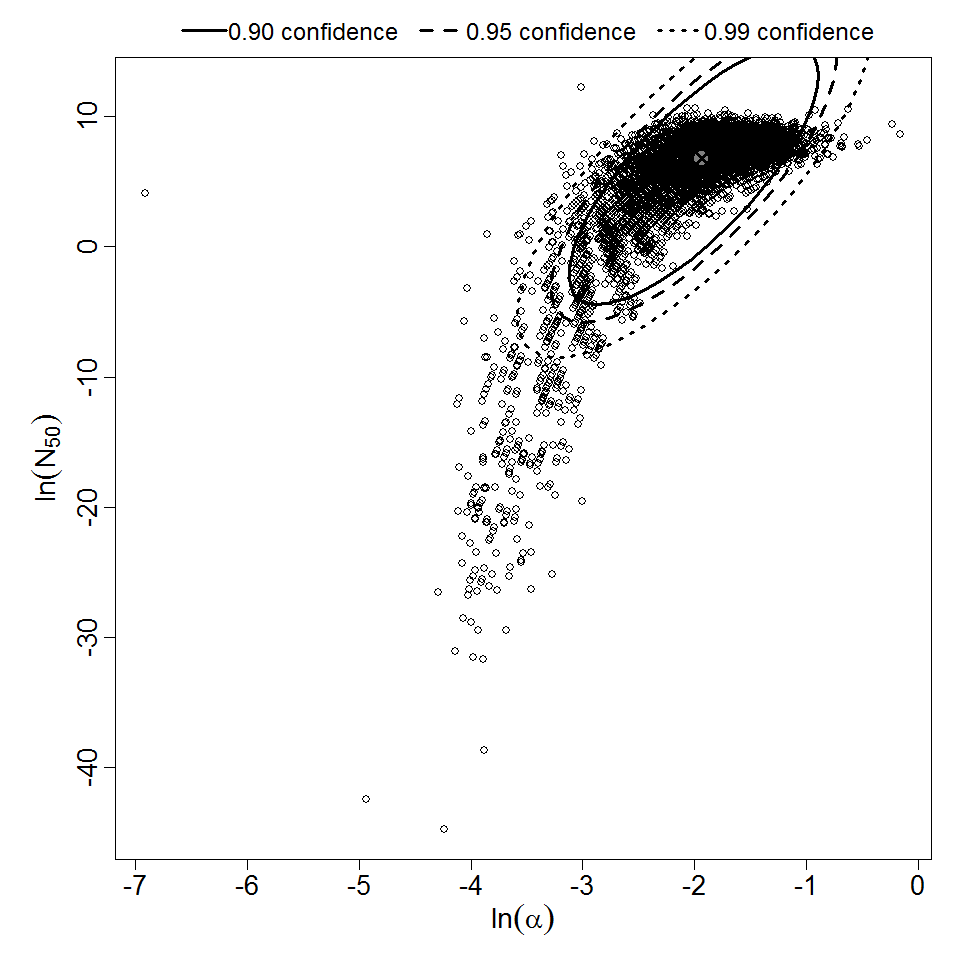
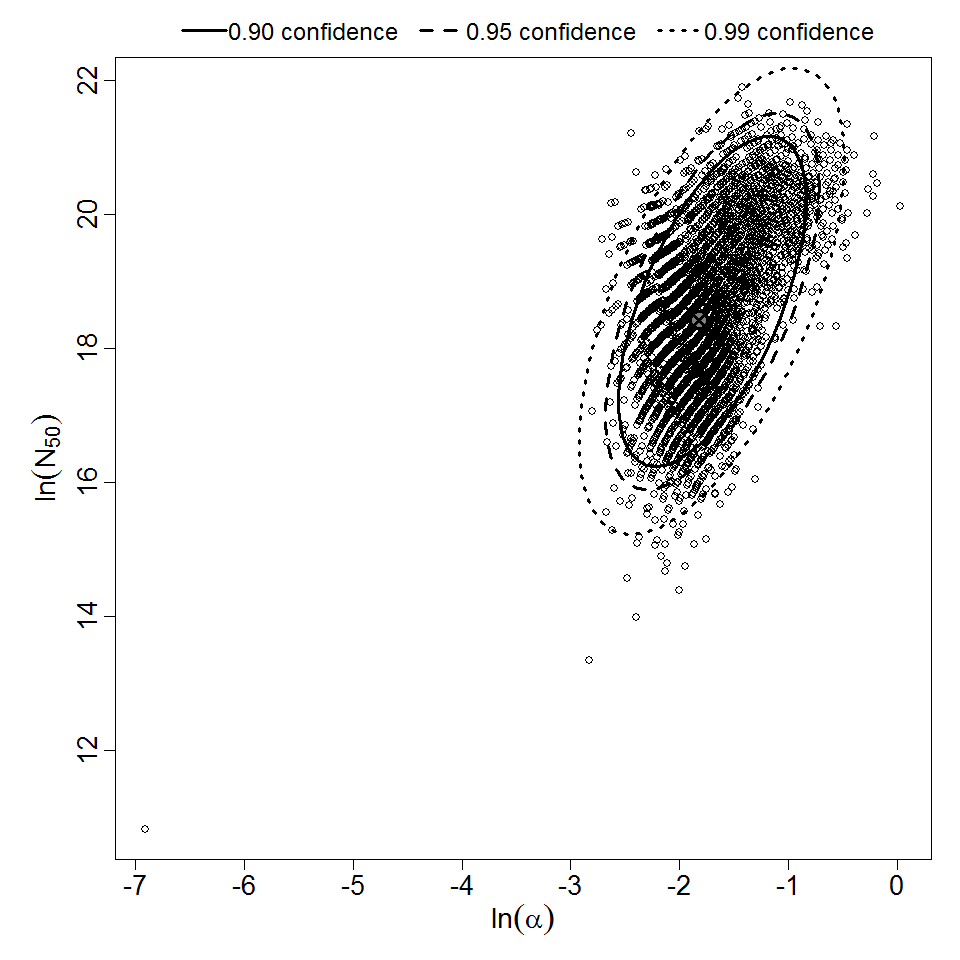
Parameter scatter plot for beta Poisson model ellipses signify the 0.9, 0.95 and 0.99 confidence of the parameters.
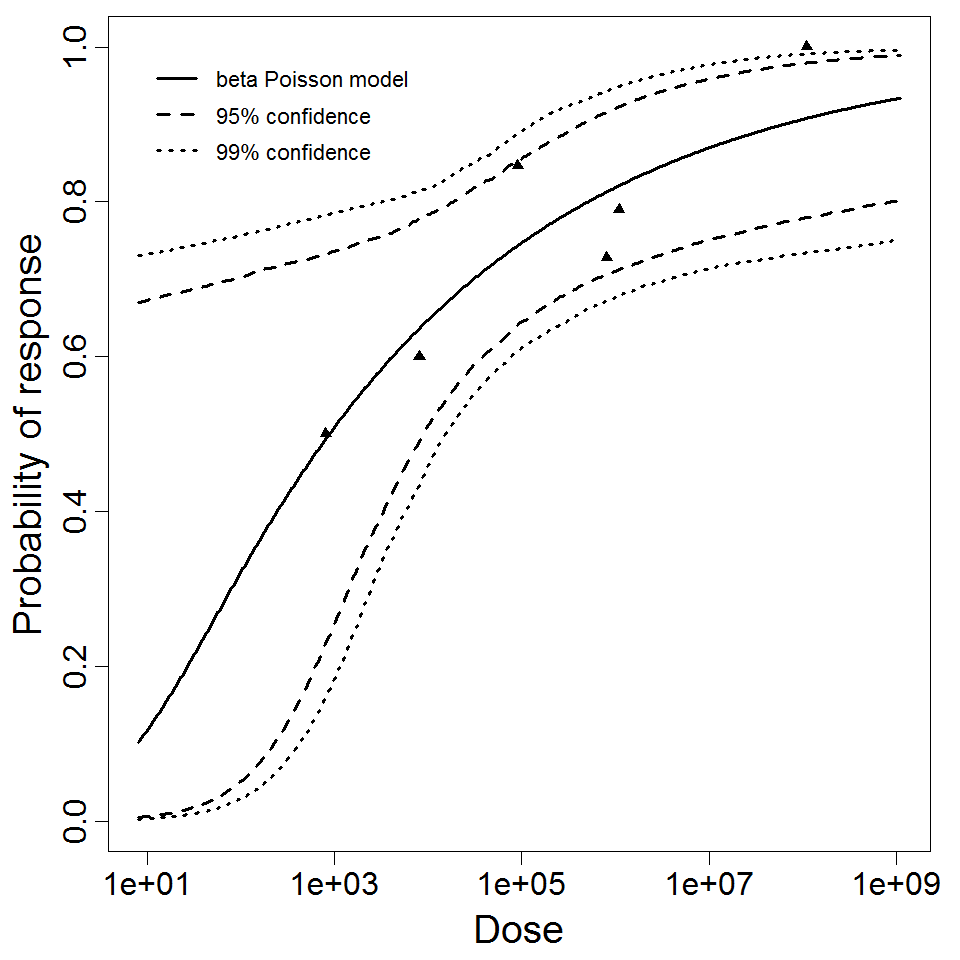
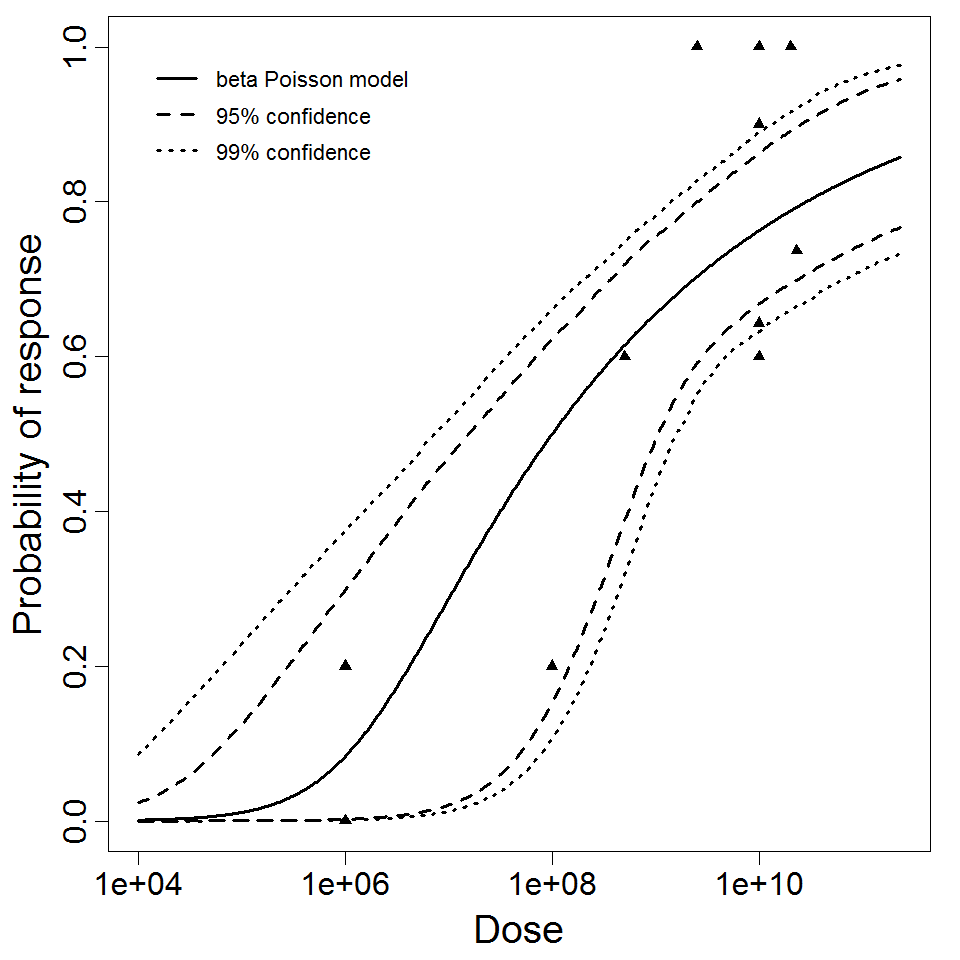
beta Poisson model plot, with confidence bounds around optimized model
# of Doses
3.00
Μodel
N50
1.23E+05
LD50/ID50
1.23E+05
Dose Units
Response
Exposure Route
Contains Preferred Model
a
1.66E-01
Agent Strain
strain 81-176
Experiment ID
188
Host type
Description
|
| ||||||||||||||||||||||
| ||||||||||||||||||||||||||||||||||||||


# of Doses
13.00
Μodel
LD50/ID50
3.56E+05
Dose Units
Response
Exposure Route
Contains Preferred Model
k
1.95E-06
Agent Strain
EPEC E2348/69 (O127:H6)
Experiment ID
154, 156, 158, 160, 219, 220, 221
Host type
Experiment Dataset
Description
|
| ||||||||||||||||||||||
| ||||||||||||||||||||||||||||||
# of Doses
11.00
Μodel
N50
9.98E+07
LD50/ID50
9.98E+07
Dose Units
Response
Exposure Route
Contains Preferred Model
a
1.62E-01
Agent Strain
EPEC E2348/69 (O127:H6)
Experiment ID
153, 157, 159, 214, 216, 217
Host type
Experiment Dataset