Description
|
|
||||||||||||||||||||||
|
||||||||||||||||||||||||||||||||||||||
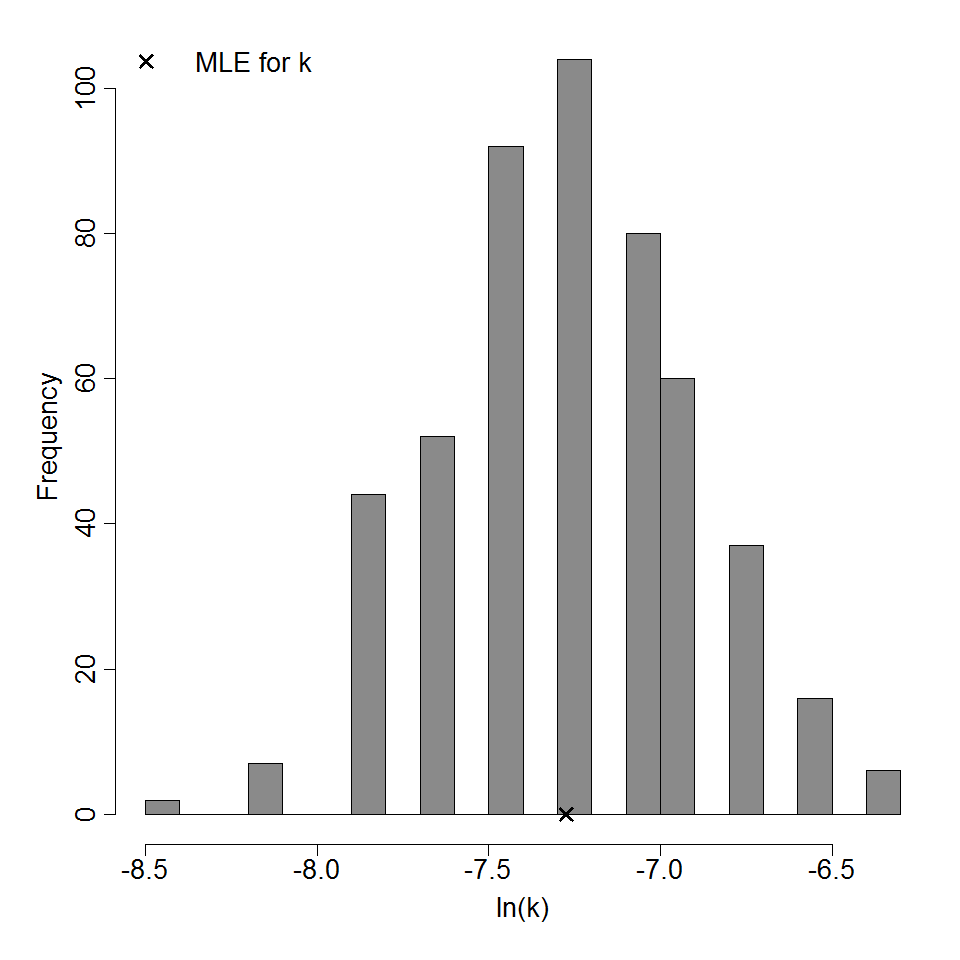
Parameter histogram for exponential model (uncertainty of the parameter)
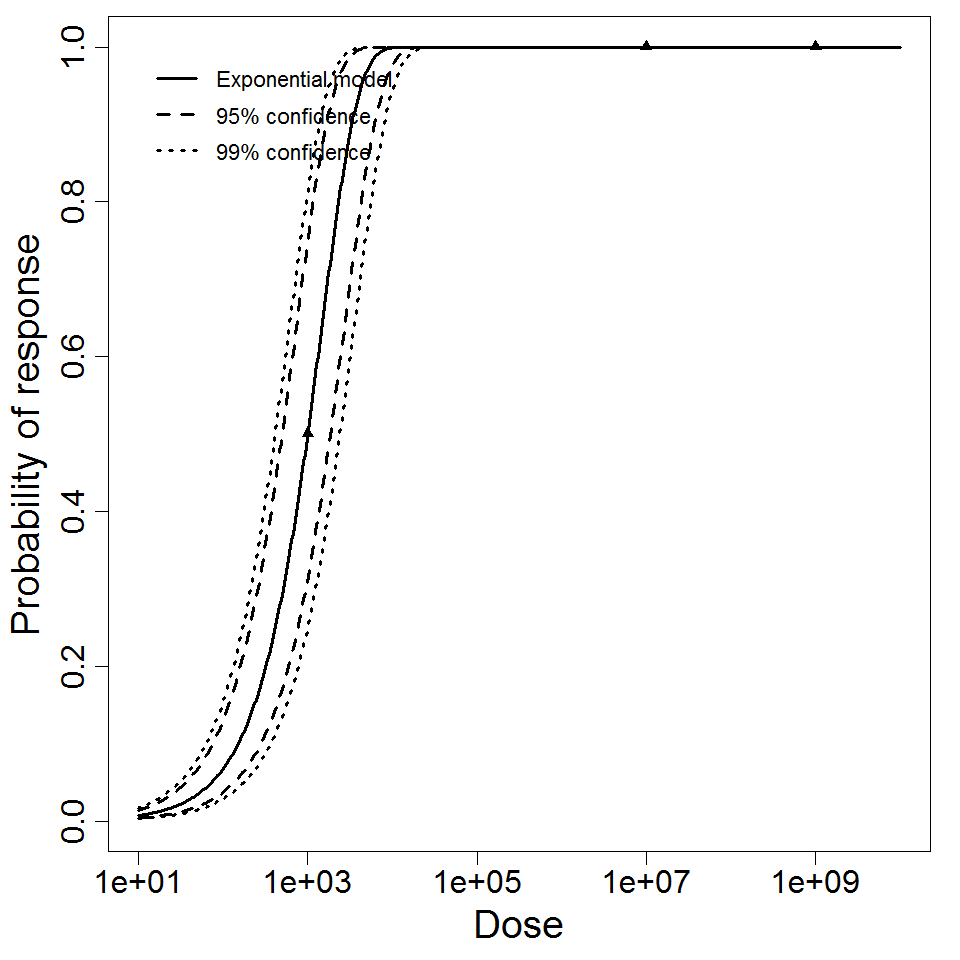
Exponential model plot, with confidence bounds around optimized model
# of Doses
6.00
Μodel
LD50/ID50
4.98E+03
Dose Units
Response
Exposure Route
Contains Preferred Model
k
1.39E-04
Agent Strain
ATCC 19660
Experiment ID
282
Host type
Description
|
|
||||||||||||||||||||||
|
||||||||||||||||||||||||||||||||||||||
Parameter histogram for exponential model (uncertainty of the parameter)
Exponential model plot, with confidence bounds around optimized model
# of Doses
6.00
Μodel
LD50/ID50
8.13E+03
Dose Units
Response
Exposure Route
Contains Preferred Model
k
8.52E-05
Agent Strain
ATCC 19660
Experiment ID
281
Host type
Description
|
|
||||||||||||||||||||||
|
||||||||||||||||||||||||||||||||||||||
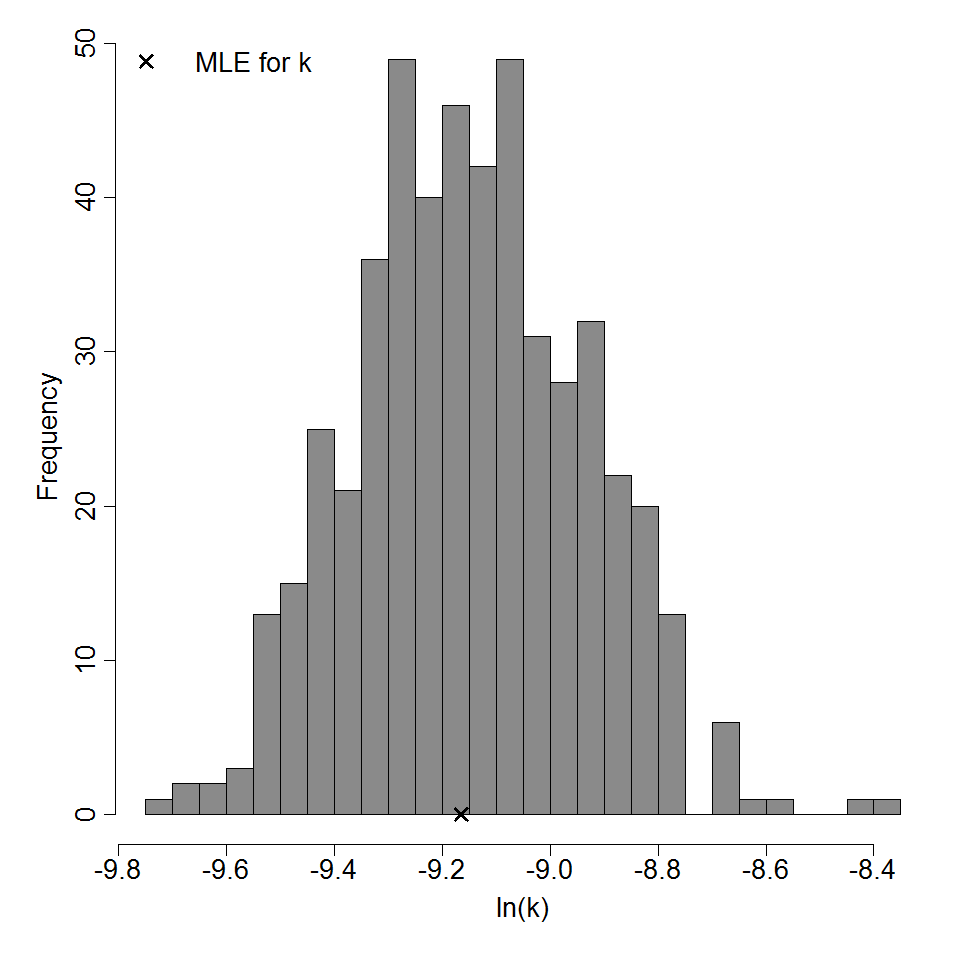
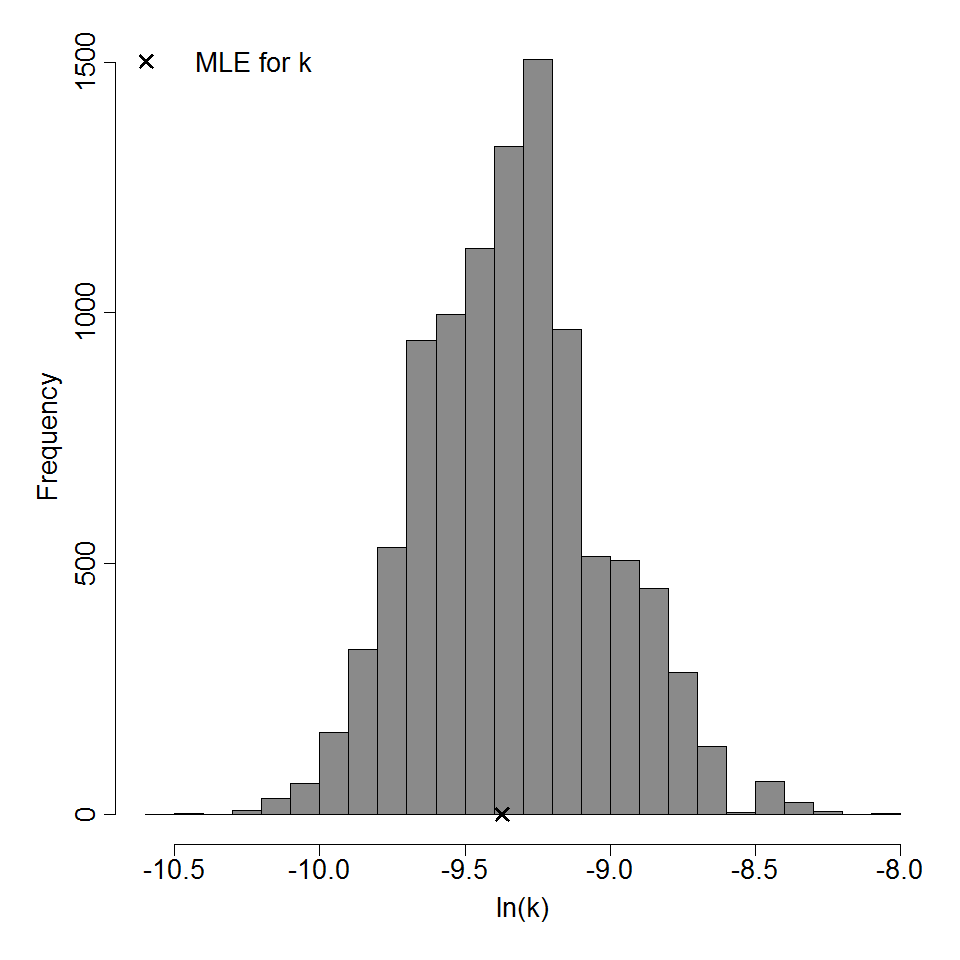
Parameter histogram for exponential model (uncertainty of the parameter)
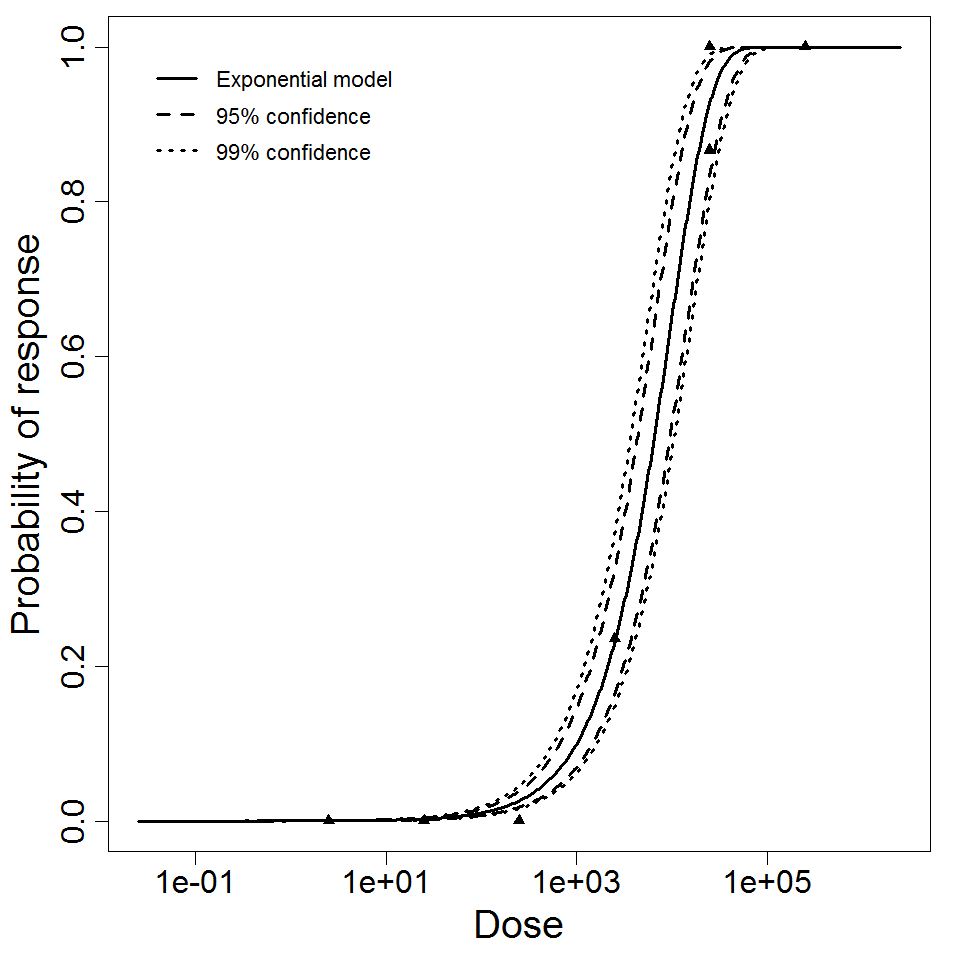
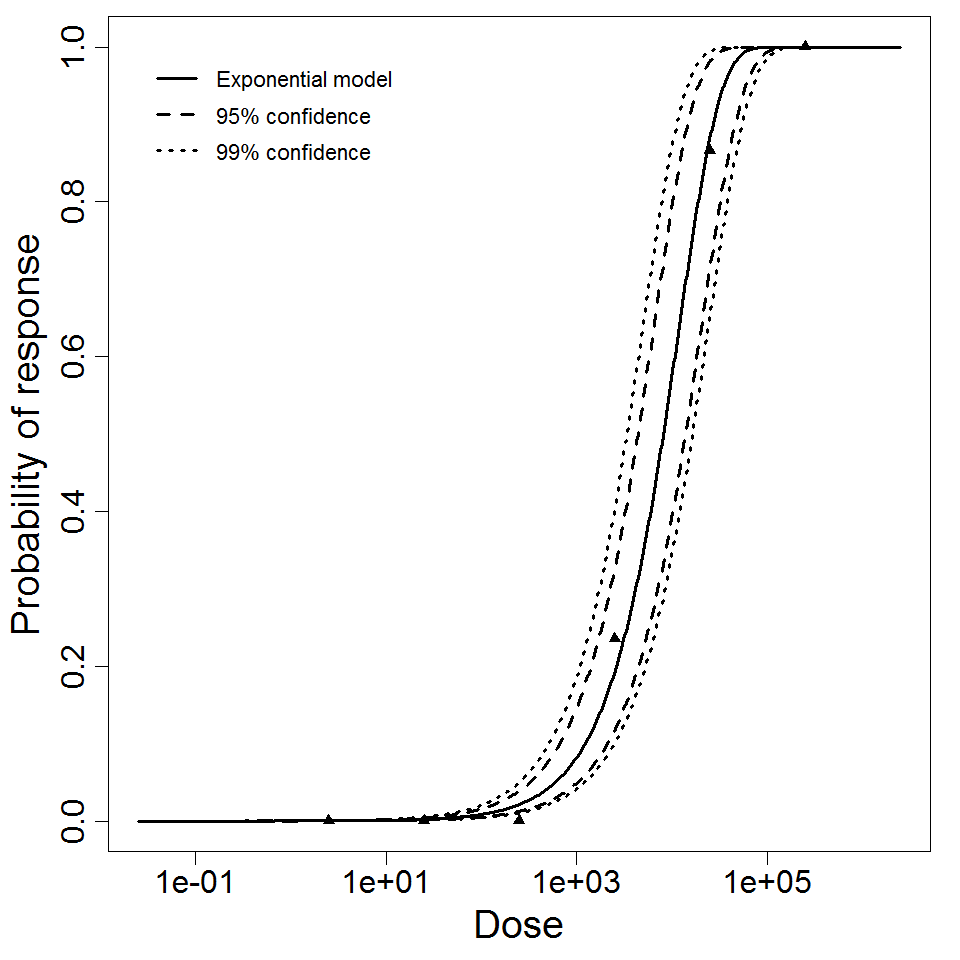
Exponential model plot, with confidence bounds around optimized model
# of Doses
12.00
Μodel
LD50/ID50
6.61E+03
Dose Units
Response
Exposure Route
Contains Preferred Model
k
1.05E-04
Agent Strain
ATCC 19660
Experiment ID
281,282 (pooled)
Host type