The bacterium Bukholderia pseudomallei (B. pseudomallei) is a gram negative bacterium and is present in numerous tropical regions such as Central and South America and Southeast Asia causes Melioidosis, typically infects horses, mules and donkeys but can also present a potentially life threatening disease in humans as well. Burkholderia mallei (B. mallei) is a close relative of B. pseudomallei both of which have been categorized as a B level bioterror agent by the CDC. No dose response models are currently available for B. mallei. http://www.cdc.gov/melioidosis/
Liu et al. in 2002 examined infection through intranasal route to mimic infection through inhalation. C57BL/6 mice and BALB/c mice were inoculated intranasally to B. pseudomallei KHW strain and mortality was recorded as response . Miller et al.(1948) explored infection in guinea pigs via intraperitoneal route . Similarly, Brett and Woods(1996) experimented infection in diabetic rats with B. pseuomallei 316c strain .
Recommended Model
Since the data of C57BL/6 mice and diabetic rat could be pooled and intranasal exposure is closer to inhalation which is the likeliest exposure route for humans, the pooled data sets and resulting models is preferred.
Liu, B. ., Koo, G. C., Yap, E. H., Chua, K. L., & Y-h, G. . (2002). Model of Differential Susceptibility to Mucosal Burkholderia pseudomallei Infection. Infection and Immunity, 70, 2.
Liu, B. ., Koo, G. C., Yap, E. H., Chua, K. L., & Y-h, G. . (2002). Model of Differential Susceptibility to Mucosal Burkholderia pseudomallei Infection. Infection and Immunity, 70, 2.
Brett, P. J., & Woods, D. E. (1996). Structural and immunological characterization of Burkholderia pseudomallei O-polysaccharide-flagellin protein conjugates. Infection and Immunity, 64, 2824–2828.
Miller, W. R., Pannell, L. ., Cravitz, L. ., Tanner, W. A., & Rosebury, T. . (1948). Studies on Certain Biological Characteristics of Malleomyces mallei and Malleomyces pseudomallei. Journal of Bacteriology, 55, 1.
Miller, W. R., Pannell, L. ., Cravitz, L. ., Tanner, W. A., & Rosebury, T. . (1948). Studies on Certain Biological Characteristics of Malleomyces mallei and Malleomyces pseudomallei. Journal of Bacteriology, 55, 1.
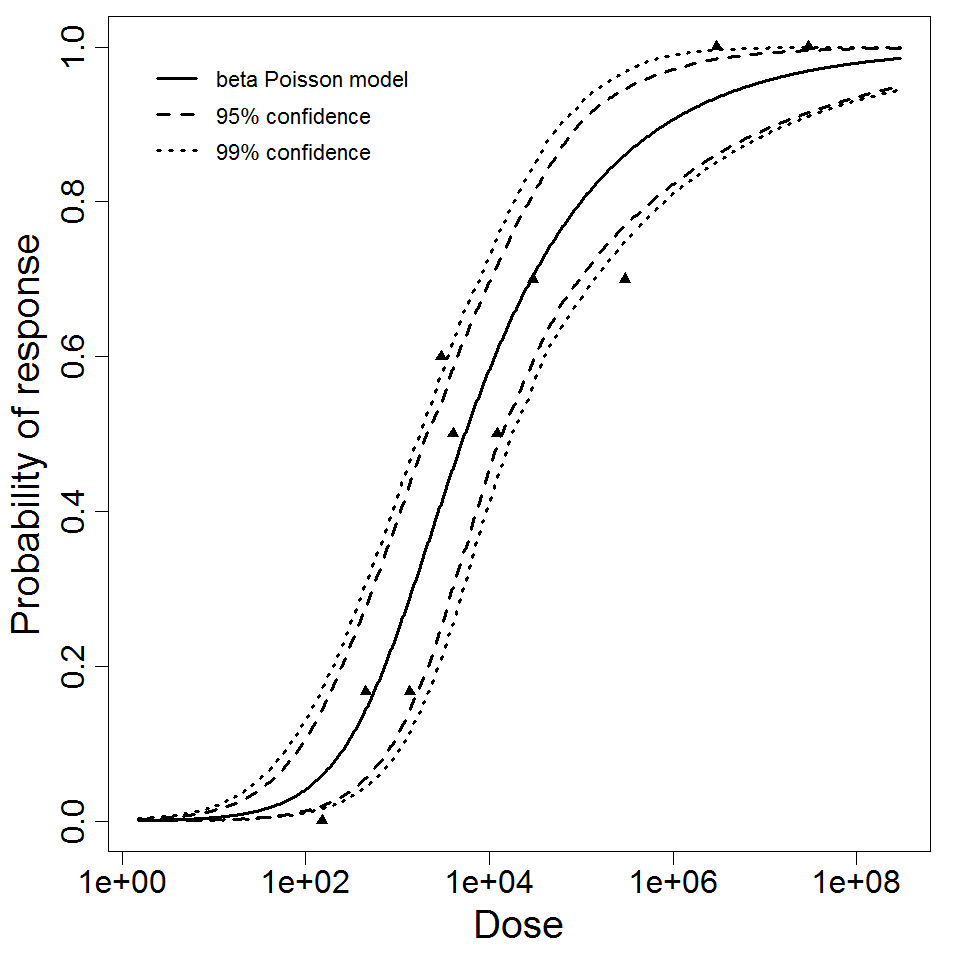
Beta-Poisson fits better than exponential; cannot reject good fit for beta-Poisson.
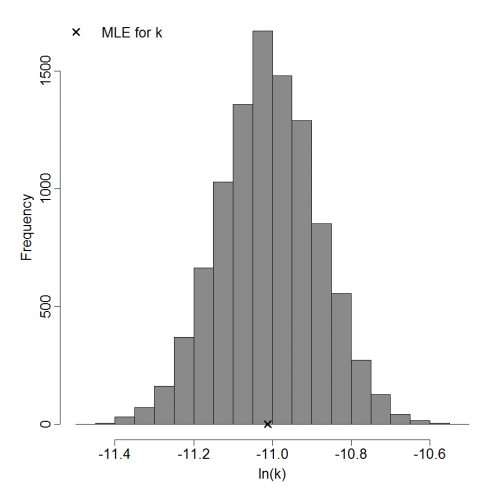
Optimized parameters for the beta-Poisson model, from 500 bootstrap iterations
Parameter
MLE estimate
Percentiles
0.5%
2.5%
5%
95%
97.5%
99.5%
α
2.65E-01
7.56E-02
1.30E-01
1.54E-01
4.94E-01
5.69E-01
8.88E-01
N50
2.27E+03
7.58E-02
1.50E+01
5.32E+01
8.62E+03
1.11E+04
1.74E+04
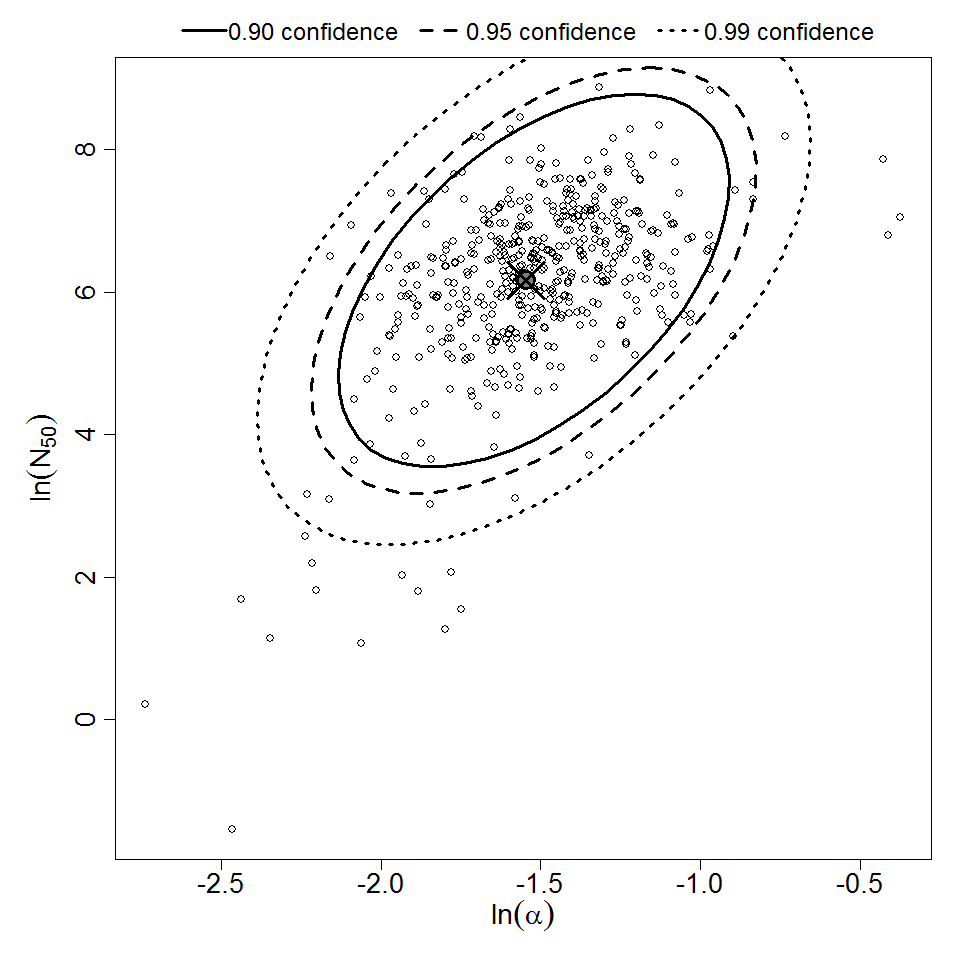
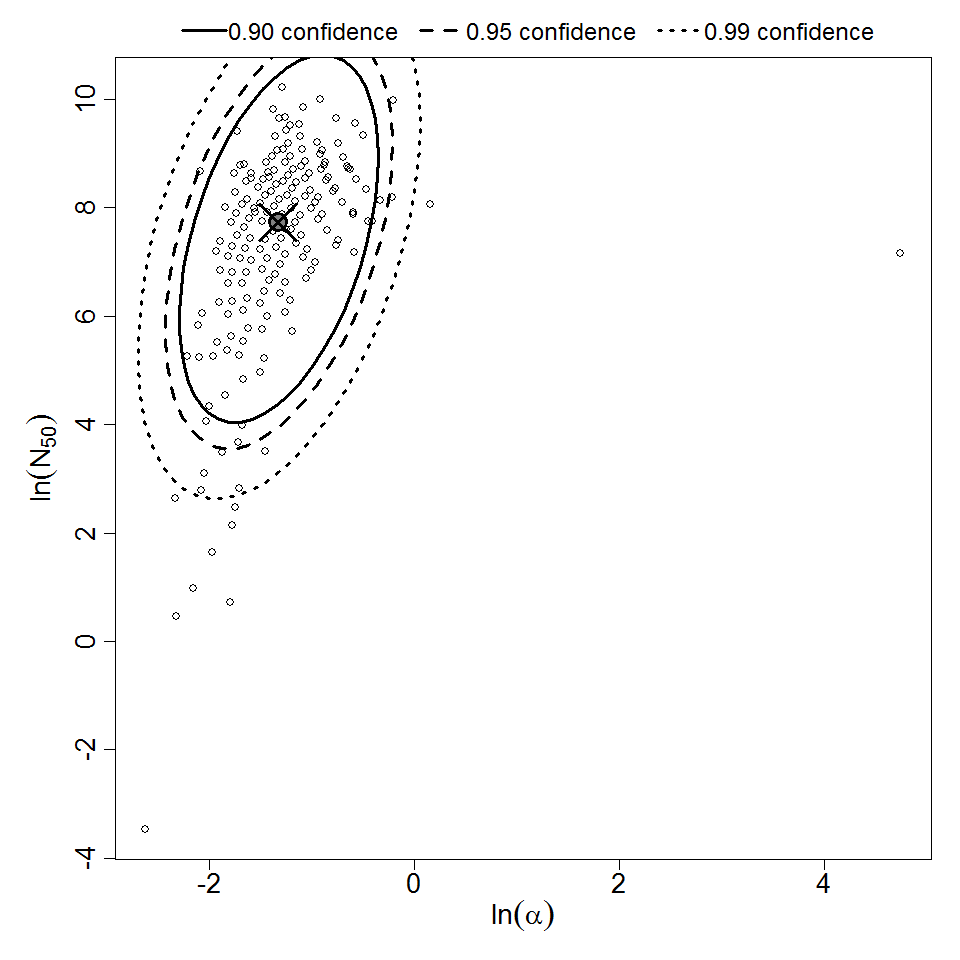
Parameter scatter plot for beta Poisson model ellipses signify the 0.9, 0.95 and 0.99 confidence of the parameters.
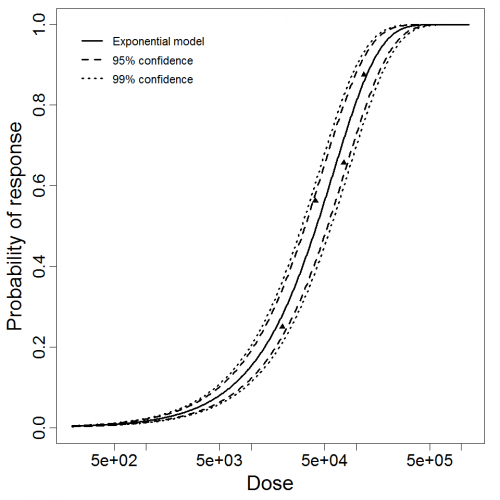
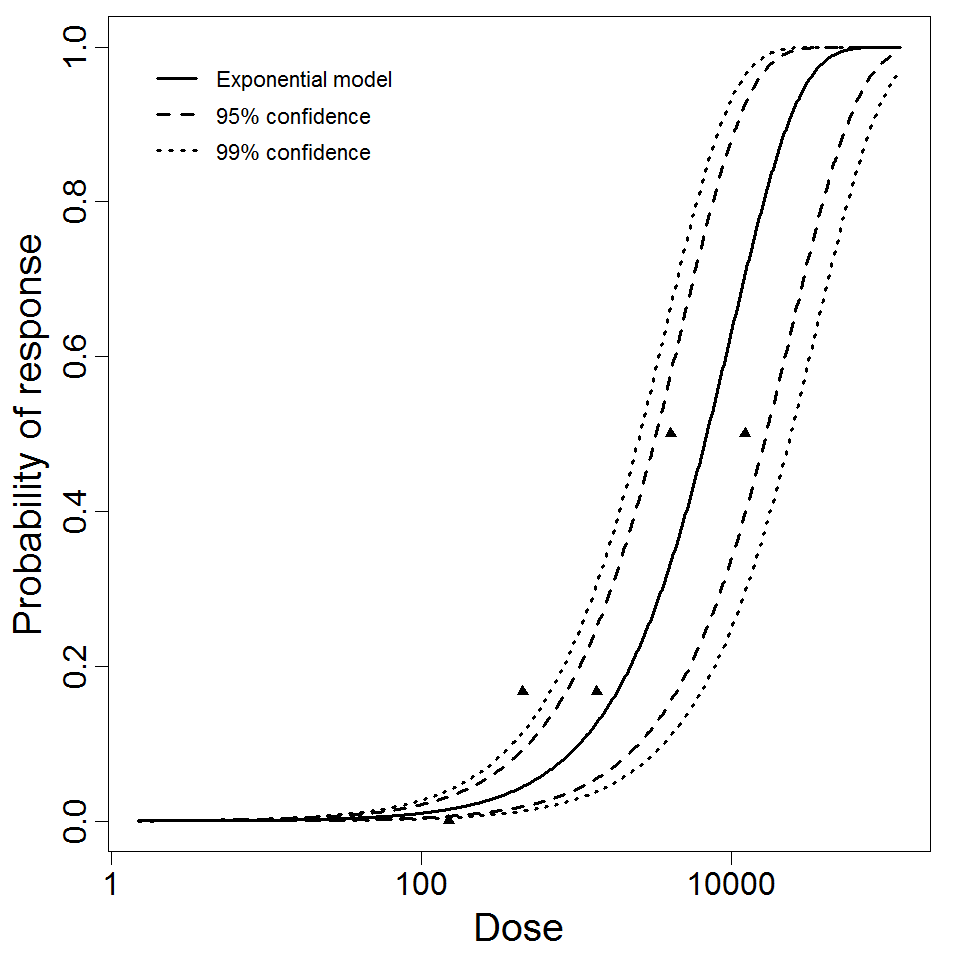
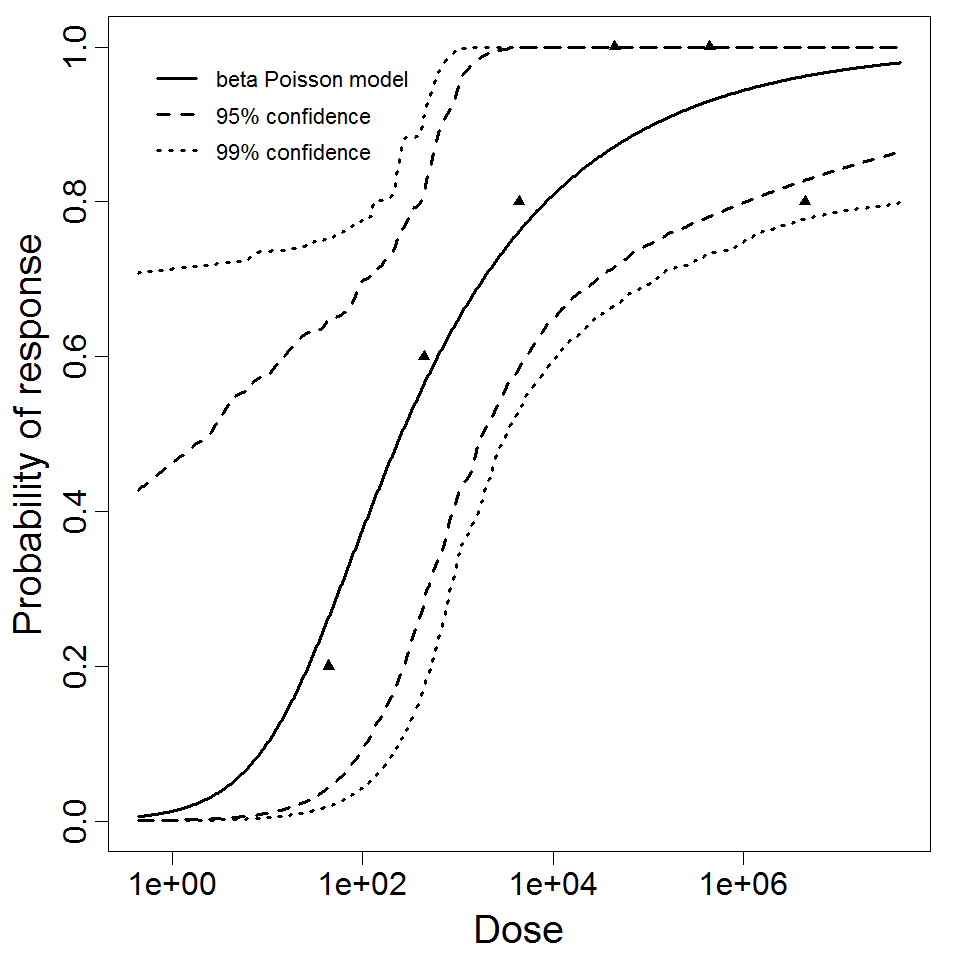
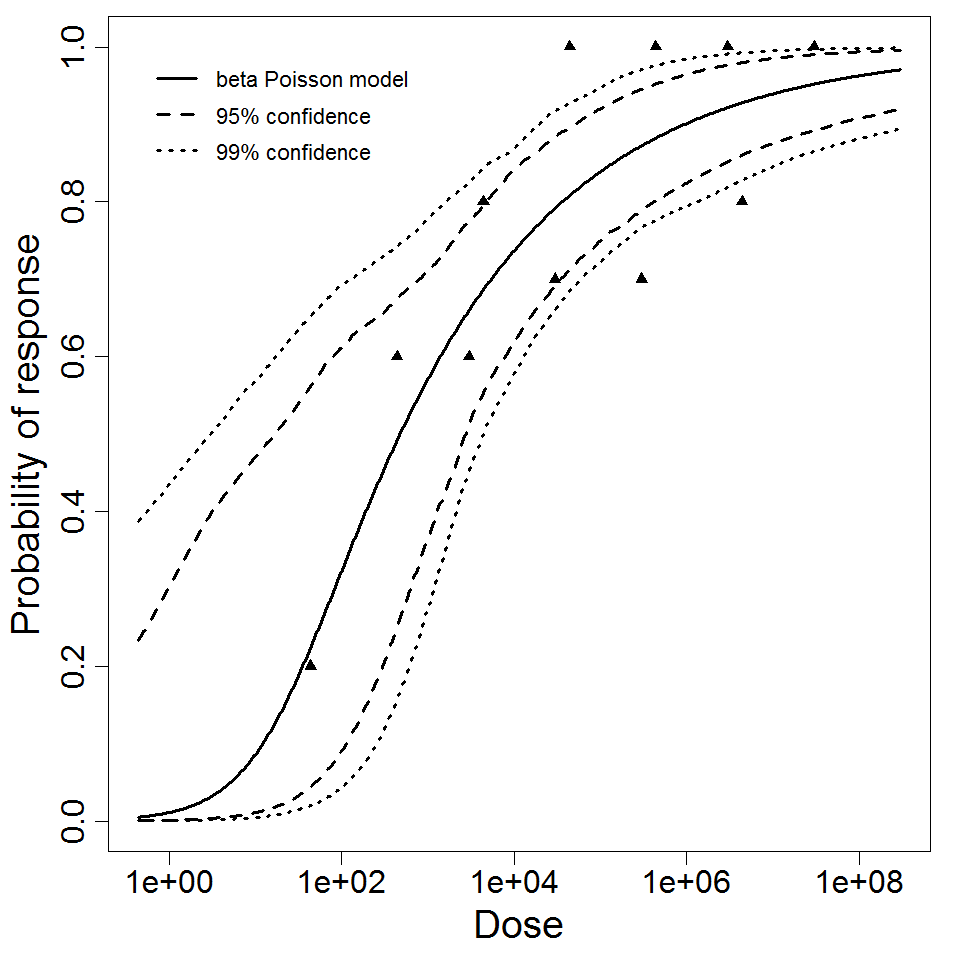
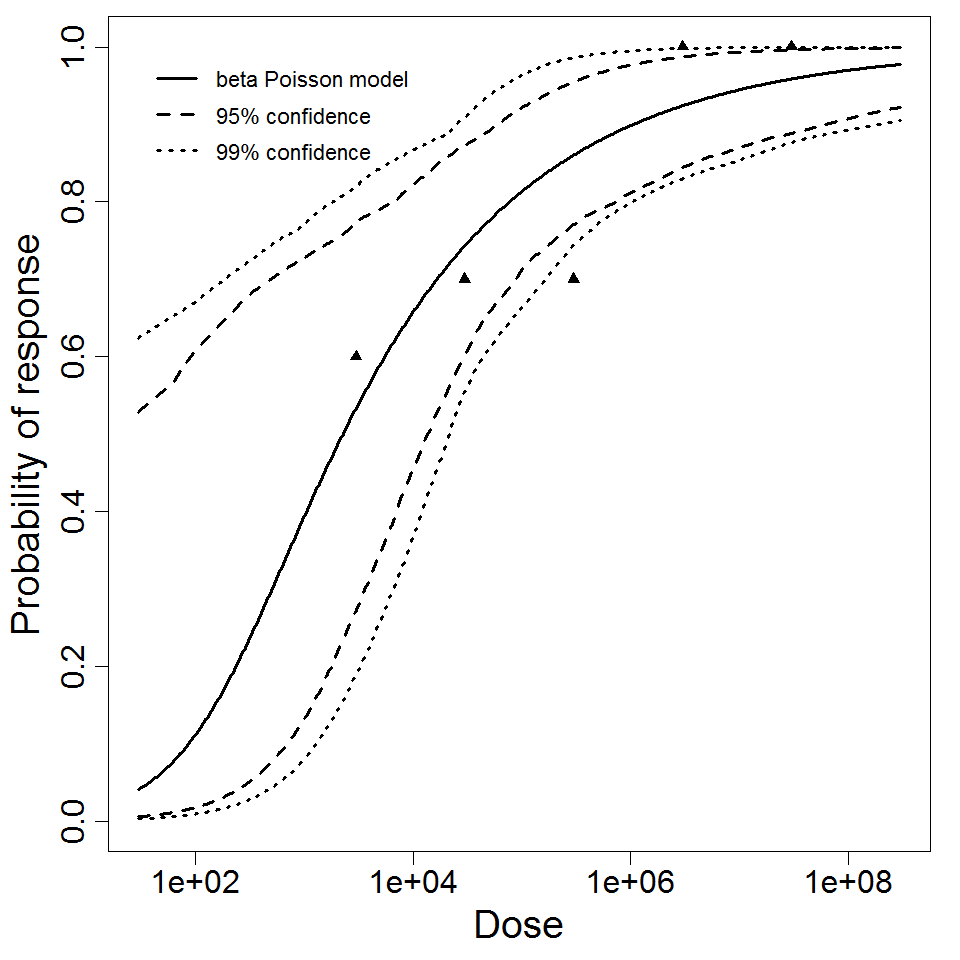
beta Poisson model plot, with confidence bounds around optimized model
References
Liu, B. ., Koo, G. C., Yap, E. H., Chua, K. L., & Y-h, G. . (2002). Model of Differential Susceptibility to Mucosal Burkholderia pseudomallei Infection. Infection and Immunity, 70, 2.
Miller, W. R., Pannell, L. ., Cravitz, L. ., Tanner, W. A., & Rosebury, T. . (1948). Studies on Certain Biological Characteristics of Malleomyces mallei and Malleomyces pseudomallei. Journal of Bacteriology, 55, 1.
Brett, P. J., & Woods, D. E. (1996). Structural and immunological characterization of Burkholderia pseudomallei O-polysaccharide-flagellin protein conjugates. Infection and Immunity, 64, 2824–2828.