General Overview
Escherichia coli typically resides as a symbiotic bacterium in the mammalian large intestine, benefiting itself as well as the host. However, there are several well-established pathotypes of disease-causing E. coli :
- Enteropathogenic (EPEC)
- Attaches to small intestinal wall and produces ‘attaching and effacing lesions’, in which microvilli are destroyed and the bacteria become perched on pedestals on the surface of the epithelial cell. This ability is encoded on the locus of enterocyte effacement (LEE) pathogenicity island.
- Causes an inflammatory response and diarrhea, but seldom in persons older than 2y; it can also be isolated from healthy older persons.
- Primarily found in developing countries.
- Enterohemorrhagic (EHEC)
- This is discussed in more detail in its own chapter.
- Enterotoxigenic (ETEC)
- Attaches to small intestinal wall.
- Produces a heat-labile (LT) and/or heat-stable (ST) toxins, both of which cause secretion from the small intestinal wall, leading to mild to severe watery diarrhea. LT is an immunogenic multisubunit protein similar to cholera enterotoxin. ST is a nonimmunogenic polypeptide containing 18-19 amino acids.
- Primarily found in developing countries and is a major cause of diarrhea in weaned infants, as well as traveler’s diarrhea.
- Can be shed even by immune asymptomatic individuals.
- Enteroaggregative (EAEC)
- Loosely classified group, some of which may be nonpathogenic.
- Produces a thick biofilm (‘stacked brick’ configuration) in the small or large intestines.
- Thought to cause persistent diarrhea (lasting >14 days).
- Can produce many different secretory toxins and cytotoxins, but not ST or LT.
- Enteroinvasive (EIEC)
- Actually invades the epithelial cells of the large intestine, where it multiplies.
- Usually produces watery diarrhea similar to that of EPEC and ETEC, sometimes inflammatory colitis or dysentery.
- Particularly closely related to Shigella sp. (which are now thought to be subgroups of E. coli); much pathogenesis from EIEC and Shigella sp. is mediated by the pWR100 virulence plasmid.
- Diffusely adherent (DAEC)
- Attaches to the small intestinal wall and induces formation of projections which wrap around the bacterium.
Enterotoxigenic Escherichia coli (ETEC) is the most common type of diarrheagenic E. coli. It may also be the most common cause of childhood diarrhea in the developing world, responsible for approximately 1/7 of diarrheal episodes in children aged less than 1 year and almost 1/4 of diarrheal episodes in 1-4 year olds.[4] It can also cause severe dehydrating cholera-like disease in adults. Diagnosis is complicated since many other Gram-negative bacteria produce similar toxins, so toxins as well as the E. coli bacterium must be tested for in order to yield accurate results.[4]
ETEC can often be detected in apparently healthy people. In developing countries among healthy 0-11 month olds, and 1-4 year olds, 11.7% and 7.1%, respectively, are estimated to be colonized with ETEC.[4]
Feeding studies of ETEC or EPEC in healthy volunteers first gave 2-3g of NaHCO3, which neutralizes stomach acid and reduces the infectious dose. However, it has been suggested that food as a vehicle has a similar acid-neutralizing effect, so feeding studies given with NaHCO3 may better represent natural foodborne infection. ETEC and EPEC generally have high ID50, and partly as a consequence of this, they do not appear to be transmitted person-to-person; a study of ETEC-infected volunteers co-housed with uninfected volunteers did not result in any transmission of infection. Food was all served individually to the volunteers over the course of the experiment, so there was no opportunity for ETEC to spread via that route.
http://www.cdc.gov/ecoli/index.html
Summary of data and models
There are many human feeding studies of various E. coli types and strains, which can be pooled in various ways to yield different dose response models. Many of these have small sample sizes and cannot be used on their own to reliably fit a dose response model. Most datasets for E. coli infections describe high levels of infection resulting from high doses. Lower doses remain to be investigated, and dose response models for infection are therefore uncertain. Another important factor is whether the dose was given with bicarbonate, which would neutralize some stomach acid and possibly increase infectivity.
Haas, Rose, and Gerba (1999) fitted beta-Poisson models to several pooled datasets describing the disease response from ETEC, EPEC and EIEC. Among these datasets were the EPEC strains O111 and O55, as well as EIEC strains 4608 and 1624 with diarrhea as the end point. However, it mixed data from experiments in which bacteria were given with and without bicarbonate.
The best available dataset using infection as a response comes from an experiment (98) with 3 dose levels, feeding EIEC to adult humans.
Powell et al. (2000) pooled 3 human trial datasets for EPEC to produce a beta-Poisson model and a Weibull-gamma model.
Additional pooling analyses for this chapter were conducted on the basis of pathotype (ETEC or EPEC), whether the dose was given with bicarbonate, and the nature of the response (disease or infection), incorporating more data from the literature than the previous two published models. Since some combinations of these factors lacked data, analyses could only be done for ETEC disease (buffered or unbuffered), EPEC disease (buffered), ETEC infection (unbuffered), and EPEC infection (buffered). The pooled datasets for infection contained mostly positive responses, and therefore their behavior at low doses is very uncertain. For the pooled analyses describing disease, datasets were excluded if they contributed significantly (P < 0.05) to the -2 log likelihood of the model given the data. Two experiments examining diarrhea from EIEC were also pooled.
| ID | Exposure Route | # of Doses | Agent Strain | Dose Units | Host type | Μodel | LD50/ID50 | Optimized parameters | Response type | Reference |
|---|---|---|---|---|---|---|---|---|---|---|
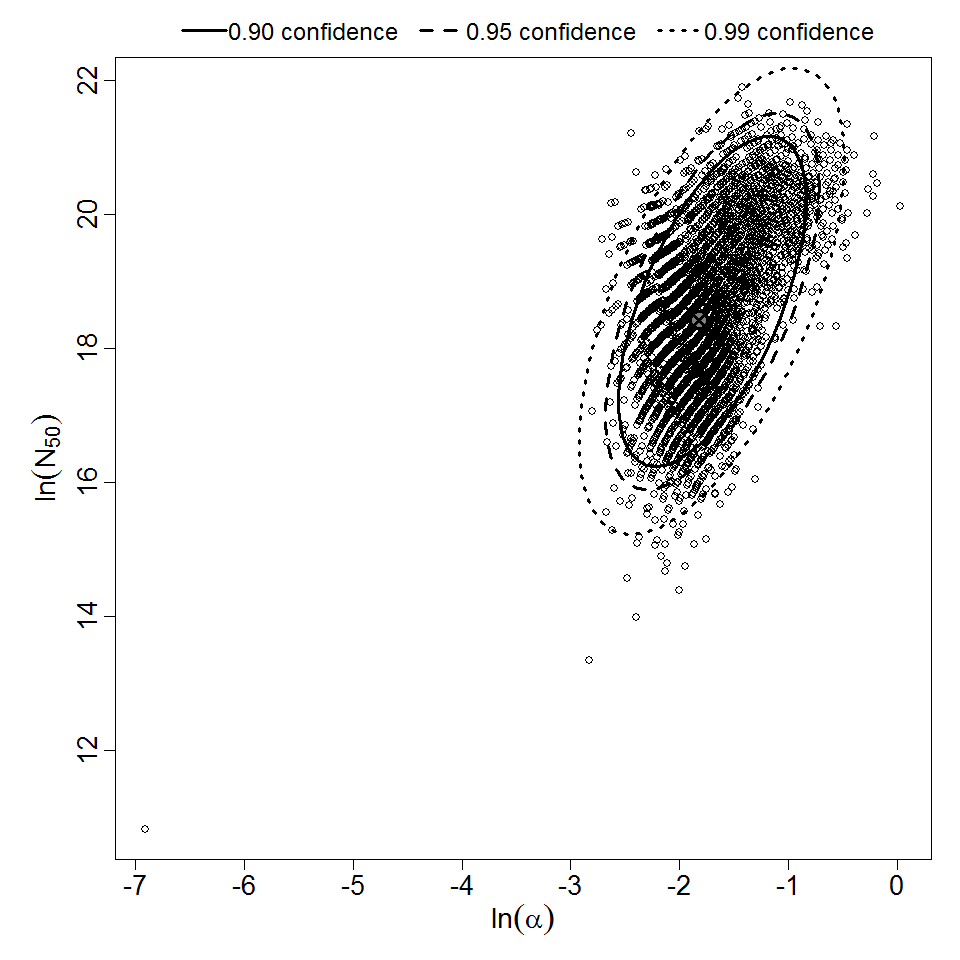
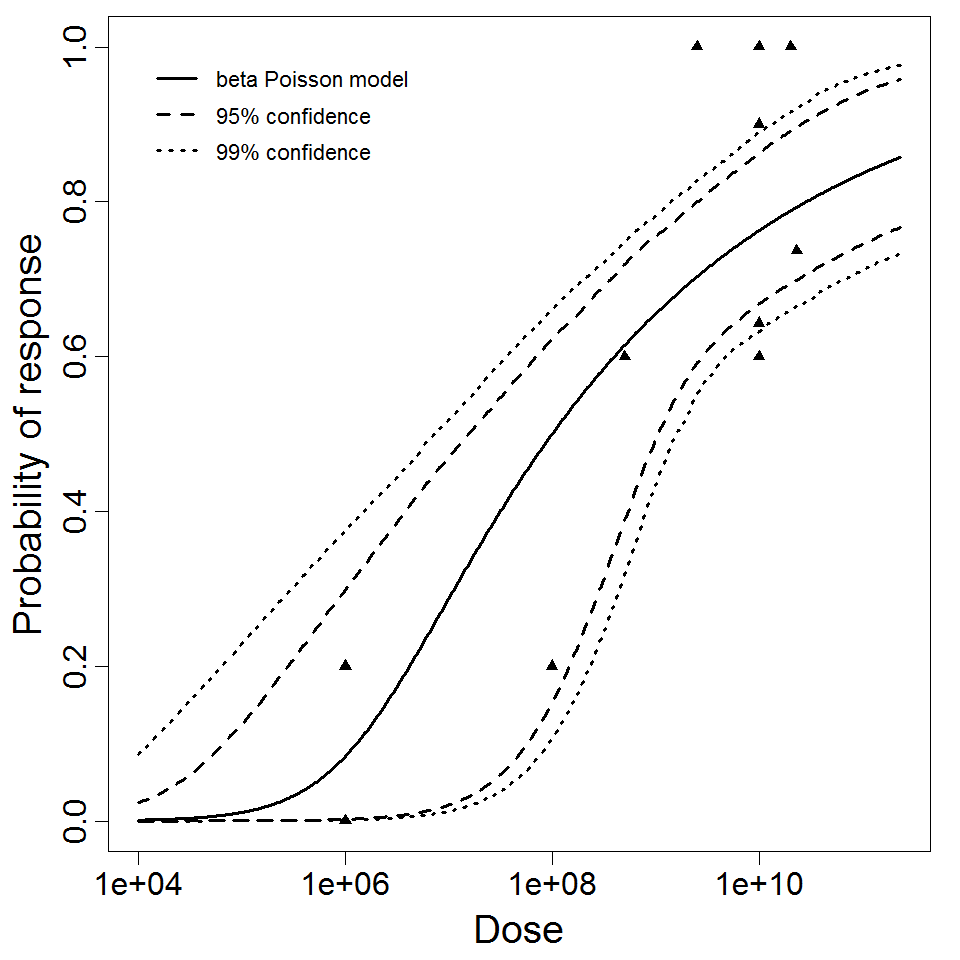
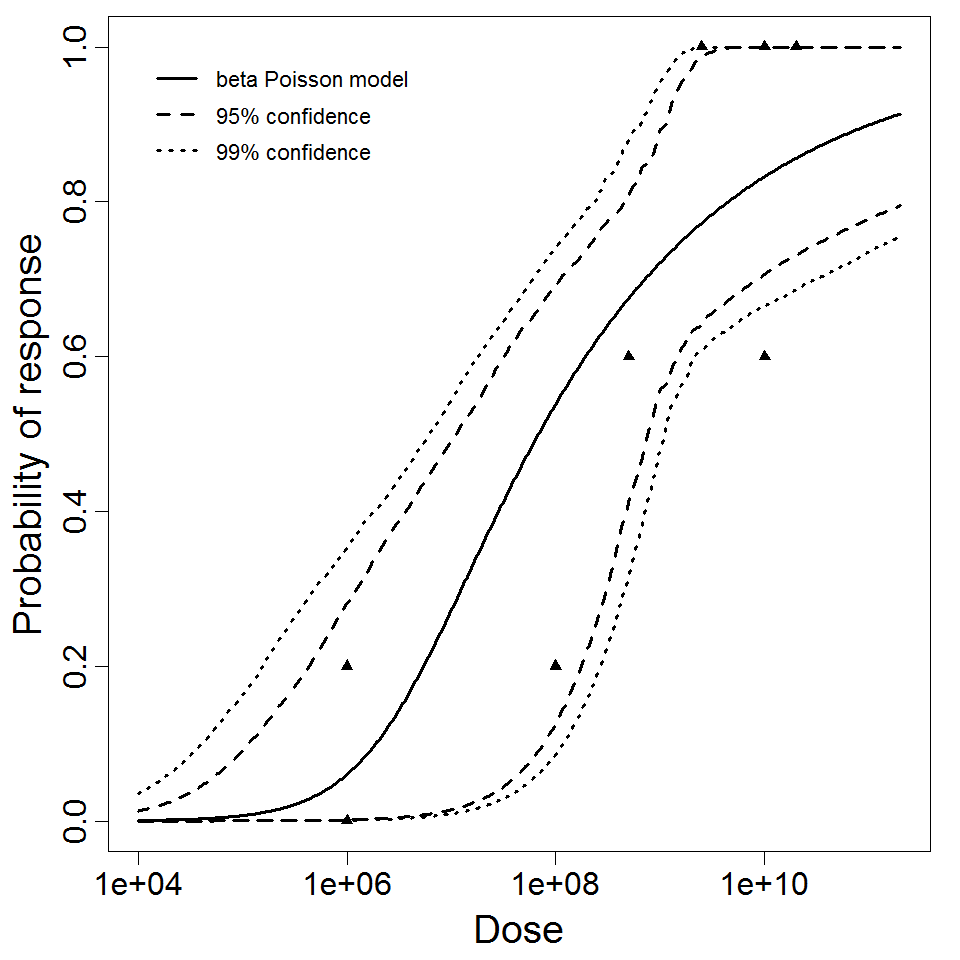
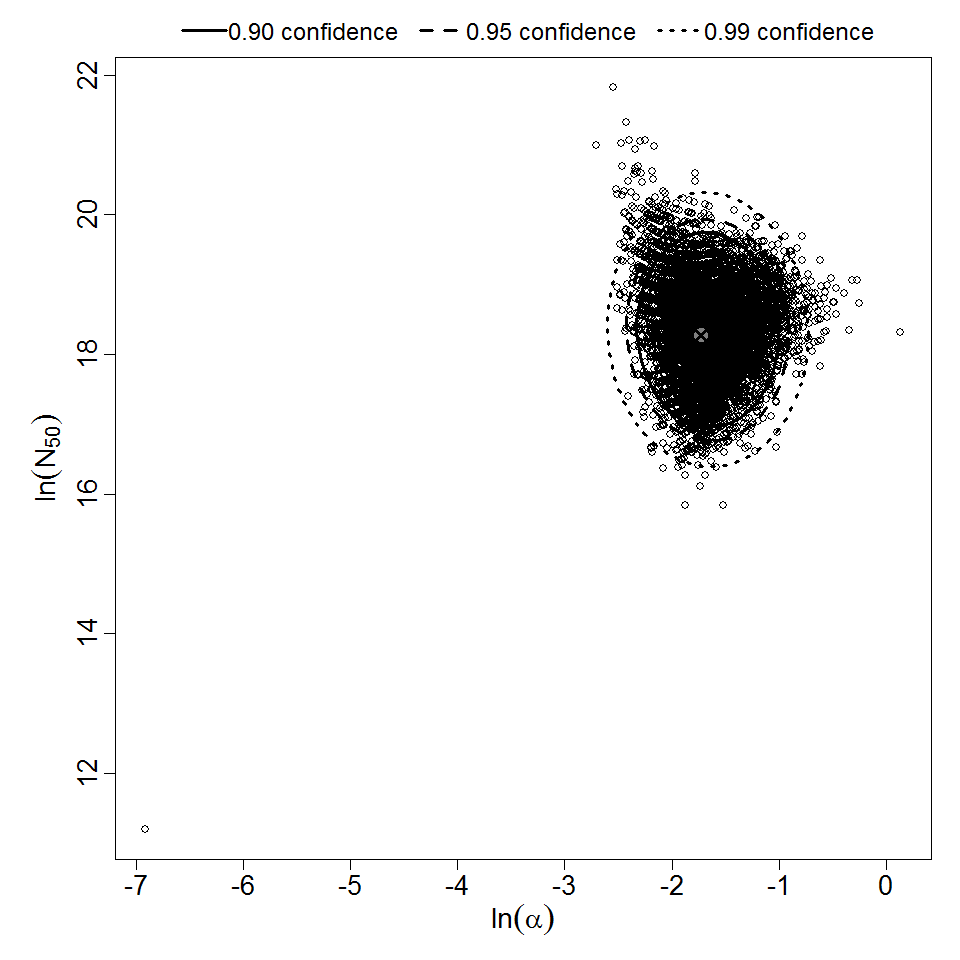
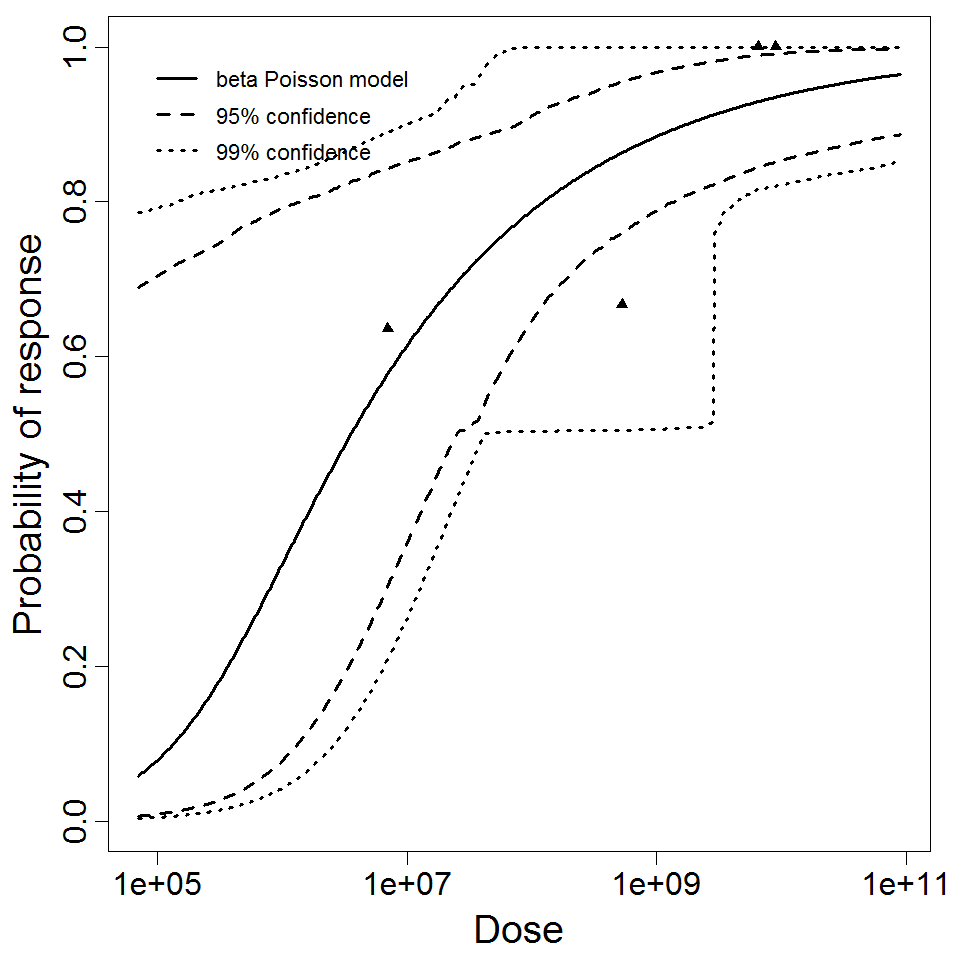
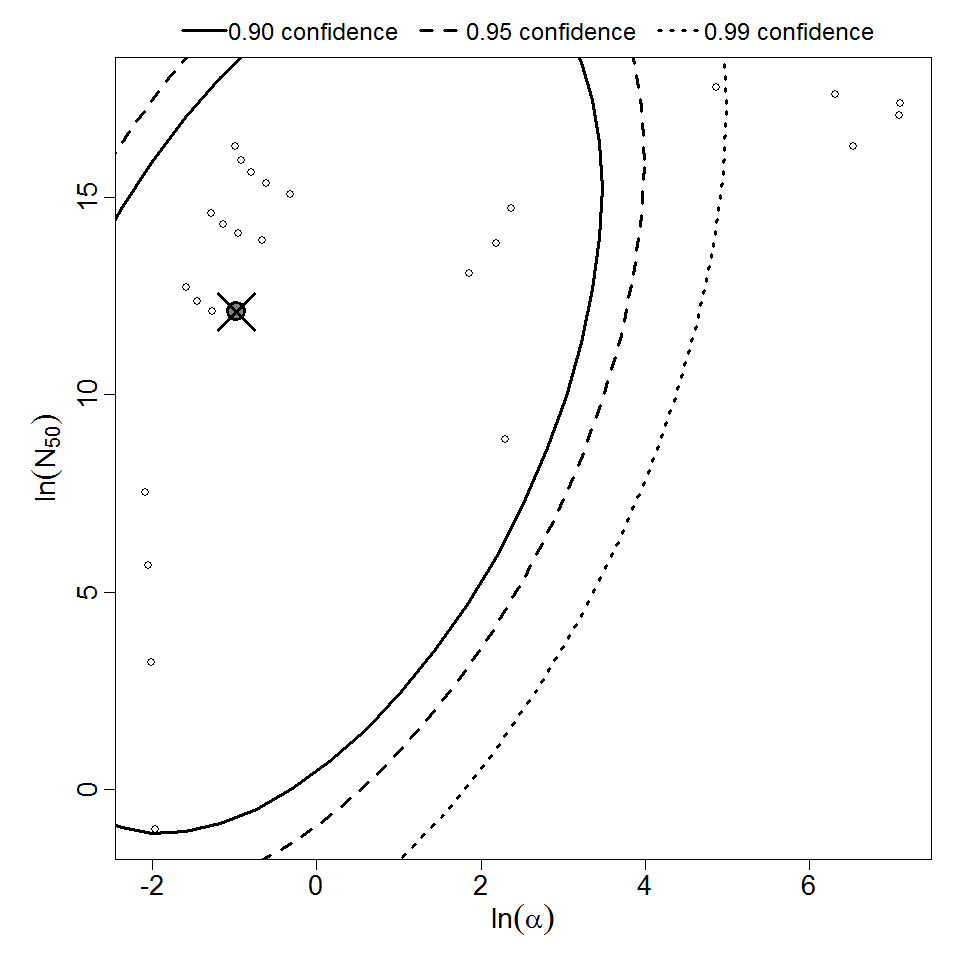
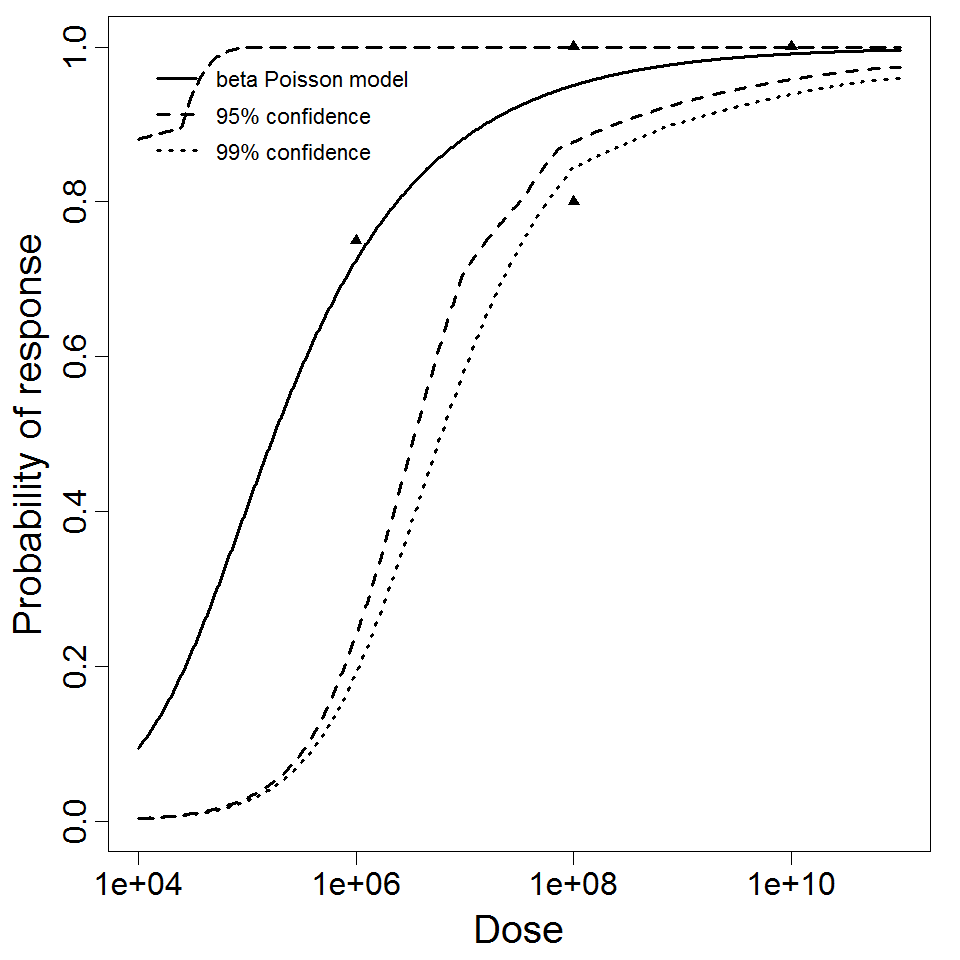
| 142, 143, 144, 145, 147, 151, 161, 162, 163, 164, 168, 169, 170, 172 | oral (with NaHCO3) | 19.00 | ETEC B7A | CFU | human | beta-Poisson | 1.7E+06 | a = 7.54E-02 N50 = 1.7E+06 | diarrhea |
Coster, T. S., Wolf, M. K., Hall, E. R., Cassels, F. J., Taylor, D. N., Liu, C. T., … McQueen, C. E. (2007). Immune response, ciprofloxacin activity, and gender differences after human experimental challenge by two strains of enterotoxigenic Escherichia coli. Infection and Immunity, 75, 1. |
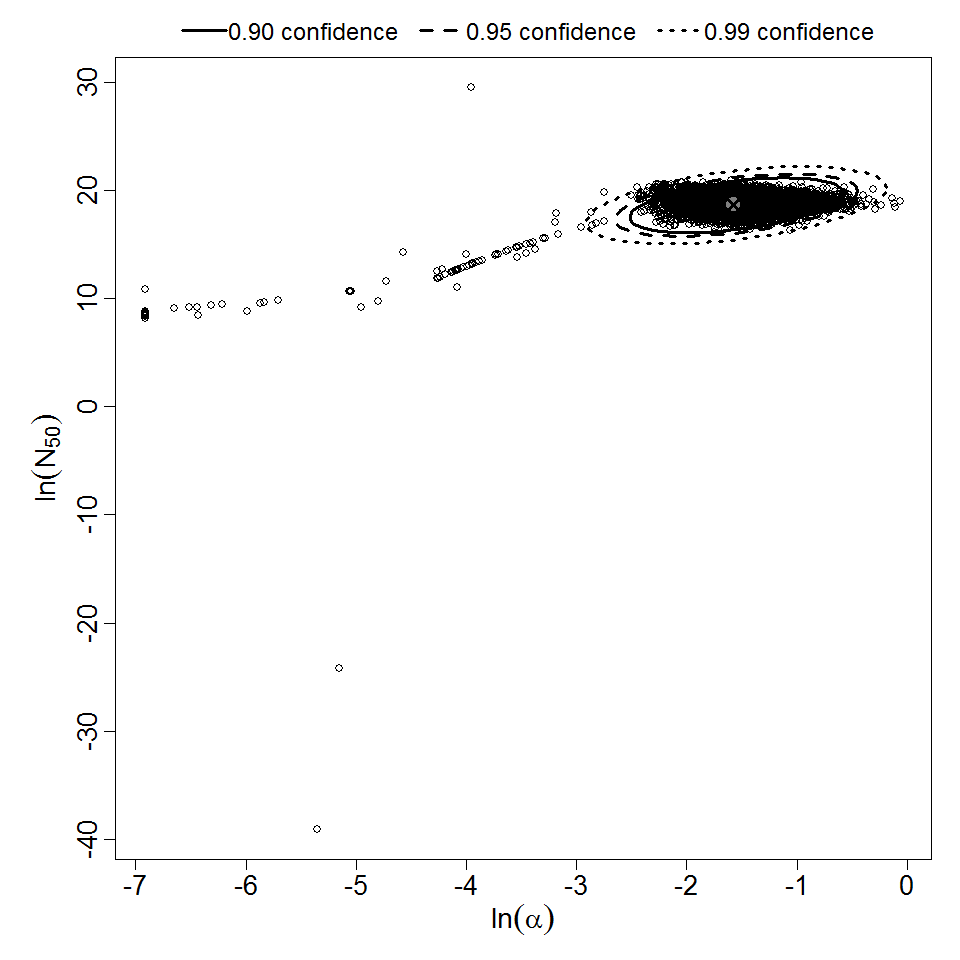
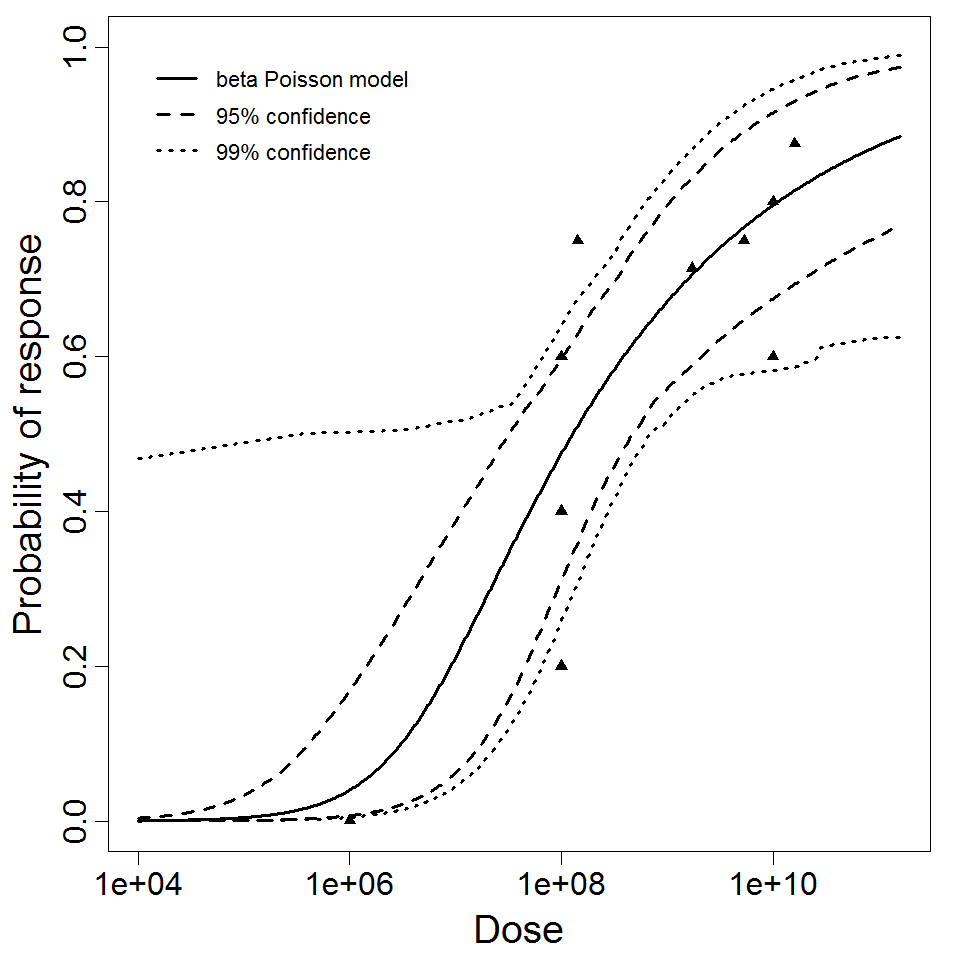
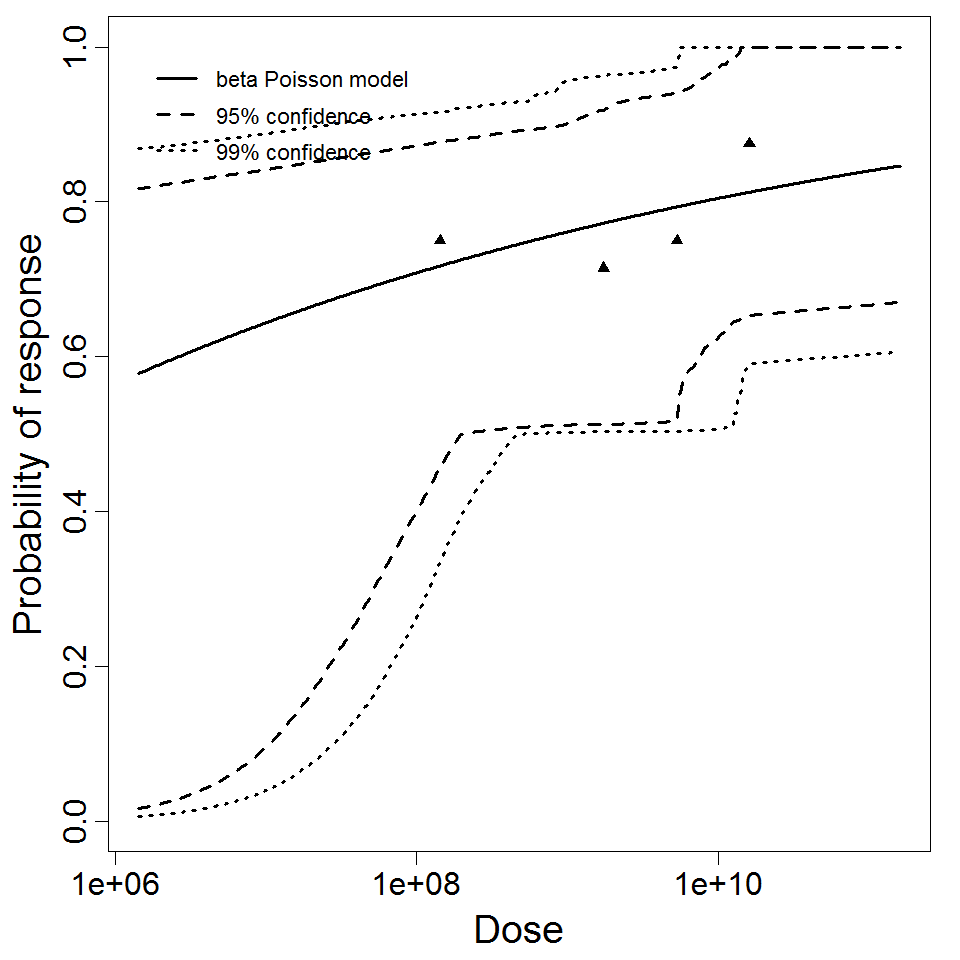
| 153, 157, 159, 214, 216, 217 | oral (w. 2g NaHCO3) | 11.00 | EPEC E2348/69 (O127:H6) | CFU | human | beta-Poisson | 9.98E+07 | a = 1.62E-01 N50 = 9.98E+07 | diarrhea |
Tacket, C. O., Sztein, M. B., Losonsky, G. ., Abe, A. ., Finlay, B. B., McNamara, B. P., … Donnenberg, M. S. (2000). Role of EspB in Experimental Human Enteropathogenic Escherichia coli Infection. Infection and Immunity, 68, 6. |
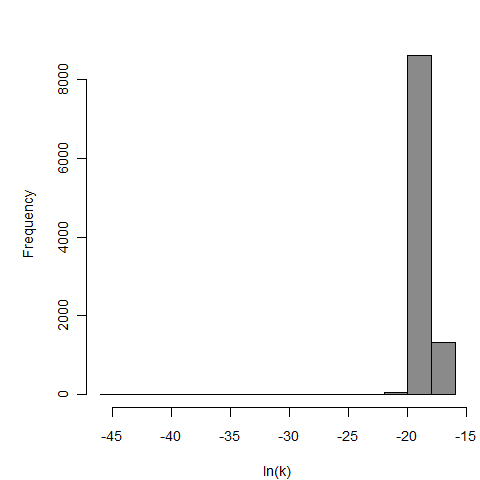
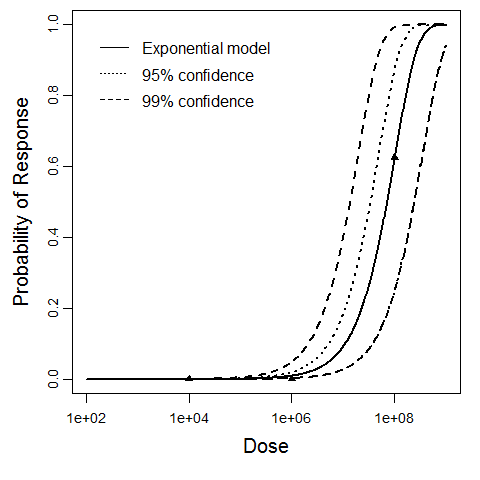
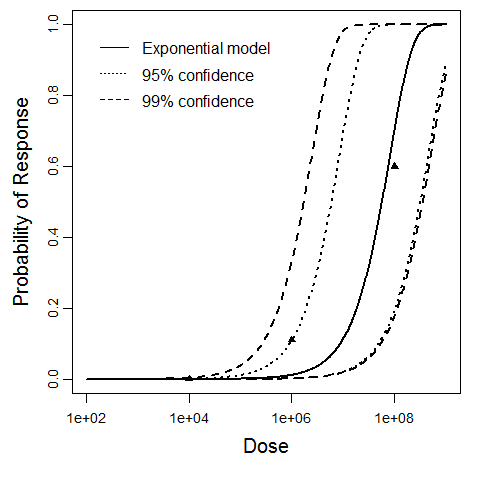
| 154, 156, 158, 160, 219, 220, 221 | oral (w. 2g NaHCO3) | 13.00 | EPEC E2348/69 (O127:H6) | CFU | human | exponential | 3.56E+05 | k = 1.95E-06 | shedding in feces |
Tacket, C. O., Sztein, M. B., Losonsky, G. ., Abe, A. ., Finlay, B. B., McNamara, B. P., … Donnenberg, M. S. (2000). Role of EspB in Experimental Human Enteropathogenic Escherichia coli Infection. Infection and Immunity, 68, 6. |
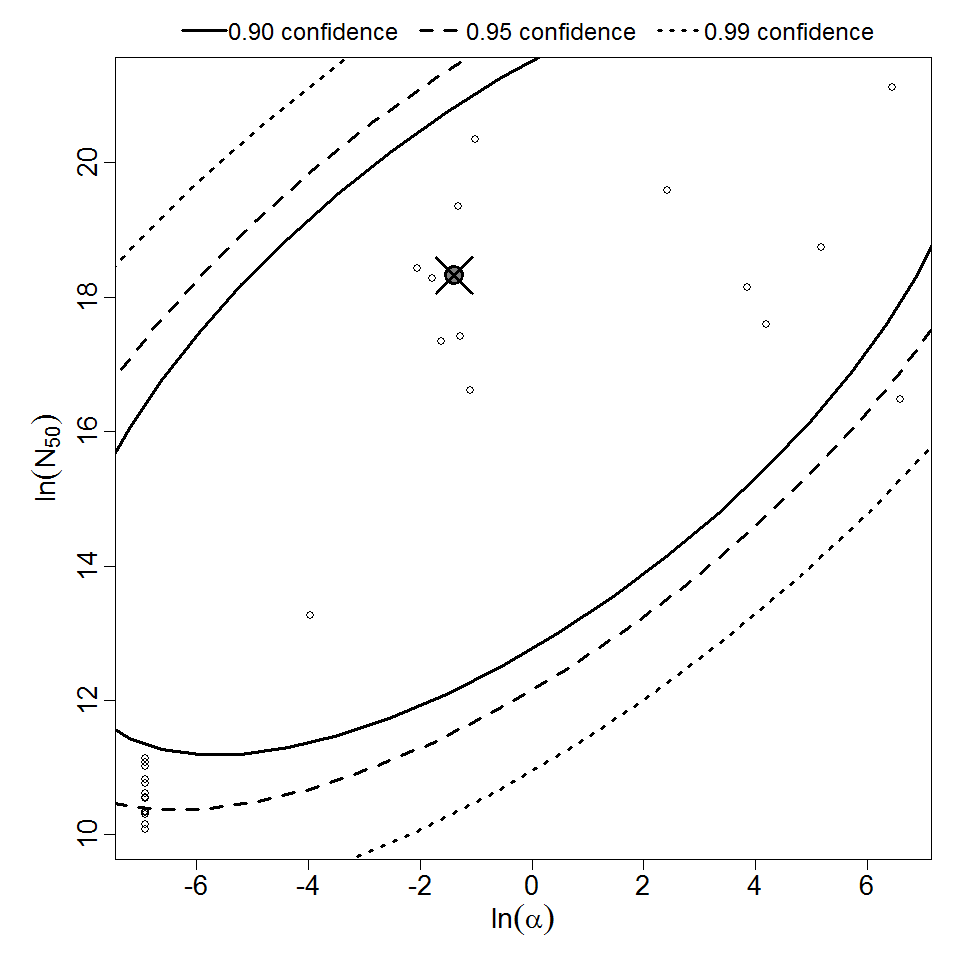
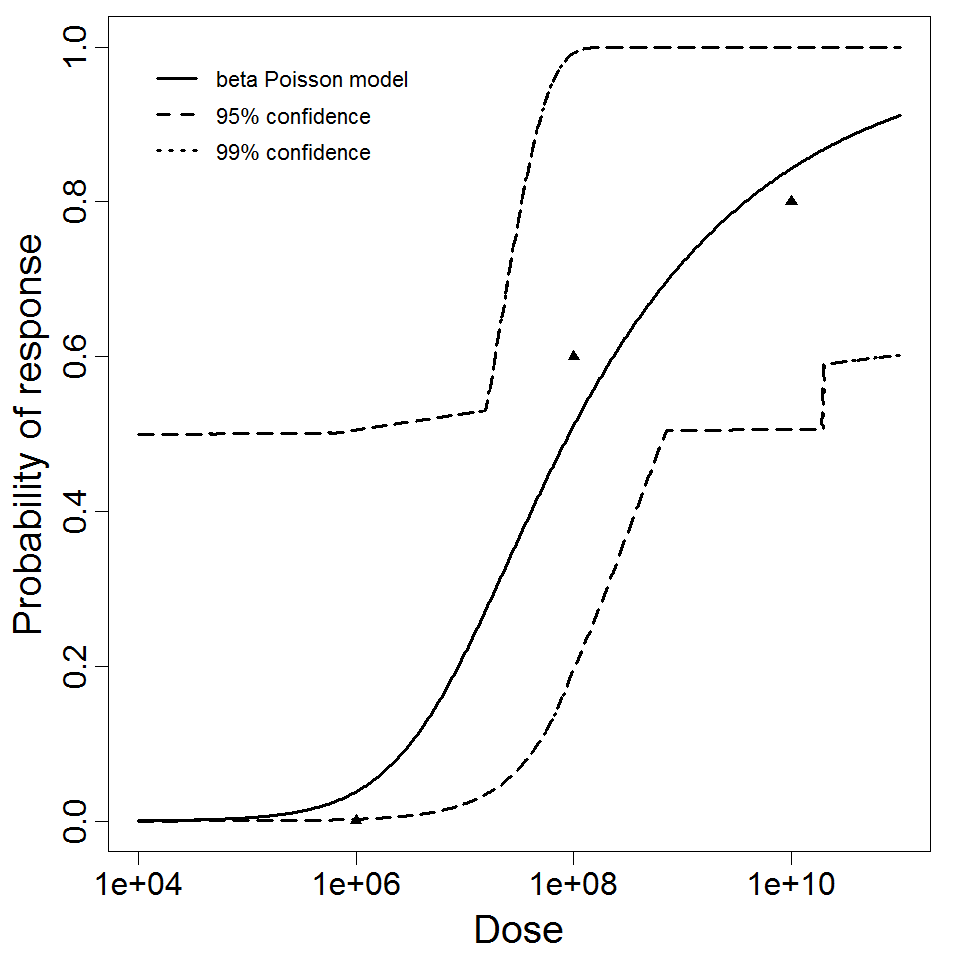
| 165 | oral (in milk) | 3.00 | ETEC 214-4 (ST) | CFU | human | beta-Poisson | 9.1E+07 | a = 2.5E-01 N50 = 9.1E+07 | diarrhea or vomiting |
Levine, M. M., Caplan, E. S., Waterman, D. ., Cash, R. A., Hornick, R. B., & Snyder, M. J. (1977). Diarrhea caused by Escherichia coli that produce only heat-stable enterotoxin. Infection and Immunity, 17, 1. |
| 214, 216, 217 | oral (with NaHCO3) | 8.00 | EPEC B171-8 (serotype O11:NM) | CFU | human | beta-Poisson | 6.85E+07 | a = 2.21E-01 N50 = 6.85E+07 | diarrhea |
Bieber, D. ., Ramer, S. W., C-y, W. ., Murray, W. J., Tobe, T. ., Fernandez, R. ., & Schoolnik, G. K. (1998). Type IV Pili, Transient Bacterial Aggregates, and Virulence of Enteropathogenic Escherichia coli. Science., 280, 5372. |
| 38, 39, 40, 42, 99, 144 | oral (in milk) | 15.00 | ETEC B7A | CFU | human | beta-Poisson | 8.6E+07 | a = 1.78E-01 N50 = 8.6E+07 | mild to severe diarrhea |
DuPont, H. L., Formal, S. B., Hornick, R. B., Snyder, M. J., Libonati, J. P., Sheahan, D. G., … Kalas, J. P. (1971). Pathogenesis of Escherichia coli diarrhea. The New England Journal of Medicine, 285, 1. |
| 38, 42, 99, 165 | oral (in milk) | 11.00 | ETEC B7A | CFU | human | beta-Poisson | 1.28E+08 | a = 2.06E-01 N50 = 1.28E+08 | mild to severe diarrhea |
DuPont, H. L., Formal, S. B., Hornick, R. B., Snyder, M. J., Libonati, J. P., Sheahan, D. G., … Kalas, J. P. (1971). Pathogenesis of Escherichia coli diarrhea. The New England Journal of Medicine, 285, 1. |
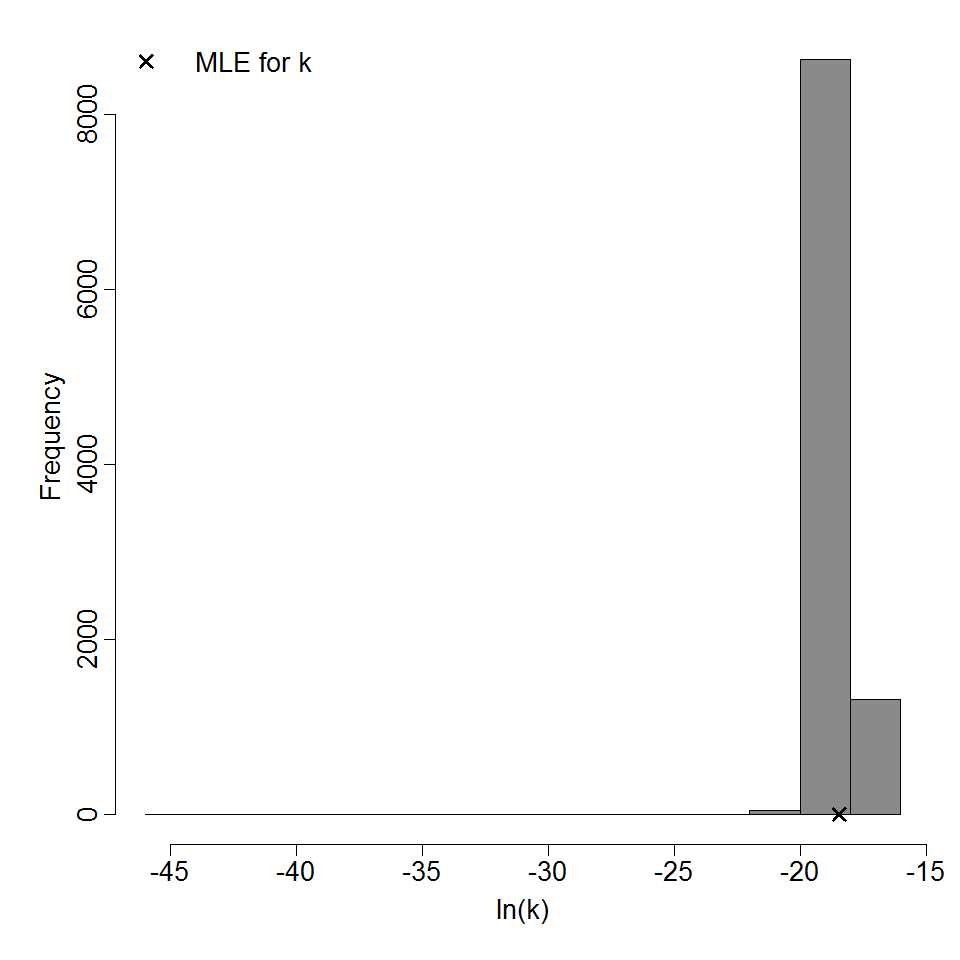
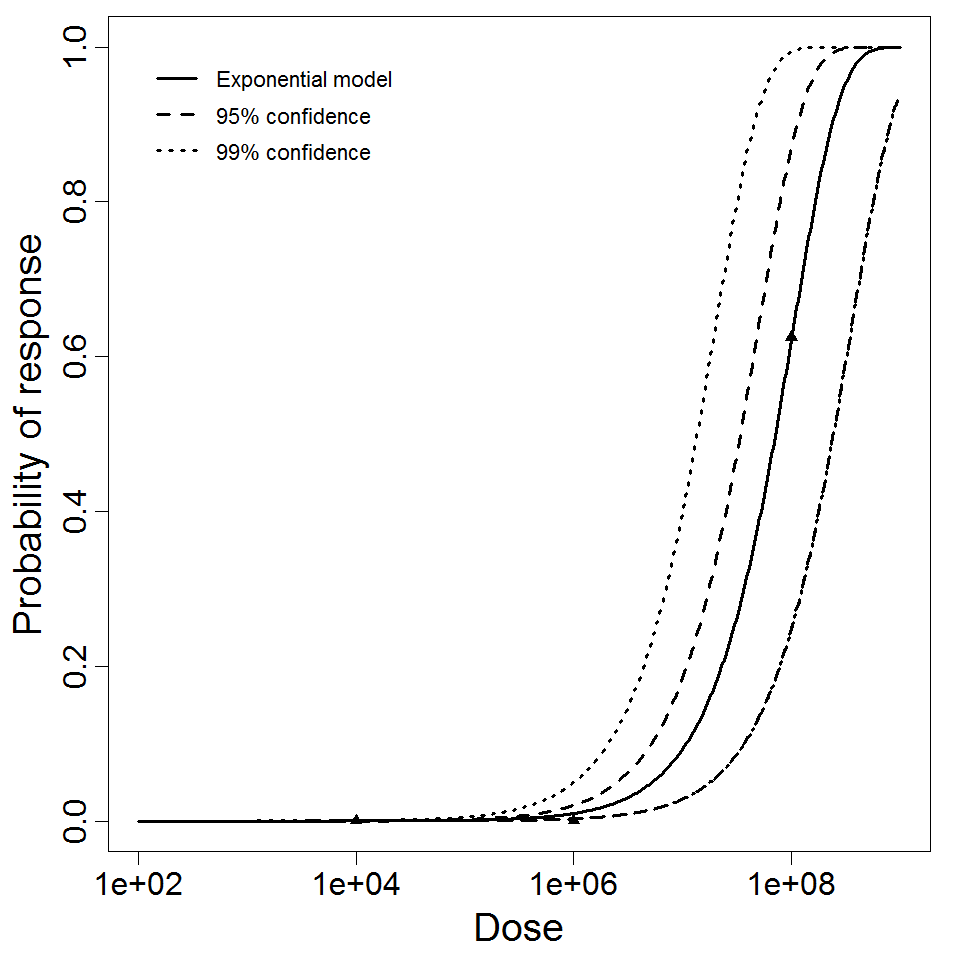
| 39 | oral (in milk) | 3.00 | EIEC 4608 | CFU | human | exponential | 7.14E+07 | k = 9.7E-09 | mild to severe diarrhea |
DuPont, H. L., Formal, S. B., Hornick, R. B., Snyder, M. J., Libonati, J. P., Sheahan, D. G., … Kalas, J. P. (1971). Pathogenesis of Escherichia coli diarrhea. The New England Journal of Medicine, 285, 1. |
| 39, 40 | oral (in milk) | 6.00 | EIEC 4608 | CFU | human | exponential | 6.5E+07 | k = 1.07E-08 | mild to severe diarrhea |
DuPont, H. L., Formal, S. B., Hornick, R. B., Snyder, M. J., Libonati, J. P., Sheahan, D. G., … Kalas, J. P. (1971). Pathogenesis of Escherichia coli diarrhea. The New England Journal of Medicine, 285, 1. |
| 40 | oral (in milk) | 3.00 | EIEC 1624 | CFU | human | exponential | 5.7E+07 | k = 1.22E-08 | mild to severe diarrhea |
DuPont, H. L., Formal, S. B., Hornick, R. B., Snyder, M. J., Libonati, J. P., Sheahan, D. G., … Kalas, J. P. (1971). Pathogenesis of Escherichia coli diarrhea. The New England Journal of Medicine, 285, 1. |
| 42 | oral | 4.00 | ETEC O55 (in paper as “type 55, B5”) | CFU | human | beta-Poisson | 2.05E+05 | a = 8.7E-02 N50 = 2.05E+05 | slight to severe illness |
June, R. ., Ferguson, W. ., & Worfel, M. . (1953). Experiments in feeding adult volunteers with Escherichia coli 55, B5, a coliform organism associated with infant diarrhea. American Journal of Hygiene, 57(2). https://doi.org/10.1093/oxfordjournals.aje.a119570 |
| 43 | oral | 4.00 | ETEC O111 (in paper as "E. coli 111, B4") | CFU | human | beta-Poisson | 3.56E+06 | a = 2.63E-01 N50 = 3.56E+06 | slight to severe illness |
Feeguson, W. W., & June, E. C. (1952). Experiments on Feeding Adult Volunteers with Escherichia Coli 111, B4, a Coliform Organism Associated with Infant Diarrhea. American Journal of Epidemiology, 55, 2. |
| 96, 100, 166 | oral (in milk) | 7.00 | ETEC B7A | CFU | human | beta-Poisson | 1.78E+05 | a = 3.75E-01 N50 = 1.78E+05 | positive stool isolation | |
| 98 | oral (in milk) | 3.00 | EIEC 1624 | CFU | human | beta-Poisson | 2.11E+06 | a = 1.55E-01 N50 = 2.11E+06 | positive stool isolation |
DuPont, H. L., Formal, S. B., Hornick, R. B., Snyder, M. J., Libonati, J. P., Sheahan, D. G., … Kalas, J. P. (1971). Pathogenesis of Escherichia coli diarrhea. The New England Journal of Medicine, 285, 1. |
|
| ||||||||||||||||||||||
| ||||||||||||||||||||||||||||||
|
| ||||||||||||||||||||||
| ||||||||||||||||||||||||||||||
|
| ||||||||||||||||||||||
| ||||||||||||||||||||||||||||||||||||||


|
| ||||||||||||||||||||||
| ||||||||||||||||||||||||||||||
|
| ||||||||||||||||||||||
| ||||||||||||||||||||||||||||||

|
| ||||||||||||||||||||||
| ||||||||||||||||||||||||||||||

|
| ||||||||||||||||||||||
| ||||||||||||||||||||||||||||||
|
| ||||||||||||||||||||||
| ||||||||||||||||||||||||||||||||||||||
|
| ||||||||||||||||||||||
| ||||||||||||||||||||||||||||||||||||||
|
| ||||||||||||||||||||||
| ||||||||||||||||||||||||||||||||||||||

| ||||||||||||||||||||||
| ||||||||||||||||||||||||||||||
|
| ||||||||||||||||||||||
| ||||||||||||||||||||||||||||||

|
| ||||||||||||||||||||||
| ||||||||||||||||||||||||||||||
|
| ||||||||||||||||||||||
| ||||||||||||||||||||||||||||||