General Overview
'Legionella pneumophila (L. pneumophila) causes both Pontiac Fever and an aggressive form of pneumonia. L. pneumophila is a facultative gram negative aerobic rod, commonly found in drinking water distribution systems, cooling tower basin waters, premise plumbing, surface waters, and other engineered water systems.
Legionellosis includes Legionnaires’ disease and a milder febrile illness called Pontiac Fever. Legionnaires’ disease, an atypical pneumonia caused by bacteria of the genus Legionella, is most commonly caused illness by the species L. pneumophila (Lp). Legionnaires' disease has an incubation period commonly cited as of 2 to 10 days from exposure to the appearance of clinical symptoms, but the upper end of the incubation period may be at least 19 days. Symptoms of Legionnaires include: a high fever, chills, headache, muscular pains, dry cough, difficulty breathing and diarrhea, but not all symptoms occur in all in cases. [1]
Summary Data
Muller et al. (1983) exposed outbred, specific pathogen-free, Hartley strain Guinea pigs to aerosols of Legionella Philadelphia 1 strain in a modified aerosol in- fection chamber (Tri-R Instruments, Rockville Centre, N.Y.).[2]
Fitzgeorge et al. (1983) challenged Female Dunkin-Hartley Guinea-pigs with aerosols of Legionella pneumophila Strain 74/81.[3]
Breiman and Horwitz (1987) exposed Hartley strain Guinea pigs to aerosols of Legionella Philadelphia 1 strain in an aerosol chamber constructed of lucite measuring 13 X 24 X 18 in.[4]
Recommended Model
It is recommended that experiment 241 should be used as the best dose response model. Infection as the endpoint is more protective and useful for disease transmission modeling over other endpoints such as illness and death.
Summary
By increasing the number of data points, the pooling narrows the range of the confidence region of the parameter estimates and enhances the statistical precision.
References
- (2005). A quantitative microbial risk assessment model for human inhalation exposure to legionella.
- (1983). Changes in Iron and Transferrin Levels and Body Temperature in Experimental Airborne Legionellosis. The Journal of Infectious Diseases. 147, 2.
- (1983). Aerosol infection of animals with strains of Legionella pneumophila of different virulence: comparison with intraperitoneal and intranasal routes of infection. Epidemiology & Infection. 90,
- (1987). Guinea pigs sublethally infected with aerosolized Legionella pneumophila develop humoral and cell-mediated immune responses and are protected against lethal aerosol challenge. A model for studying host defense against lung infections caused by intracellul. The Journal of Experimental Medicine. 165, 3.
k = 5.99E-02
LD50/ID50 = 1.16E+01
|
|
||||||||||||||||||||||
|
||||||||||||||||||||||||||||||||||||||
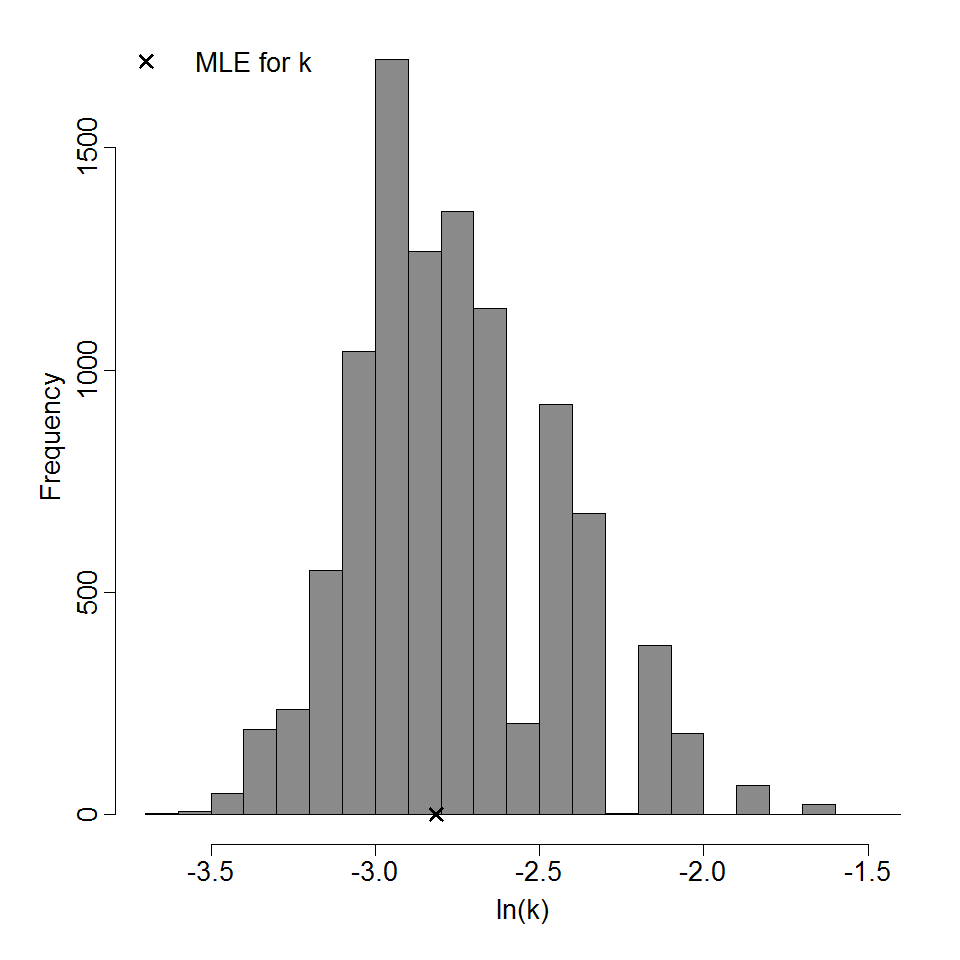
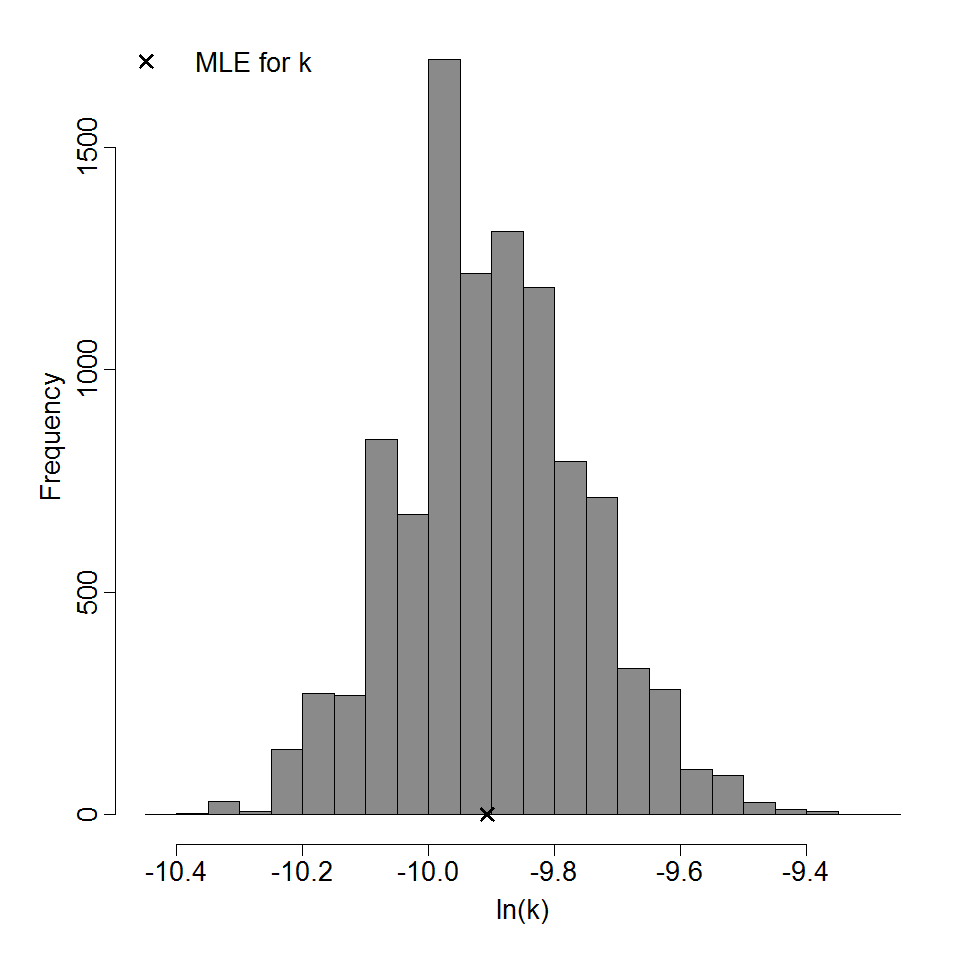
Parameter histogram for exponential model (uncertainty of the parameter)
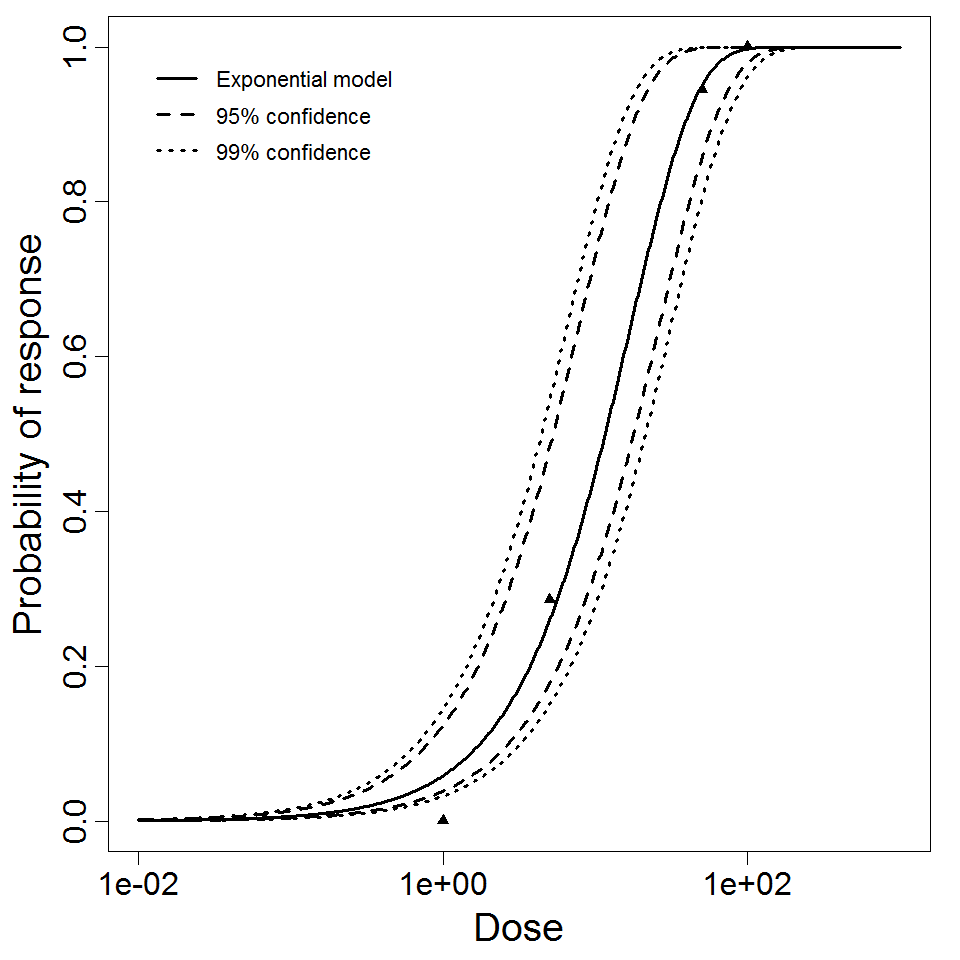
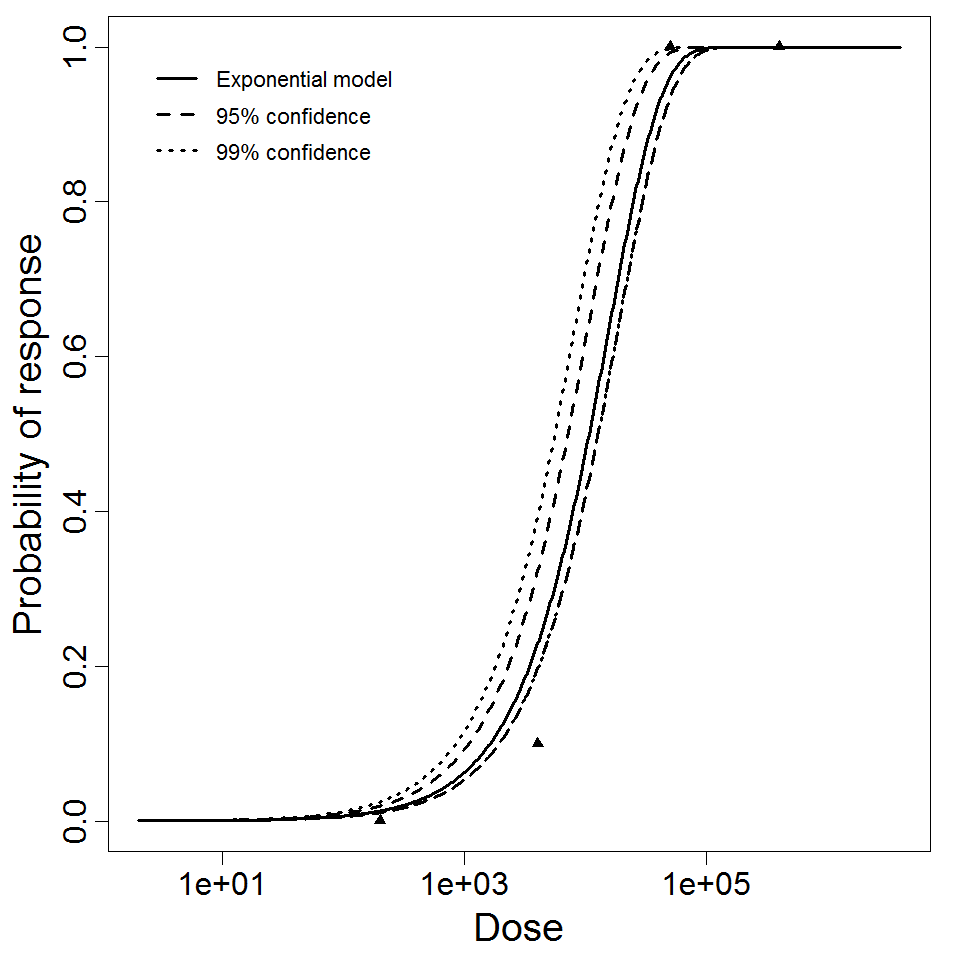
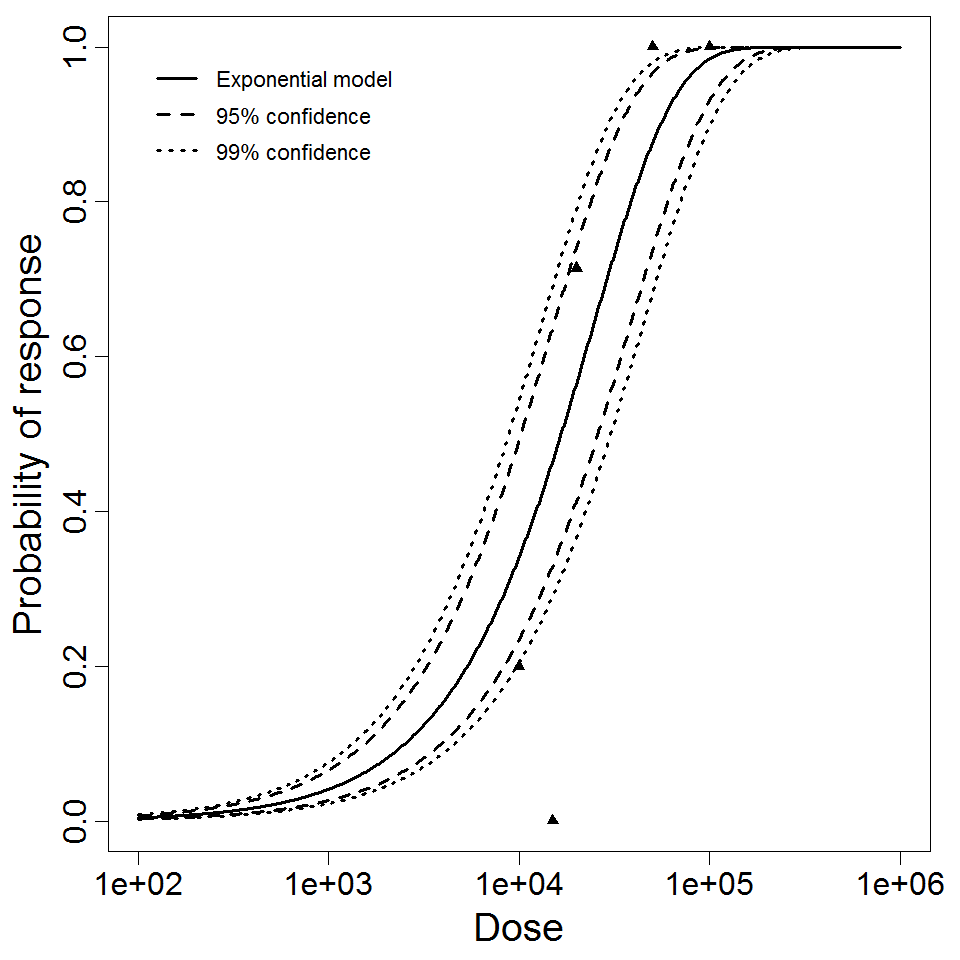
Exponential model plot, with confidence bounds around optimized model
References
k = 6.48E-05
LD50/ID50 = 1.07E+04
|
|
||||||||||||||||||||||
|
||||||||||||||||||||||||||||||||||||||
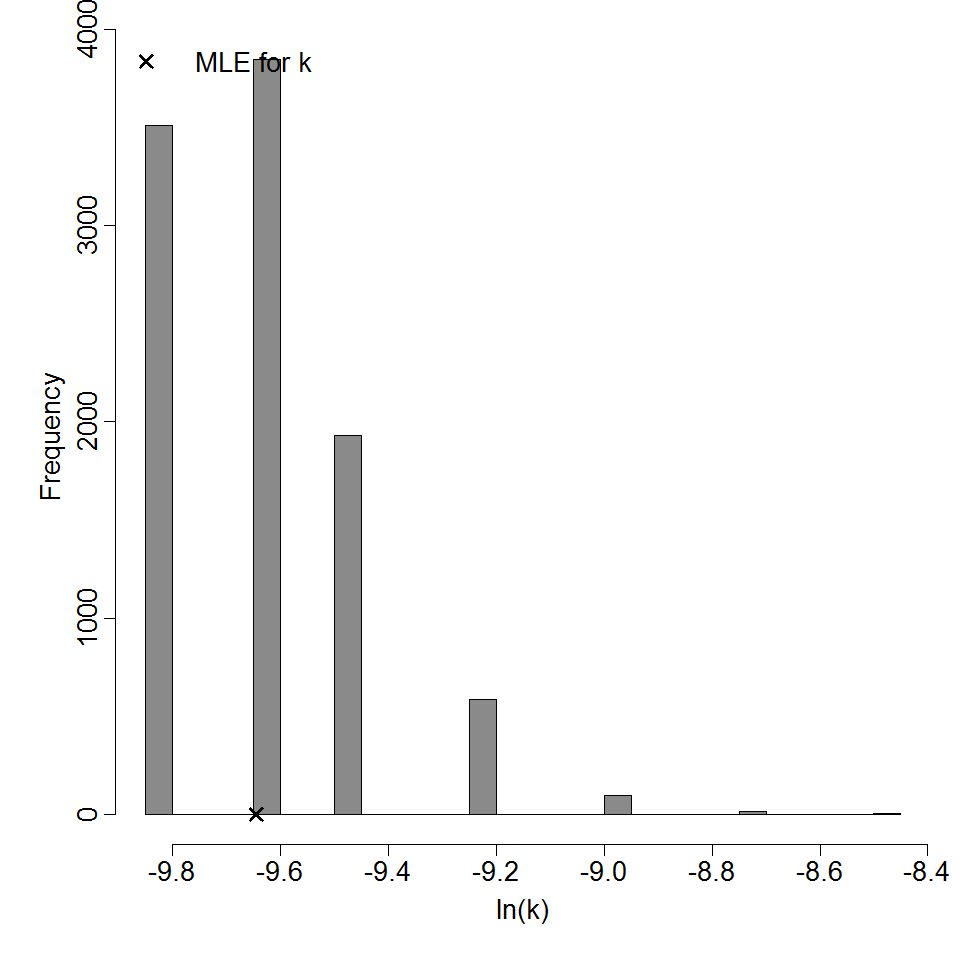
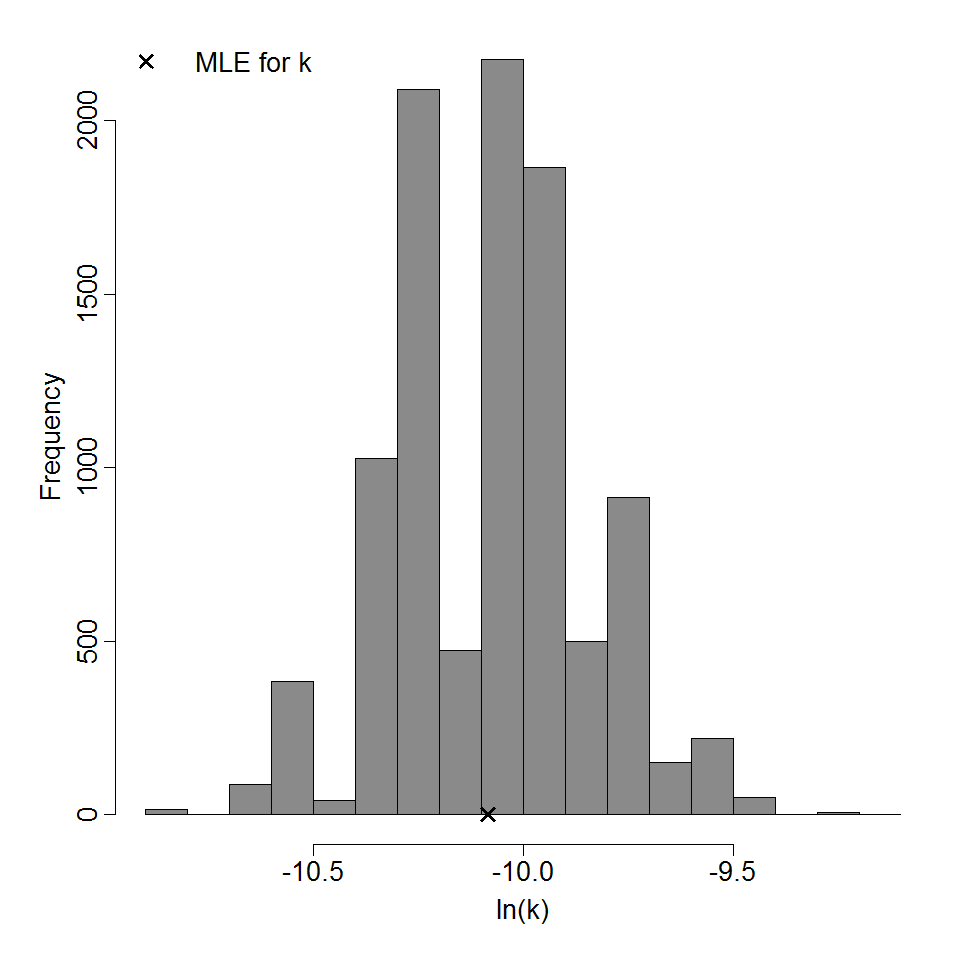
Parameter histogram for exponential model (uncertainty of the parameter)
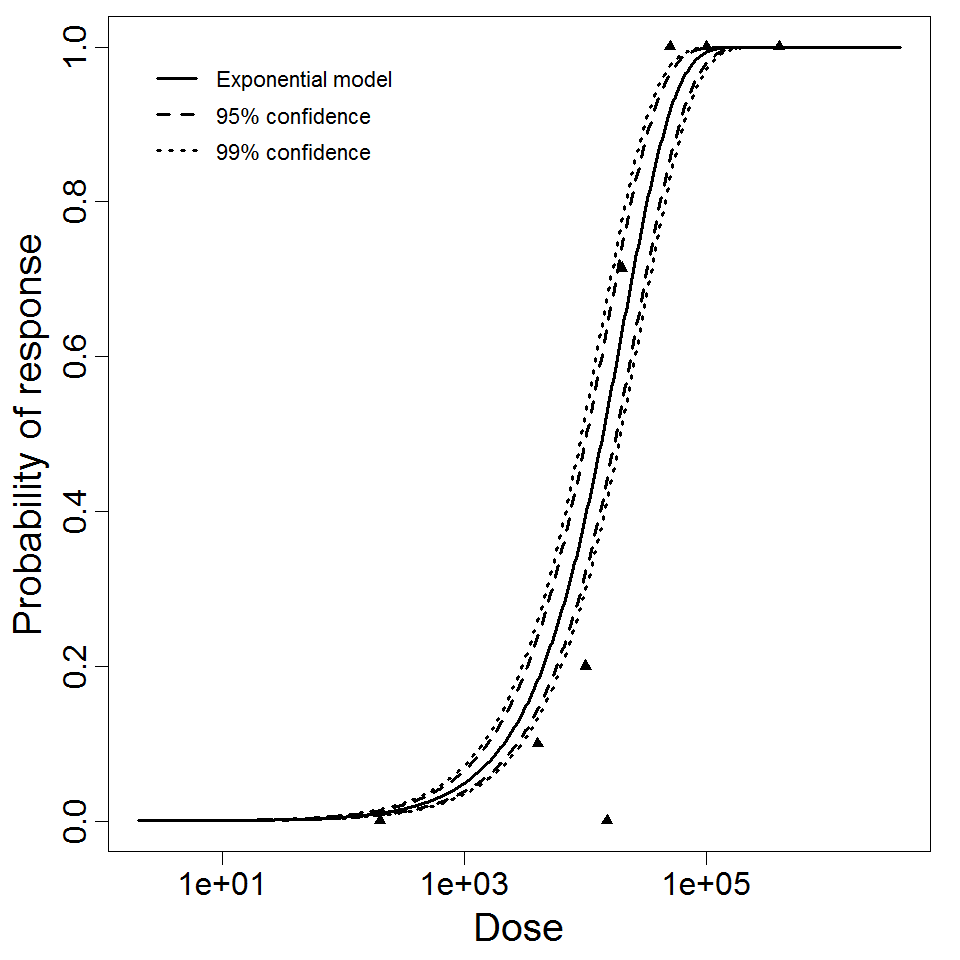
Exponential model plot, with confidence bounds around optimized model
References
k = 4.99E-05
LD50/ID50 = 1.39E+04
|
|
||||||||||||||||||||||
|
||||||||||||||||||||||||||||||||||||||
Parameter histogram for exponential model (uncertainty of the parameter)
Exponential model plot, with confidence bounds around optimized model
References
- (1983). Aerosol infection of animals with strains of Legionella pneumophila of different virulence: comparison with intraperitoneal and intranasal routes of infection. Epidemiology & Infection. 90,
- (1987). Guinea pigs sublethally infected with aerosolized Legionella pneumophila develop humoral and cell-mediated immune responses and are protected against lethal aerosol challenge. A model for studying host defense against lung infections caused by intracellul. The Journal of Experimental Medicine. 165, 3.
k = 4.17E-05
LD50/ID50 = 1.66E+04
|
|
||||||||||||||||||||||
|
||||||||||||||||||||||||||||||||||||||
Parameter histogram for exponential model (uncertainty of the parameter)
Exponential model plot, with confidence bounds around optimized model
References
- (1987). Guinea pigs sublethally infected with aerosolized Legionella pneumophila develop humoral and cell-mediated immune responses and are protected against lethal aerosol challenge. A model for studying host defense against lung infections caused by intracellul. The Journal of Experimental Medicine. 165, 3.