Description
Moredunn isolate data 
Dose Infected Non-infected Total
100 2 2 4
300 2 3 5
1000 1 2 3
3000 3 1 4


Goodness of fit and model selection
Model Deviance Δ Degrees 
of freedom
χ20.95,1 
p-value
χ20.95,m-k 
p-value
Exponential 7.37 6.16 3 3.84 
0.0131
7.81 
0.0611
Beta Poisson 1.21 2 5.99 
0.546
Beta-Poisson fits better than exponential; cannot reject good fit for beta-Poisson.


Optimized parameters for the beta-Poisson model, from 10000 bootstrap iterations
Parameter MLE estimate Percentiles
0.5% 2.5% 5% 95% 97.5% 99.5%
α 1.14E-01 9.79E-04 9.81E-04 9.82E-04 1.17E+03 2.25E+03 5.52E+03
N50 4.55E+02 2.13E-09 2.19E-06 1.55E-05 5.62E+05 3.59E+09 1.43E+16

Parameter scatter plot for beta Poisson model ellipses signify the 0.9, 0.95 and 0.99 confidence of the parameters.

beta Poisson model plot, with confidence bounds around optimized model.

# of Doses
4.00
Μodel
N50
4.55E+02
LD50/ID50
4.55E+02
Dose Units
Response
Exposure Route
Contains Preferred Model
a
1.14E-01
Agent Strain
Moredun isolate
Experiment ID
183
Host type
Description
TU502 data 
Dose Diarrhea Not diarrhea Total
10 2 3 5
30 3 2 5
100 5 2 7
500 3 1 4


Goodness of fit and model selection
Model Deviance Δ Degrees 
of freedom
χ20.95,1 
p-value
χ20.95,m-k 
p-value
Exponential 11.6 11.5 3 3.84 
0.000708
7.81 
0.00894
Beta Poisson 0.119 2 5.99 
0.942
Beta-Poisson fits better than exponential; cannot reject good fit for beta-Poisson.


Optimized parameters for the beta-Poisson model, from 10000 bootstrap iterations
Parameter MLE estimate Percentiles
0.5% 2.5% 5% 95% 97.5% 99.5%
α 2.7E-01 9.83E-04 9.85E-04 2.03E-03 6.60E+00 6.70E+02 3.19E+03
N50 1.68E+01 3.41E-16 9.86E-09 1.68E-06 7.15E+01 9.76E+01 6.59E+02

Parameter scatter plot for beta Poisson model ellipses signify the 0.9, 0.95 and 0.99 confidence of the parameters.

beta Poisson model plot, with confidence bounds around optimized model.

# of Doses
4.00
Μodel
N50
1.68E+01
LD50/ID50
1.68E+01
Dose Units
Response
Exposure Route
Contains Preferred Model
a
2.7E-01
Agent Strain
*C. hominis*, TU502
Experiment ID
181
Host type
Description
UCP isolate 
Dose Infected Non-infected Total
500 3 2 5
1000 2 1 3
5000 2 3 5
1E+04 4 0 4


Goodness of fit and model selection
Model Deviance Δ Degrees 
of freedom
χ20.95,1 
p-value
χ20.95,m-k 
p-value
Exponential 11.5 6.99 3 3.84 
0.0082
7.81 
0.00945
Beta Poisson 4.48 2 5.99 
0.107
Beta-Poisson fits better than exponential; cannot reject good fit for beta-Poisson.


Optimized parameters for the beta-Poisson model, from 10000 bootstrap iterations
Parameter MLE estimate Percentiles
0.5% 2.5% 5% 95% 97.5% 99.5%
α 1.45E-01 9.81E-04 4.63E-03 9.53E-03 1.27E+00 1.46E+02 9.10E+02
N50 1.79E+02 2.74E-13 7.60E-10 4.54E-09 2.62E+03 3.22E+03 6.10E+03

Parameter scatter plot for beta Poisson model ellipses signify the 0.9, 0.95 and 0.99 confidence of the parameters.

beta Poisson model plot, with confidence bounds around optimized model

# of Doses
4.00
Μodel
N50
1.79E+02
LD50/ID50
1.79E+02
Dose Units
Response
Exposure Route
Contains Preferred Model
a
1.45E-01
Agent Strain
UCP isolate
Experiment ID
141
Host type
Description
TAMU data 
Dose Infected Non-infected Total
10 2 1 3
30 2 1 3
100 3 0 3
500 5 0 5


Goodness of fit and model selection
Model Deviance Δ Degrees 
of freedom
χ20.95,1 
p-value
χ20.95,m-k 
p-value
Exponential 1.07 0.21 3 3.84 
0.647
7.81 
0.783
Beta Poisson 0.864 2 5.99 
0.649
Exponential is preferred to beta-Poisson; cannot reject good fit for exponential.


Optimized k parameter for the exponential model, from 10000 bootstrap iterations
Parameter MLE estimate Percentiles
0.5% 2.5% 5% 95% 97.5% 99.5%
k 5.72E-02 1.80E-02 1.92E-02 2.46E-02 2.65E+00 2.65E+00 2.65E+00
ID50/LD50/ETC* 1.21E+01 2.61E-01 2.61E-01 2.61E-01 2.82E+01 3.61E+01 3.84E+01
*Not a parameter of the exponential model; however, it facilitates comparison with other models.

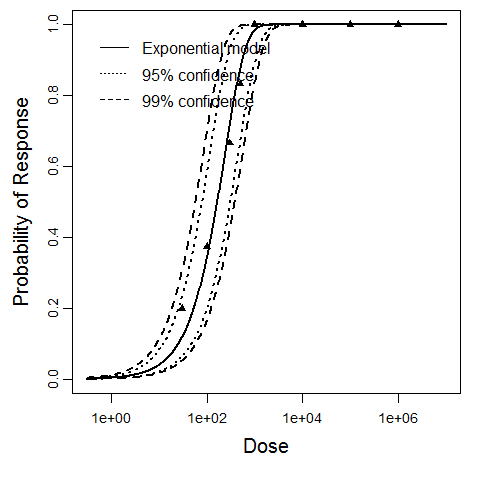
Exponential model plot, with confidence bounds around optimized model

Parameter histogram for exponential model (uncertainty of the parameter)


# of Doses
4.00
Μodel
LD50/ID50
1.21E+01
Dose Units
Response
Exposure Route
Contains Preferred Model
k
5.72E-02
Agent Strain
TAMU isolate
Experiment ID
140
Host type
Description
Iowa isolate data 
Dose Infected Not infected Total
30 2 3 5
100 4 4 8
300 2 1 3
500 5 1 6
1000 2 0 2
1E+04 3 0 3
1E+05 1 0 1
1E+06 1 0 1


Goodness of fit and model selection
Model Deviance Δ Degrees 
of freedom
χ20.95,1 
p-value
χ20.95,m-k 
p-value
Exponential 3.07 2 7 3.84 
0.157
14.1 
0.879
Beta Poisson 1.07 6 12.6 
0.983
Exponential is preferred to beta-Poisson; cannot reject good fit for exponential.


Optimized k parameter for the exponential model, from 10000 bootstrap iterations
Parameter MLE estimate Percentiles
0.5% 2.5% 5% 95% 97.5% 99.5%
k 5.26E-03 2.25E-03 2.75E-03 3.08E-03 1.03E-02 1.19E-02 1.60E-02
ID50/LD50/ETC* 1.32E+02 4.33E+01 5.80E+01 6.72E+01 2.25E+02 2.52E+02 3.08E+02
*Not a parameter of the exponential model; however, it facilitates comparison with other models.

Parameter histogram for exponential model (uncertainty of the parameter)

Exponential model plot, with confidence bounds around optimized model

# of Doses
8.00
Μodel
LD50/ID50
1.32E+02
Dose Units
Response
Exposure Route
Contains Preferred Model
k
5.26E-03
Agent Strain
Iowa isolate
Experiment ID
139
Host type
Description
Iowa strain data 
Dose Infected Non-infected Total
30 1 4 5
100 3 5 8
300 2 1 3
500 5 1 6
1000 2 0 2
1E+04 3 0 3
1E+05 1 0 1
1E+06 1 0 1


Goodness of fit and model selection
Model Deviance Δ Degrees 
of freedom
χ20.95,1 
p-value
χ20.95,m-k 
p-value
Exponential 0.503 0.131 7 3.84 
0.717
14.1 
0.999
Beta Poisson 0.372 6 12.6 
0.999
Exponential is preferred to beta-Poisson; cannot reject good fit for exponential.


Optimized k parameter for the exponential model, from 10000 bootstrap iterations
Parameter MLE estimate Percentiles
0.5% 2.5% 5% 95% 97.5% 99.5%
k 4.19E-03 1.80E-03 2.22E-03 2.46E-03 7.52E-03 8.52E-03 1.12E-02
ID50/LD50/ETC* 1.65E+02 6.17E+01 8.14E+01 9.22E+01 2.82E+02 3.12E+02 3.84E+02
*Not a parameter of the exponential model; however, it facilitates comparison with other models.
Parameter histogram for exponential model (uncertainty of the parameter)
Exponential model plot, with confidence bounds around optimized model
# of Doses
8.00
Μodel
LD50/ID50
1.65E+02
Dose Units
Response
Exposure Route
Contains Preferred Model
k
4.19E-03
Agent Strain
Iowa strain
Experiment ID
108
Host type
Experiment Dataset