Description
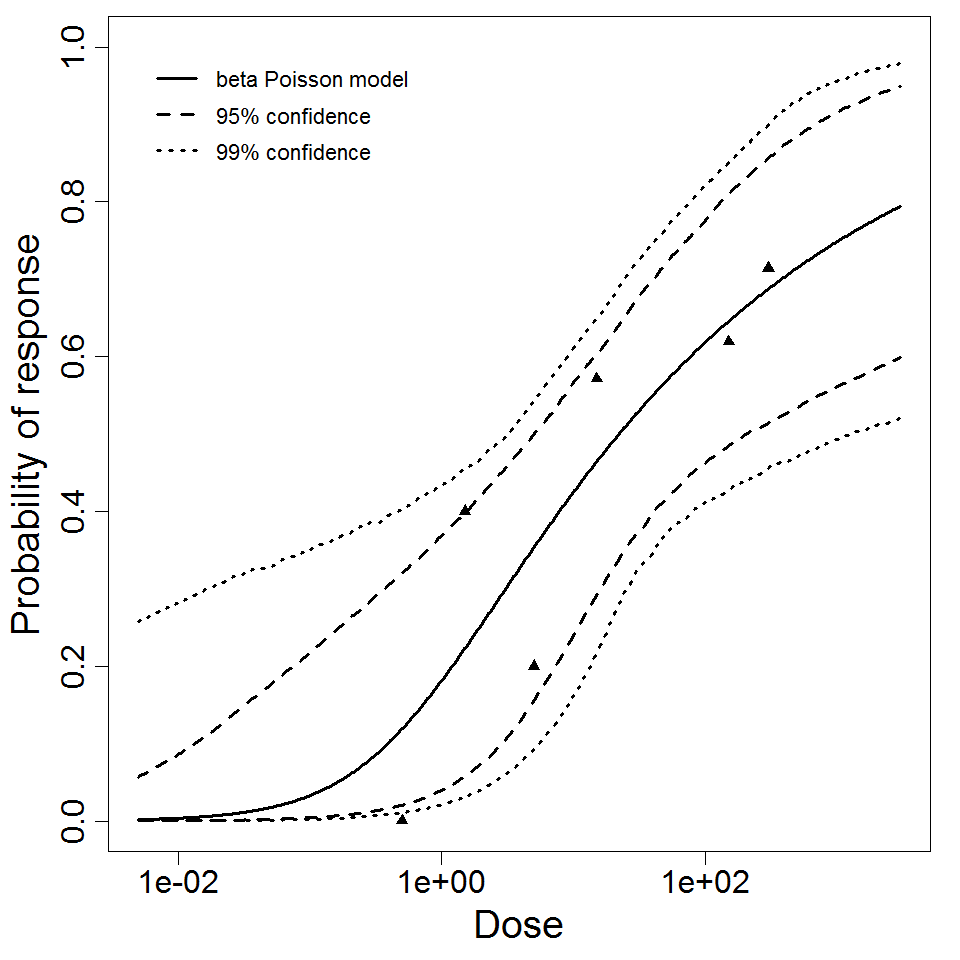
human/type 39 strain SF 299 model data 
Dose Infected Non-infected Total
0.05 0 11 11
0.15 2 7 9
0.5 8 16 24
5 5 11 16
50 47 15 62


Goodness of fit and model selection
Model Deviance Δ Degrees 
of freedom
χ20.95,1 
p-value
χ20.95,m-k 
p-value
Exponential 50.3 44.3 4 3.84 
2.76e-11
9.49 
3.06e-10
Beta Poisson 6.01 3 7.81 
0.111
Beta-Poisson fits better than exponential; cannot reject good fit for beta-Poisson.


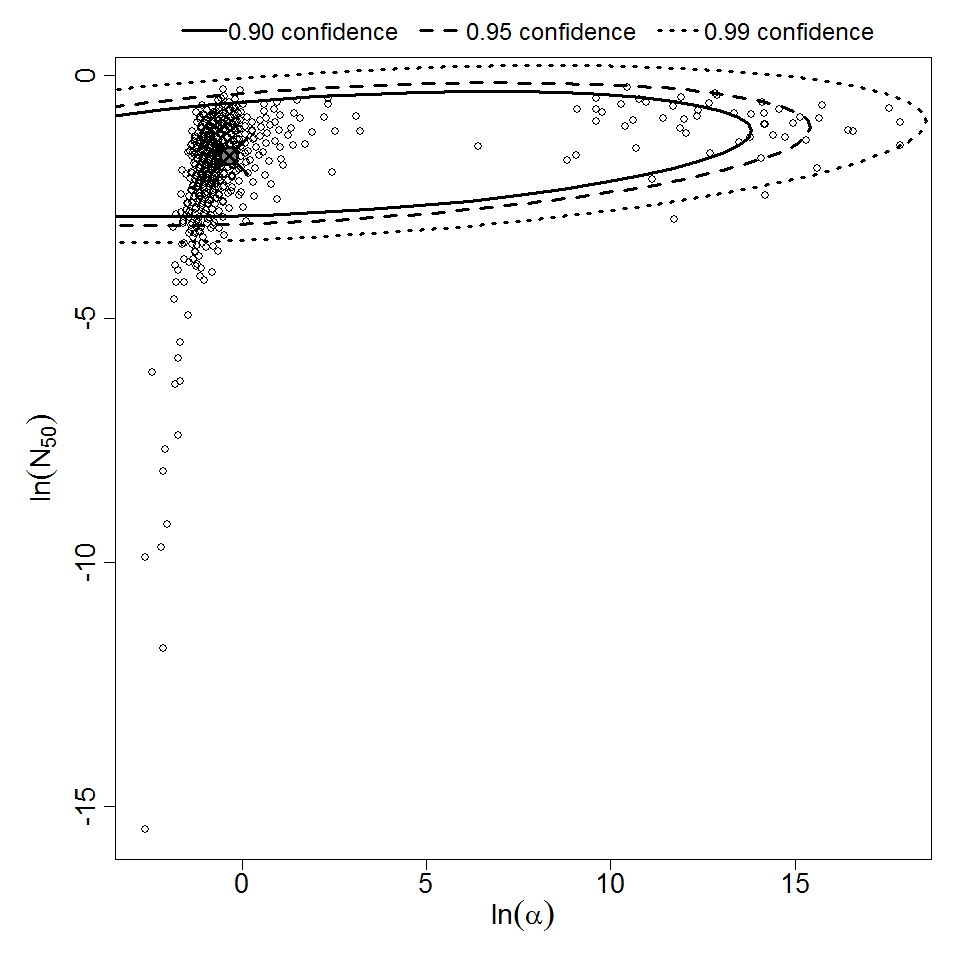
Optimized parameters for the beta-Poisson model, from 10000 bootstrap iterations
Parameter MLE estimate Percentiles
0.5% 2.5% 5% 95% 97.5% 99.5%
α 2.24E-01 9.88E-04 1.40E-01 1.53E-01 3.71E-01 4.27E-01 7.63E-01
N50 3.29E+00 1.90E-02 1.34E+00 1.59E+00 7.67E+00 9.27E+00 1.59E+01


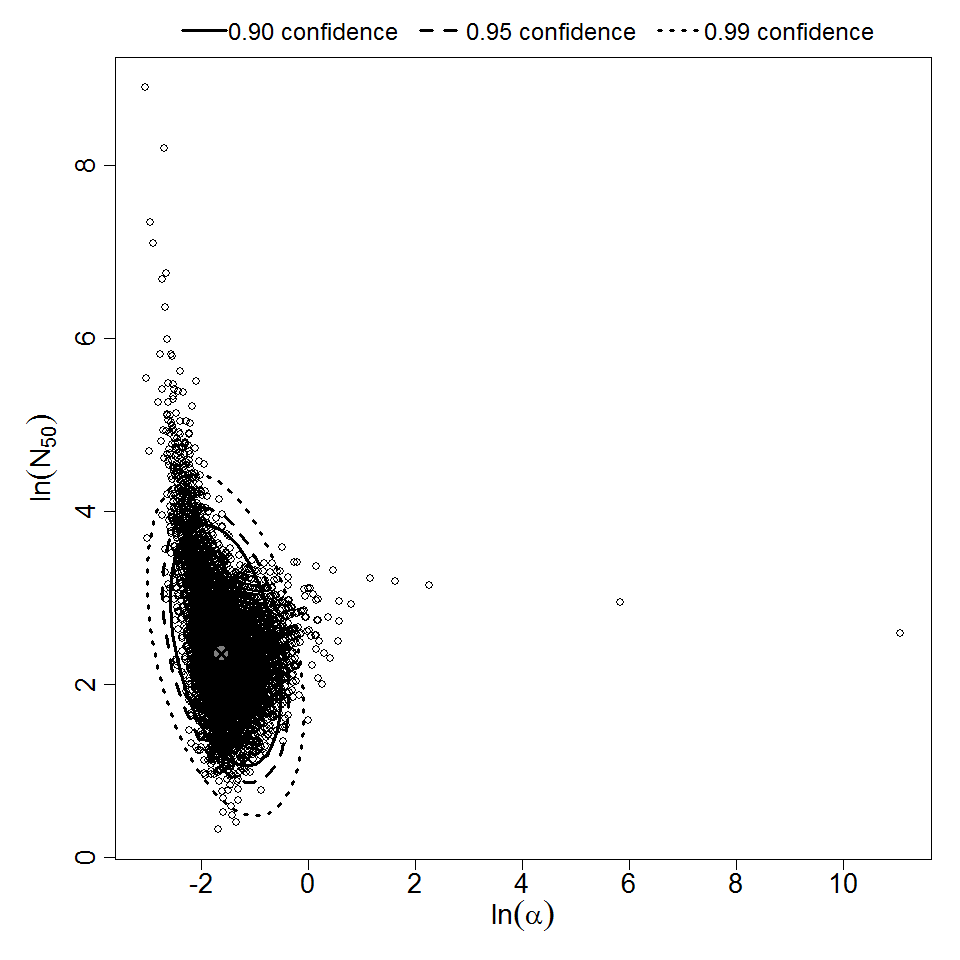
Parameter scatter plot for beta Poisson model ellipses signify the 0.9, 0.95 and 0.99 confidence of the parameters.

beta Poisson model plot, with confidence bounds around optimized model

# of Doses
6.00
Μodel
N50
1.81E+00
LD50/ID50
1.81E+00
Dose Units
Response
Exposure Route
Contains Preferred Model
a
2.21E-01
Agent Strain
type 39
Experiment ID
65
Host type
Description
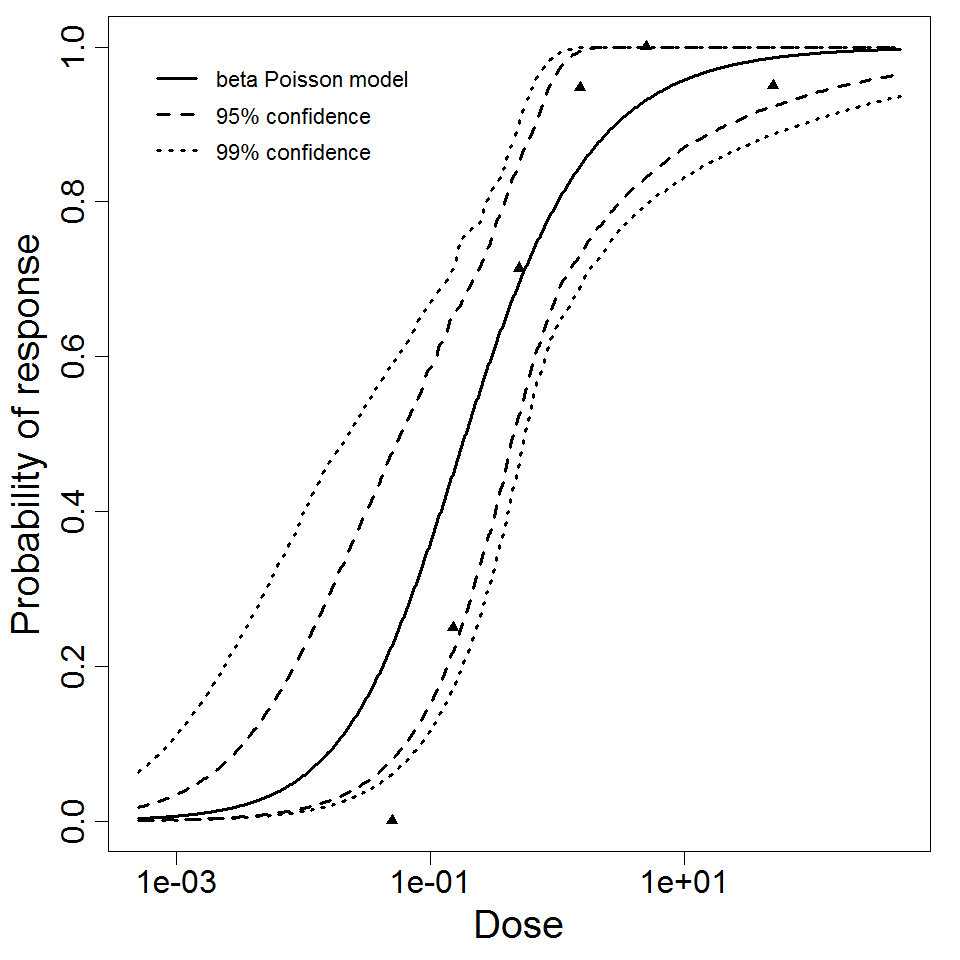
human/type 14 strain SF 765model data 
Dose Infected Non-infected Total
0.5 1 8 9
1.5 4 6 10
5 4 6 10
15 6 4 10
150 27 13 40
300 10 2 12


Goodness of fit and model selection
Model Deviance Δ Degrees 
of freedom
χ20.95,1 
p-value
χ20.95,m-k 
p-value
Exponential 51.8 50.2 5 3.84 
1.42e-12
11.1 
5.8e-10
Beta Poisson 1.68 4 9.49 
0.794
Beta-Poisson fits better than exponential; cannot reject good fit for beta-Poisson.


Optimized parameters for the beta-Poisson model, from 10000 bootstrap iterations
Parameter MLE estimate Percentiles
0.5% 2.5% 5% 95% 97.5% 99.5%
α 2.01E-01 7.76E-02 1.07E-01 1.22E-01 3.36E-01 3.69E-01 4.61E-01
N50 9.22E+00 1.41E+00 2.57E+00 3.40E+00 2.47E+01 3.14E+01 5.26E+01


Parameter scatter plot for beta Poisson model ellipses signify the 0.9, 0.95 and 0.99 confidence of the parameters.

beta Poisson model plot, with confidence bounds around optimized model

# of Doses
6.00
Μodel
N50
9.22E+00
LD50/ID50
9.22E+00
Dose Units
Response
Exposure Route
Contains Preferred Model
a
2.01E-01
Agent Strain
type 14
Experiment ID
64
Host type
Description
Chimpanzee data(Poliovirus type2) 
Dose INFECTED NON-INFECTED Total
15800 0 2 2
1580000 1 2 3
1.58E+07 5 3 8


Goodness of fit and model selection
Model Deviance Δ Degrees 
of freedom
χ20.95,1 
p-value
χ20.95,m-k 
p-value
Exponential 1.21 1.17 2 3.84 
0.279
5.99 
0.547
Beta Poisson 0.0337 1 3.84 
0.854
Exponential is preferred to beta-Poisson; cannot reject good fit for exponential.


Optimized k parameter for the exponential model, from 10000 bootstrap iterations
Parameter MLE estimate Percentiles
0.5% 2.5% 5% 95% 97.5% 99.5%
k 7.18E-08 1.75E-08 2.65E-08 2.84E-08 1.75E-07 2.12E-07 6.87E-07
ID50/LD50/ETC* 9.66E+06 1.01E+06 3.28E+06 3.97E+06 2.44E+07 2.62E+07 3.96E+07
*Not a parameter of the exponential model; however, it facilitates comparison with other models.


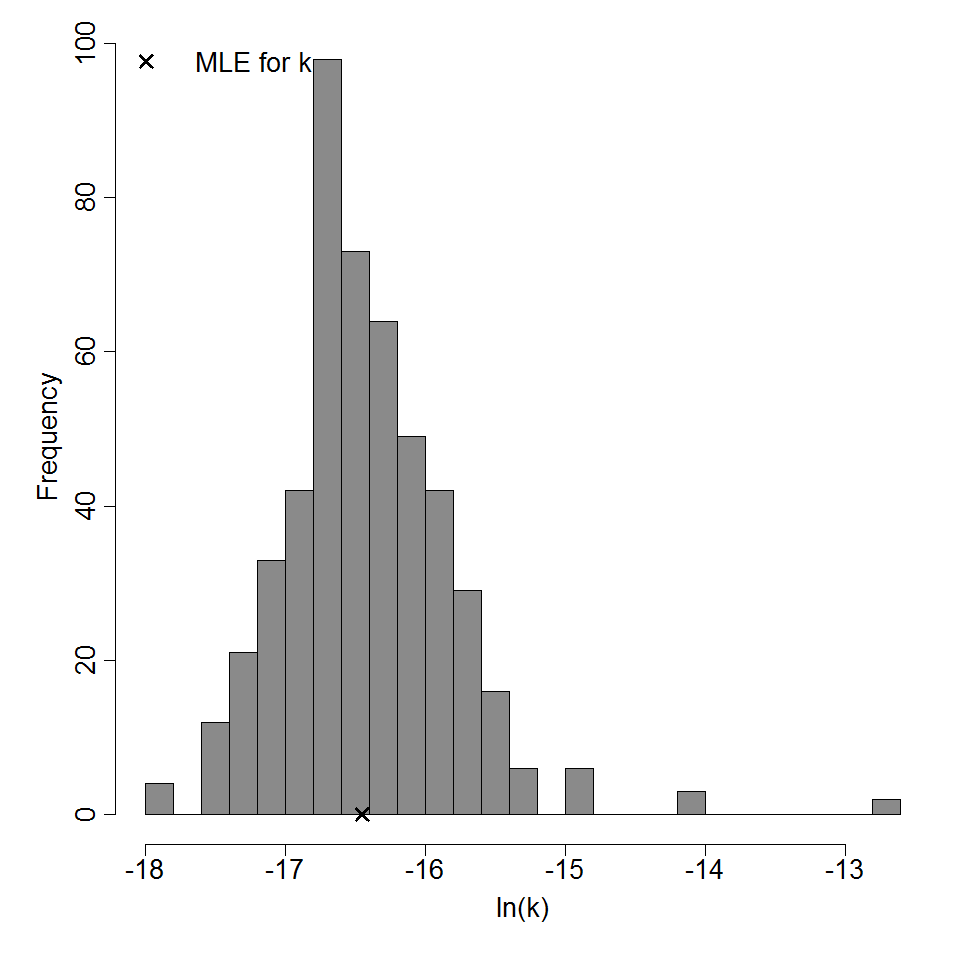
Parameter histogram for exponential model (uncertainty of the parameter)
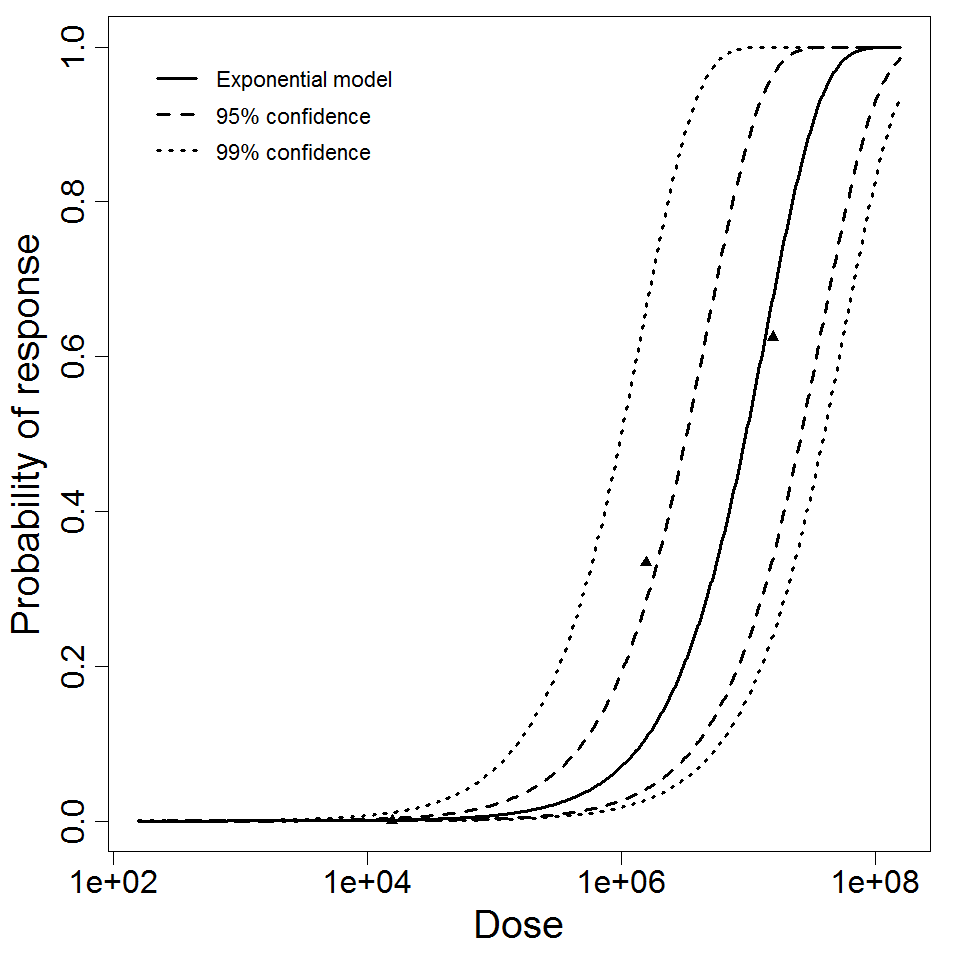
Exponential model plot, with confidence bounds around optimized model

# of Doses
3.00
Μodel
LD50/ID50
9.66E+06
Dose Units
Exposure Route
Contains Preferred Model
k
7.18E-08
Agent Strain
type 2,attenuated
Experiment ID
59
Host type
Description
TITLE 
Dose INFECTION NOT

INFECTION || Total

0.05 0 4 4
0.15 1 4 5
0.5 3 14 17
1.5 4 10 14
5 4 11 15
50 28 14 42
Goodness of fit and model selection
Model Deviance Δ Degrees 
of freedom
χ20.95,1 
p-value
χ20.95,m-k 
p-value
Exponential 29.2 26.2 5 3.84 
{{{pbPbetter}}}
11.1 
2.16e-05
Beta Poisson 2.93 4 9.49 
0

selection

Beta-Poisson fits better than exponential; cannot reject good fit for beta-Poisson.
Optimized parameters for the beta-Poisson model, from 10000 bootstrapiterations
Parameter MLE estimate Percentiles
0.5% 2.5% 5% 95% 97.5% 99.5%
α 2E-01 7.86E-02 9.79E-02 1.11E-01 4.65E-01 5.58E-01 8.66E-01
N50 1.05E+01 3.00E+00 3.98E+00 4.65E+00 3.67E+01 5.32E+01 1.22E+02

Parameter scatter plot for beta Poisson model ellipses signify the 0.9, 0.95 and 0.99 confidence of the parameters.
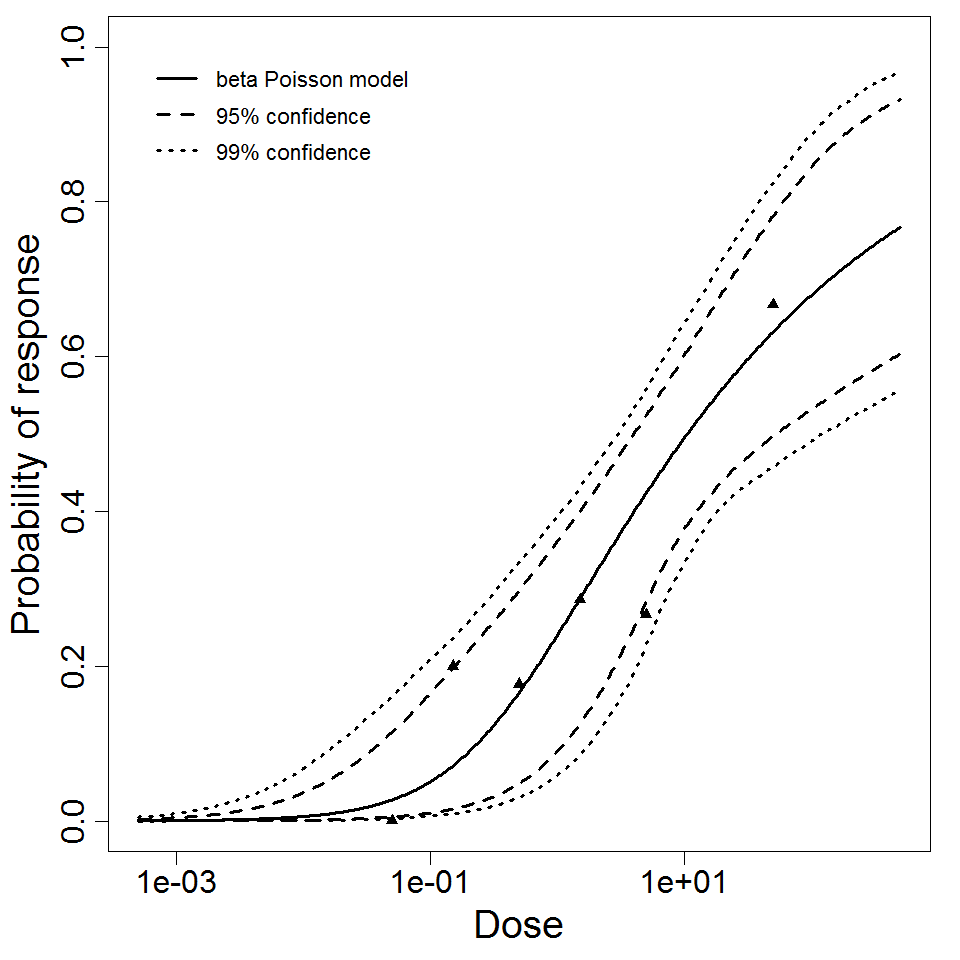
beta Poisson model plot, with confidence bounds around optimized model

# of Doses
6.00
Μodel
N50
1.05E+01
LD50/ID50
1.05E+01
Dose Units
Response
Exposure Route
Contains Preferred Model
a
2,00E-01
Agent Strain
type 39
Experiment ID
313
Host type
Description
TITLE 
Dose INFECTION NOT

INFECTION || Total

0.05 0 4 4
0.15 1 4 5
0.5 0 4 4
0.5 3 14 17
1.5 2 3 5
1.5 4 10 14
5 1 4 5
5 4 11 15
15 4 3 7
50 28 14 42
150 13 8 21
300 5 2 7

"

Goodness of fit and model selection
Model Deviance Δ Degrees 
of freedom
χ20.95,1 
p-value
χ20.95,m-k 
p-value
Exponential 78.6 72.3 11 3.84 
{{{pbPbetter}}}
19.7 
2.8e-12
Beta Poisson 6.22 10 18.3 
0.796
{{{interpretation}}}

"

Optimized parameters for the beta-Poisson model, from 10000 bootstrapiterations
Parameter MLE estimate Percentiles
0.5% 2.5% 5% 95% 97.5% 99.5%
α 1.82E-01 1.04E-03 1.03E-01 1.14E-01 3.04E-01 3.38E-01 4.09E-01
N50 1.38E+01 2.98E+00 5.64E+00 6.67E+00 3.77E+01 4.98E+01 1.32E+02

Parameter scatter plot for beta Poisson model ellipses signify the 0.9, 0.95 and 0.99 confidence of the parameters.

beta Poisson model plot, with confidence bounds around optimized model

# of Doses
12.00
Μodel
N50
1.38E+01
LD50/ID50
1.38E+01
Dose Units
Response
Exposure Route
Contains Preferred Model
a
1.82E-01
Agent Strain
type 14
Experiment ID
312, 313
Host type
Description
TITLE 
Dose INFECTION NOT

INFECTION || Total

0.5 0 4 4
1.5 2 3 5
5 1 4 5
15 4 3 7
150 13 8 21
300 5 2 7
Goodness of fit and model selection
Model Deviance Δ Degrees 
of freedom
χ20.95,1 
p-value
χ20.95,m-k 
p-value
Exponential 24.3 21.5 5 3.84 
{{{pbPbetter}}}
11.1 
0.000194
Beta Poisson 2.77 4 9.49 
0

selection

Beta-Poisson fits better than exponential; cannot reject good fit for beta-Poisson.
Optimized parameters for the beta-Poisson model, from 10000 bootstrapiterations
Parameter MLE estimate Percentiles
0.5% 2.5% 5% 95% 97.5% 99.5%
α 1.81E-01 3.92E-02 7.30E-02 9.02E-02 4.00E-01 4.79E-01 7.28E-01
N50 2.22E+01 3.12E+00 5.01E+00 6.38E+00 1.22E+02 2.06E+02 1.26E+03

Parameter scatter plot for beta Poisson model ellipses signify the 0.9, 0.95 and 0.99 confidence of the parameters.

beta Poisson model plot, with confidence bounds around optimized model

# of Doses
6.00
Μodel
N50
2.22E+01
LD50/ID50
2.22E+01
Dose Units
Response
Exposure Route
Contains Preferred Model
a
1.81E-01
Agent Strain
type 14
Experiment ID
312
Host type
Description

Optimization Output for experiment 311

TITLE 
Dose INFECTION NOT

INFECTION || Total

0.05 0 2 2
0.15 1 3 4
0.5 5 2 7
1.5 18 1 19
5 1 0 1
50 19 1 20
Goodness of fit and model selection
Model Deviance Δ Degrees 
of freedom
χ20.95,1 
p-value
χ20.95,m-k 
p-value
Exponential 61.7 56.8 5 3.84 
{{{pbPbetter}}}
11.1 
5.32e-12
Beta Poisson 4.95 4 9.49 
0

selection

Beta-Poisson fits better than exponential; cannot reject good fit for beta-Poisson.
Optimized parameters for the beta-Poisson model, from 10000 bootstrapiterations
Parameter MLE estimate Percentiles
0.5% 2.5% 5% 95% 97.5% 99.5%
α 7.01E-01 2.29E-01 3.14E-01 3.63E-01 1.81E+06 3.82E+06 1.41E+07
N50 1.9E-01 2.27E-02 5.85E-02 7.93E-02 4.20E-01 4.52E-01 5.56E-01

Parameter scatter plot for beta Poisson model ellipses signify the 0.9, 0.95 and 0.99 confidence of the parameters.

beta Poisson model plot, with confidence bounds around optimized model

# of Doses
6.00
Μodel
N50
1.9E-01
LD50/ID50
1.9E-01
Dose Units
Response
Exposure Route
Contains Preferred Model
a
7.01E-01
Agent Strain
type 39
Experiment ID
311
Host type
Description
TITLE 
Dose INFECTION NOT

INFECTION || Total

0.5 1 4 5
1.5 2 3 5
5 3 2 5
15 2 1 3
150 14 5 19
300 5 0 5
Goodness of fit and model selection
Model Deviance Δ Degrees 
of freedom
χ20.95,1 
p-value
χ20.95,m-k 
p-value
Exponential 29.7 27.3 5 3.84 
{{{pbPbetter}}}
11.1 
1.71e-05
Beta Poisson 2.42 4 9.49 
0

selection

Beta-Poisson fits better than exponential; cannot reject good fit for beta-Poisson.
Optimized parameters for the beta-Poisson model, from 10000 bootstrapiterations
Parameter MLE estimate Percentiles
0.5% 2.5% 5% 95% 97.5% 99.5%
α 2.52E-01 9.79E-04 9.14E-02 1.16E-01 5.50E-01 6.41E-01 1.06E+00
N50 3.83E+00 9.08E-03 3.23E-01 6.41E-01 1.48E+01 2.04E+01 8.86E+01

Parameter scatter plot for beta Poisson model ellipses signify the 0.9, 0.95 and 0.99 confidence of the parameters.

beta Poisson model plot, with confidence bounds around optimized model

# of Doses
6.00
Μodel
N50
3.83E+00
LD50/ID50
3.83E+00
Dose Units
Response
Exposure Route
Contains Preferred Model
a
2.52E-01
Agent Strain
type 14
Experiment ID
310
Host type
Description
Humans/ type 4 Strain model data 
Dose Infected Non-infected Total
1 1 2 3
5 3 0 3
11 3 0 3
1000 6 0 6


Goodness of fit and model selection
Model Deviance Δ Degrees 
of freedom
χ20.95,1 
p-value
χ20.95,m-k 
p-value
Exponential 0.487 -0.000723 3 3.84 
1
7.81 
0.922
Beta Poisson 0.488 2 5.99 
0.784
Exponential is preferred to beta-Poisson; cannot reject good fit for exponential.


Optimized k parameter for the exponential model, from 10000 bootstrap iterations
Parameter MLE estimate Percentiles
0.5% 2.5% 5% 95% 97.5% 99.5%
k 6.07E-01 3.87E-01 3.87E-01 3.87E-01 1.13E+00 1.13E+00 1.13E+00
ID50/LD50/ETC* 1.14E+00 6.11E-01 6.11E-01 6.11E-01 1.79E+00 1.79E+00 1.79E+00
*Not a parameter of the exponential model; however, it facilitates comparison with other models.


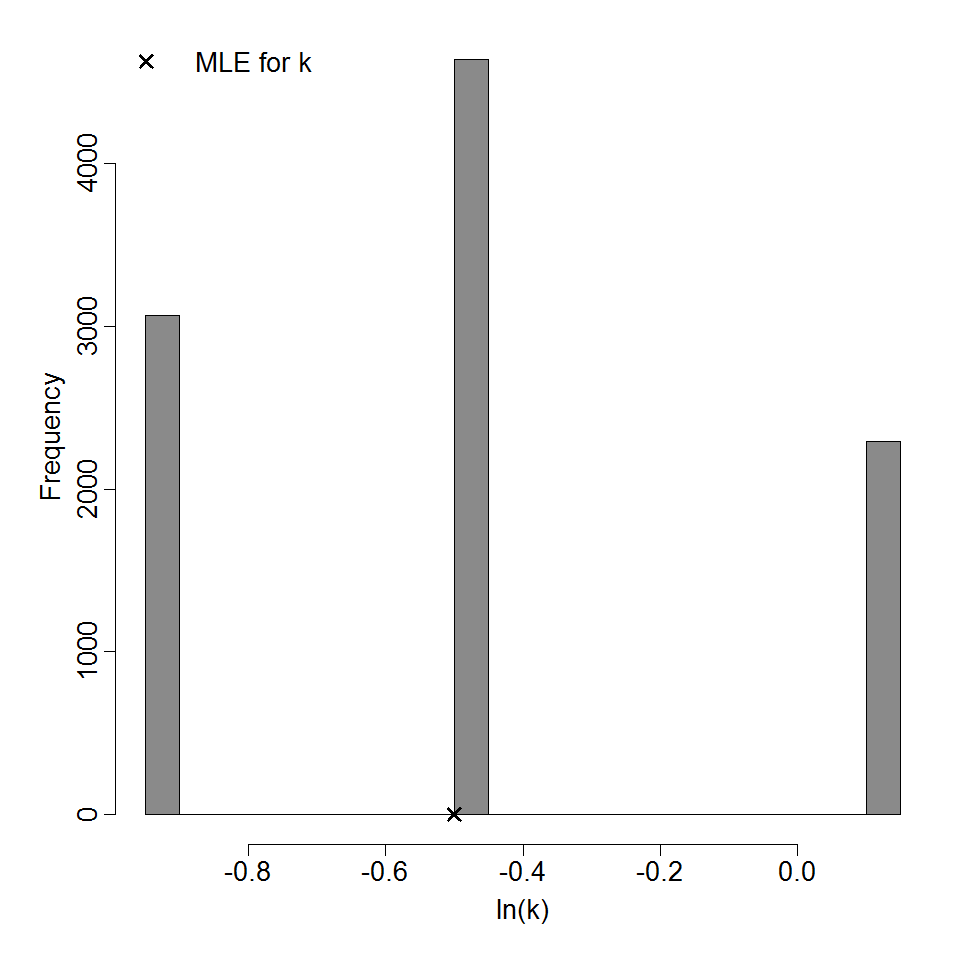
Parameter histogram for exponential model (uncertainty of the parameter)
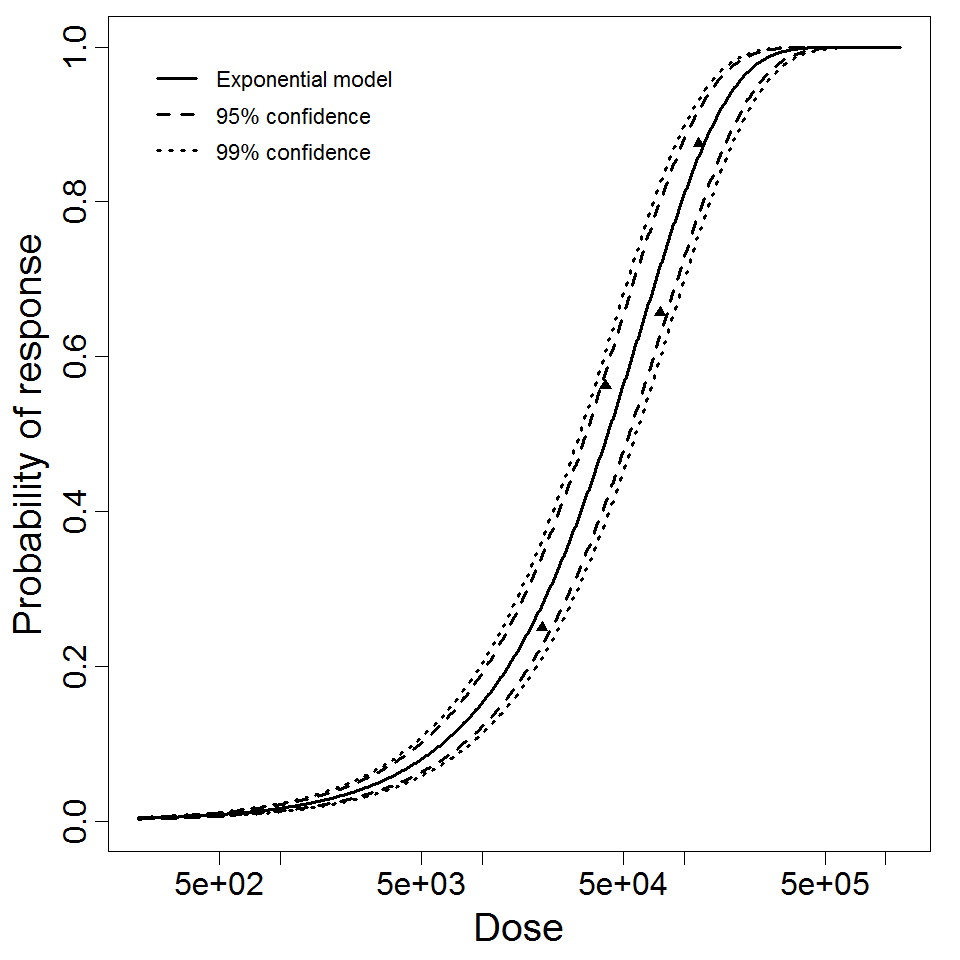
Exponential model plot, with confidence bounds around optimized model

# of Doses
4.00
Μodel
LD50/ID50
1.14E+00
Dose Units
Response
Exposure Route
Contains Preferred Model
k
6.07E-01
Agent Strain
type 4
Experiment ID
31
Host type
Description
human/H3N2, A/Washington/897/80 attenuated strain model data [3]
Dose Infected Non-infected Total
1E+05 2 10 12
1E+06 8 5 13
1E+07 16 3 19
31622777 16 4 20
1E+08 19 0 19


Goodness of fit and model selection
Model Deviance Δ Degrees 
of freedom
χ20.95,1 
p-value
χ20.95,m-k 
p-value
Exponential 39.1 34.8 4 3.84 
3.66e-09
9.49 
6.79e-08
Beta Poisson 4.26 3 7.81 
0.235
Beta-Poisson fits better than exponential; cannot reject good fit for beta-Poisson.


Optimized parameters for the beta-Poisson model, from 10000 bootstrap iterations
Parameter MLE estimate Percentiles
0.5% 2.5% 5% 95% 97.5% 99.5%
α 4.29E-01 2.14E-01 2.58E-01 2.83E-01 7.58E-01 8.71E-01 1.20E+00
N50 6.66E+05 1.36E+05 2.19E+05 2.68E+05 1.63E+06 1.87E+06 2.49E+06


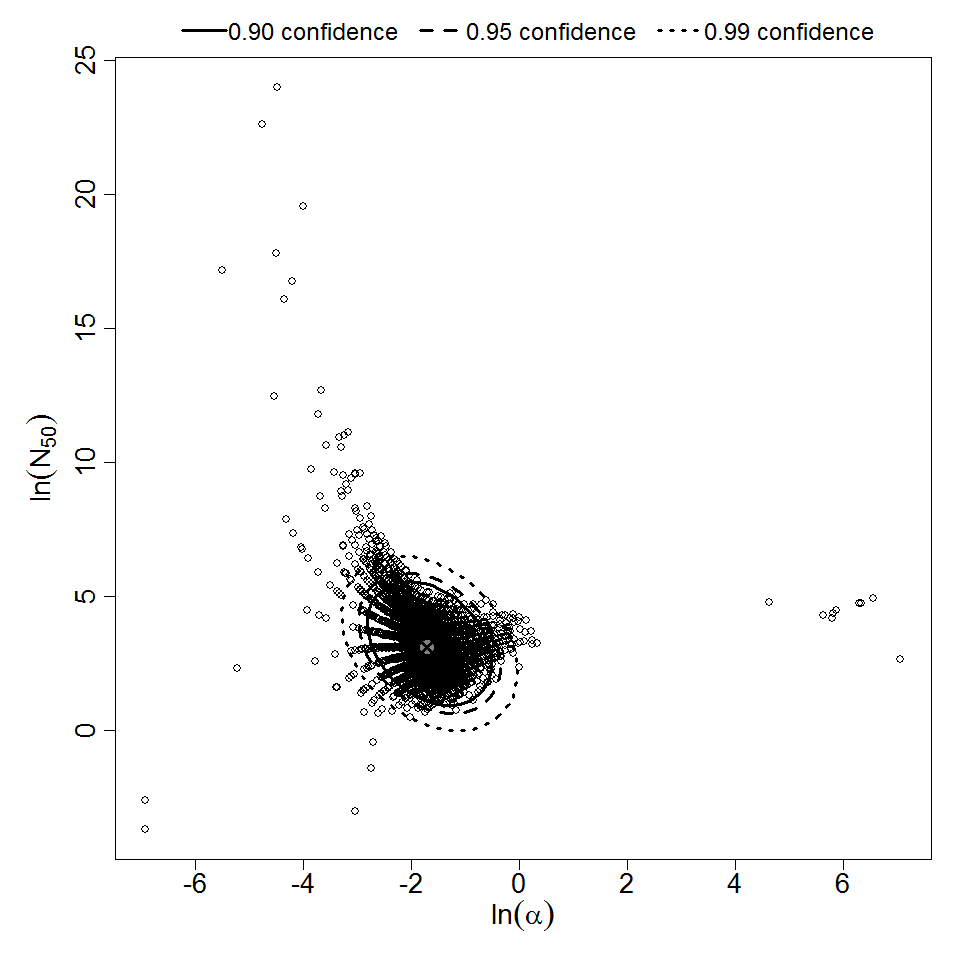
Parameter scatter plot for beta Poisson model ellipses signify the 0.9, 0.95 and 0.99 confidence of the parameters.
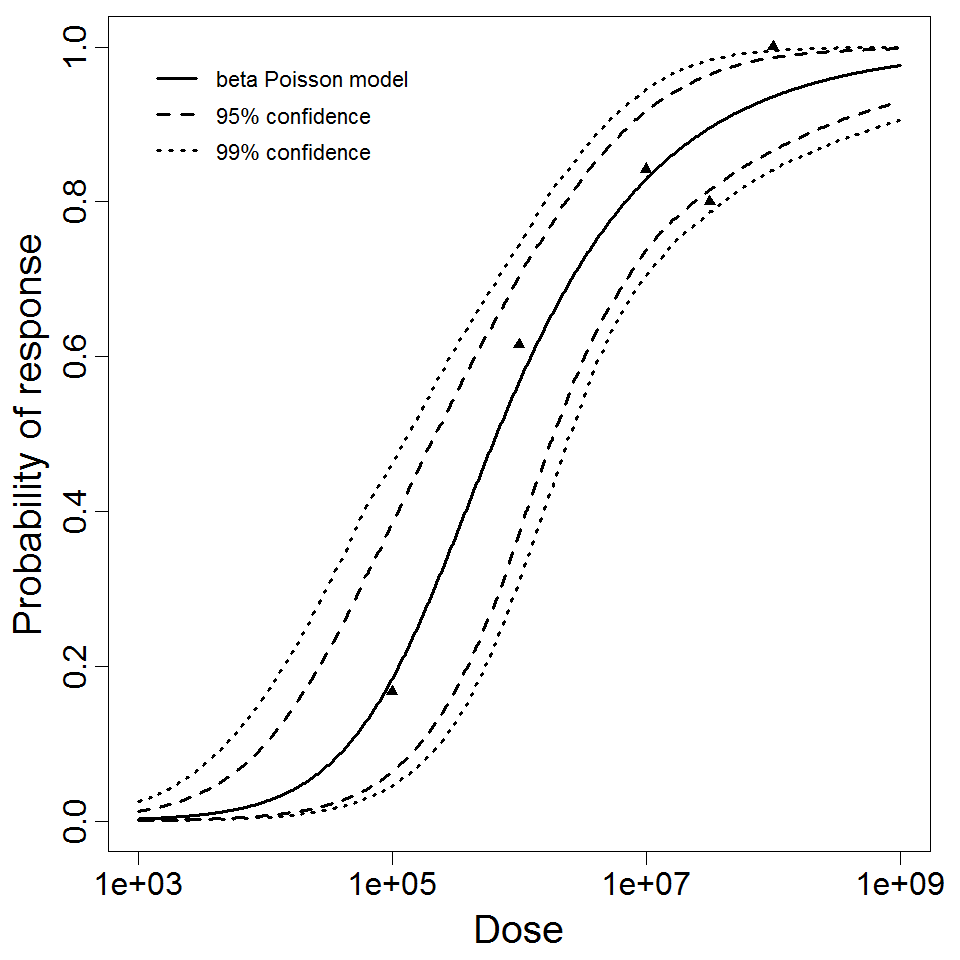
beta Poisson model plot, with confidence bounds around optimized model

# of Doses
5.00
Μodel
N50
6.66E+05
LD50/ID50
6.66E+05
Dose Units
Response
Exposure Route
Contains Preferred Model
a
4.29E-01
Agent Strain
H3N2,A/Washington/897/80 attenuated strain
Experiment ID
258
Host type