Description
|
|
||||||||||||||||||||||
|
||||||||||||||||||||||||||||||
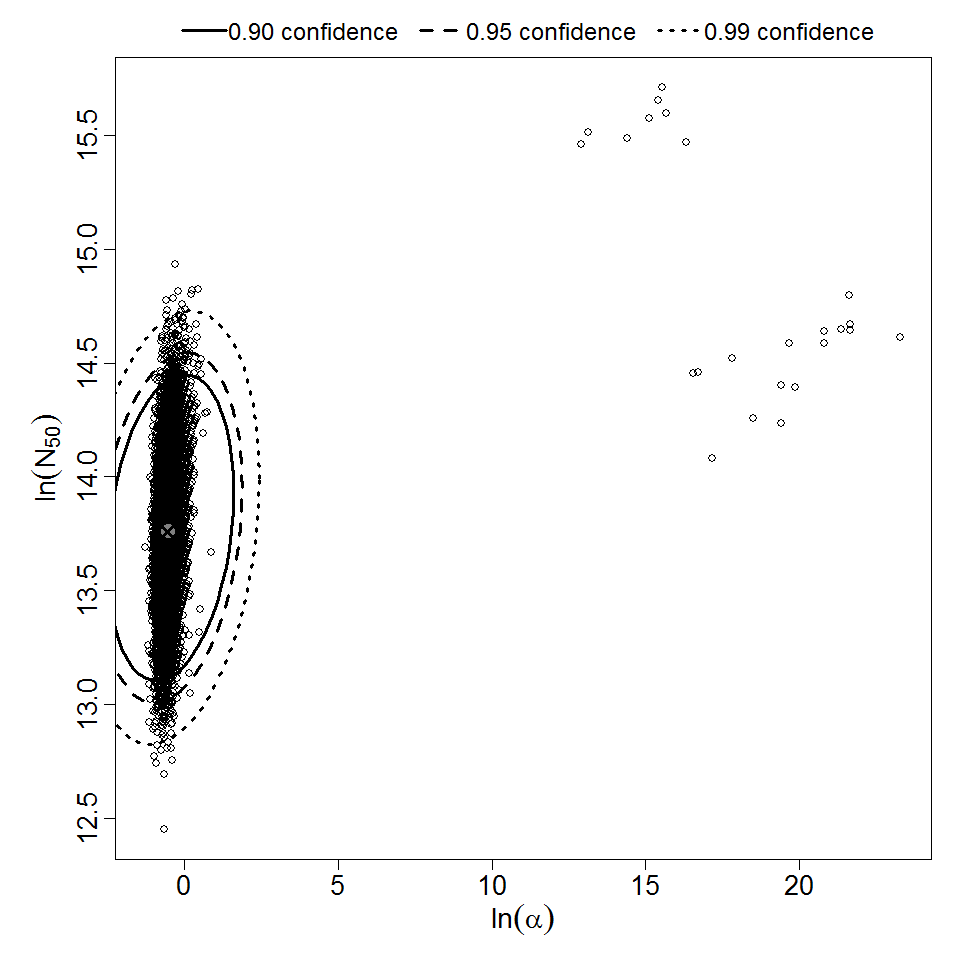
Parameter scatter plot for beta Poisson model ellipses signify the 0.9, 0.95 and 0.99 confidence of the parameters.
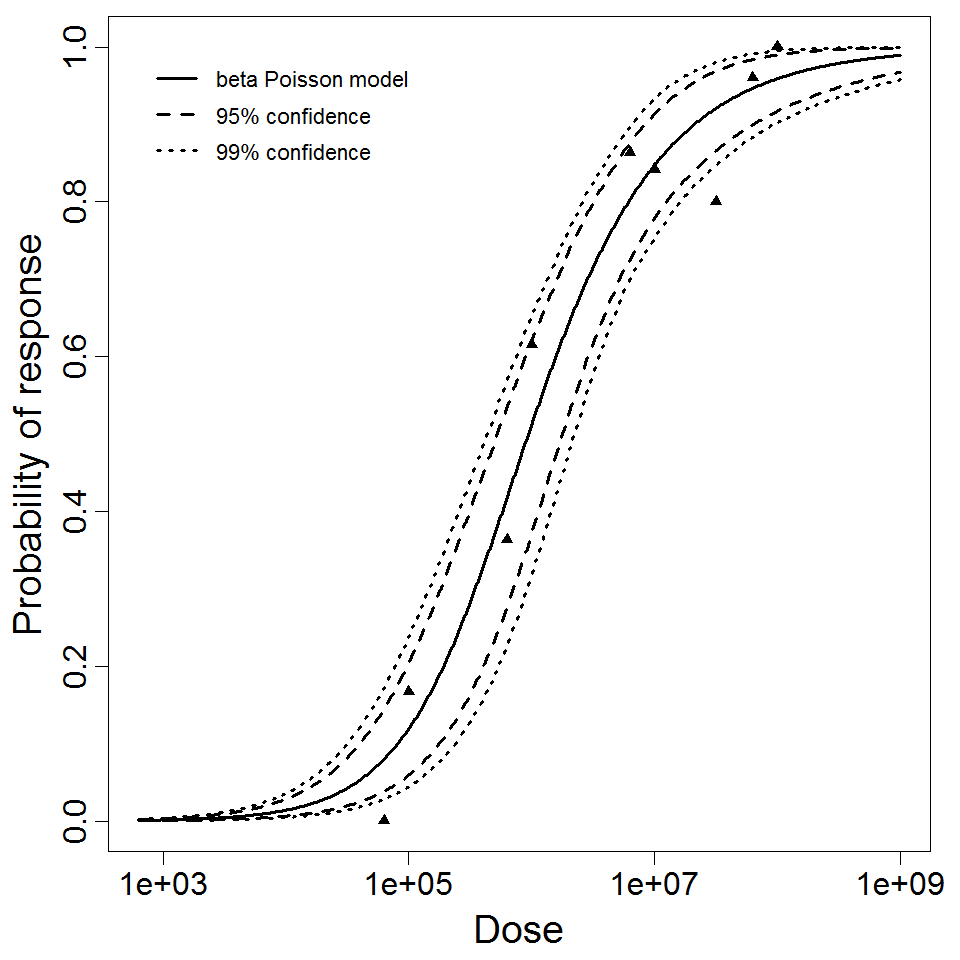
beta Poisson model plot, with confidence bounds around optimized model
# of Doses
9.00
Μodel
N50
9.45E+05
LD50/ID50
9.45E+05
Dose Units
Response
Exposure Route
Contains Preferred Model
a
5.81E-01
Agent Strain
H1N1,A/California/10/78 attenuated strain,H3N2,A/Washington/897/80 attenuated strain
Experiment ID
257, 258
Host type
Description
|
|
||||||||||||||||||||||
|
||||||||||||||||||||||||||||||

Parameter scatter plot for beta Poisson model ellipses signify the 0.9, 0.95 and 0.99 confidence of the parameters.

beta Poisson model plot, with confidence bounds around optimized model
# of Doses
4.00
Μodel
N50
1.25E+06
LD50/ID50
1.25E+06
Dose Units
Response
Exposure Route
Contains Preferred Model
a
9.04E-01
Agent Strain
H1N1,A/California/10/78 attenuated strain
Experiment ID
257
Host type
Description
|
|
||||||||||||||||||||||
|
||||||||||||||||||||||||||||||||||||||
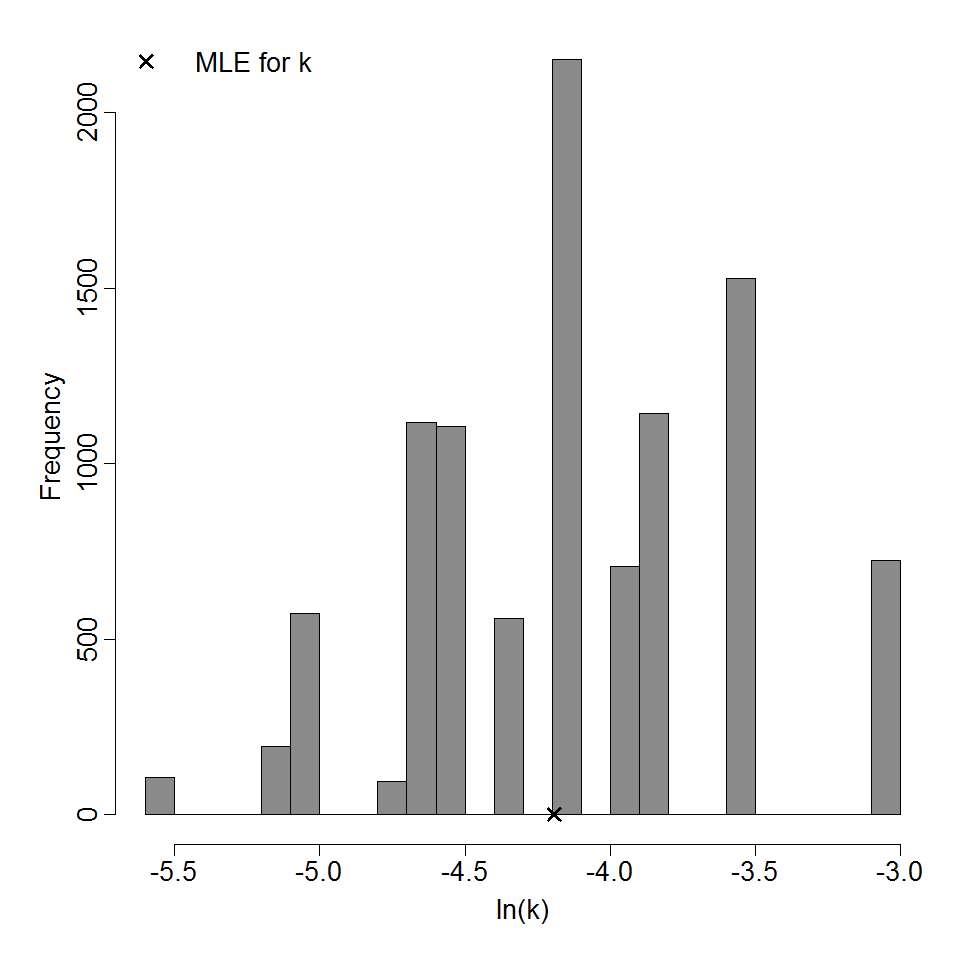
Parameter histogram for exponential model (uncertainty of the parameter)
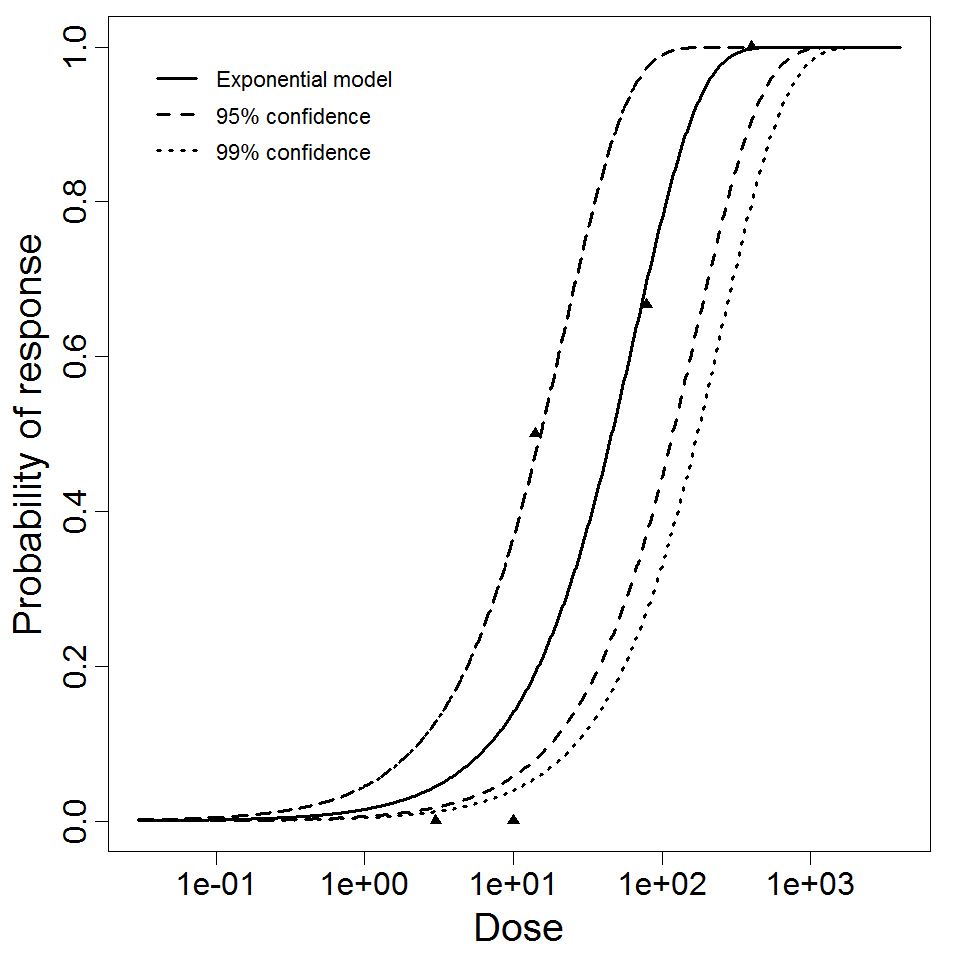
Exponential model plot, with confidence bounds around optimized model
# of Doses
5.00
Μodel
LD50/ID50
4.59E+01
Dose Units
Response
Exposure Route
Contains Preferred Model
k
1.51E-02
Agent Strain
type 4
Experiment ID
255
Host type