


SARS: Dose Response Experiments
General Overview
Coronaviruses cause acute and chronic respiratory, enteric, and central nervous system (CNS) diseases in humans and many species of animals. Coronaviruses are divided into three groups based on the genome sequences, including SARS-CoV (a member of group II) as well as murine hepatitis virus (MHV), bovine coronavirus, porcine hemagglutinating encephalomyelitis virus (HEV), equine coronavirus, and human coronavirues OC43 and NL63, which also cause respiratory infections.
| ID | Exposure Route | # of Doses | Agent Strain | Dose Units | Host type | Μodel | LD50/ID50 | Optimized parameters | Response type | Reference |
|---|---|---|---|---|---|---|---|---|---|---|
| 260 | intranasal | 4.00 | rSARS-CoV | PFU | mice hACE-2 | exponential | 2.33E+02 | k = 2.97E-03 | death |
Albuquerque, N. D., Baig, E. ., Ma, X. ., Zhang, J. ., He, W. ., Rowe, A. ., … Levy, G. A. (2006). Murine Hepatitis Virus Strain 1 Produces a Clinically Relevant Model of Severe Acute Respiratory Syndrome in A/J Mice. Journal of Virology, 80, 21. https://doi.org/10.1128/JVI.00747-06 |
| 260, 261 | intranasal | 0.00 | rSARS-CoV | PFU | mice hACE-2 and A/J | exponential | 2.82E+02 | k = 2.46E-03 | death | |
| 261 | intranasal | 4.00 | MHV-1 | PFU | A/J mice | exponential | 3.24E+02 | k = 2.14E-03 | death |
Albuquerque, N. D., Baig, E. ., Ma, X. ., Zhang, J. ., He, W. ., Rowe, A. ., … Levy, G. A. (2006). Murine Hepatitis Virus Strain 1 Produces a Clinically Relevant Model of Severe Acute Respiratory Syndrome in A/J Mice. Journal of Virology, 80, 21. https://doi.org/10.1128/JVI.00747-06 |
|
|
||||||||||||||||||||||
|
||||||||||||||||||||||||||||||||||||||
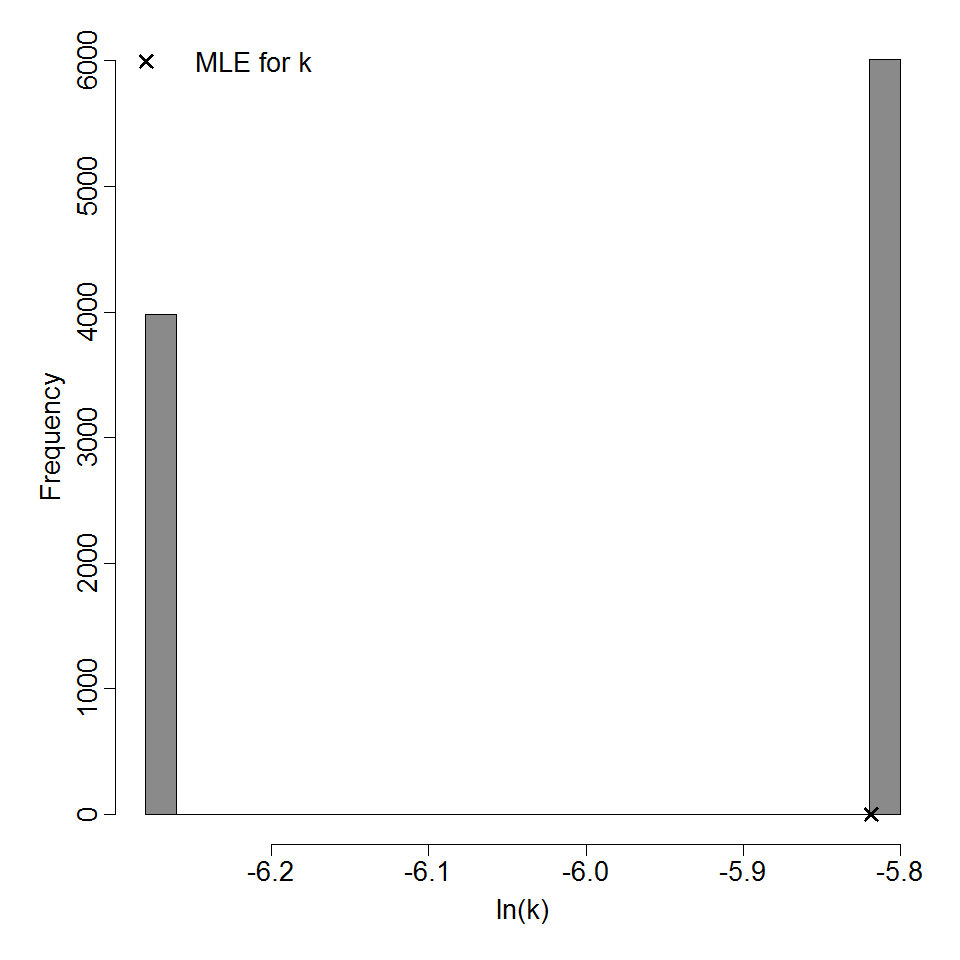
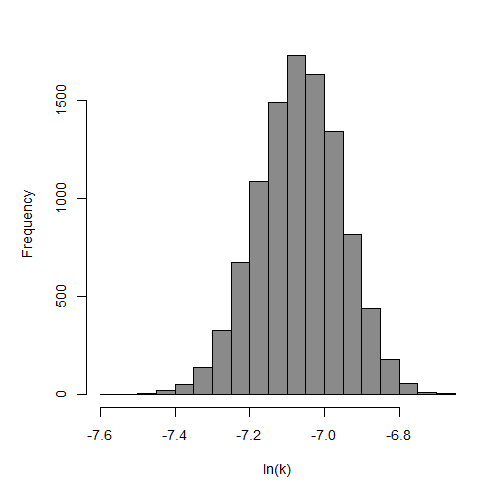
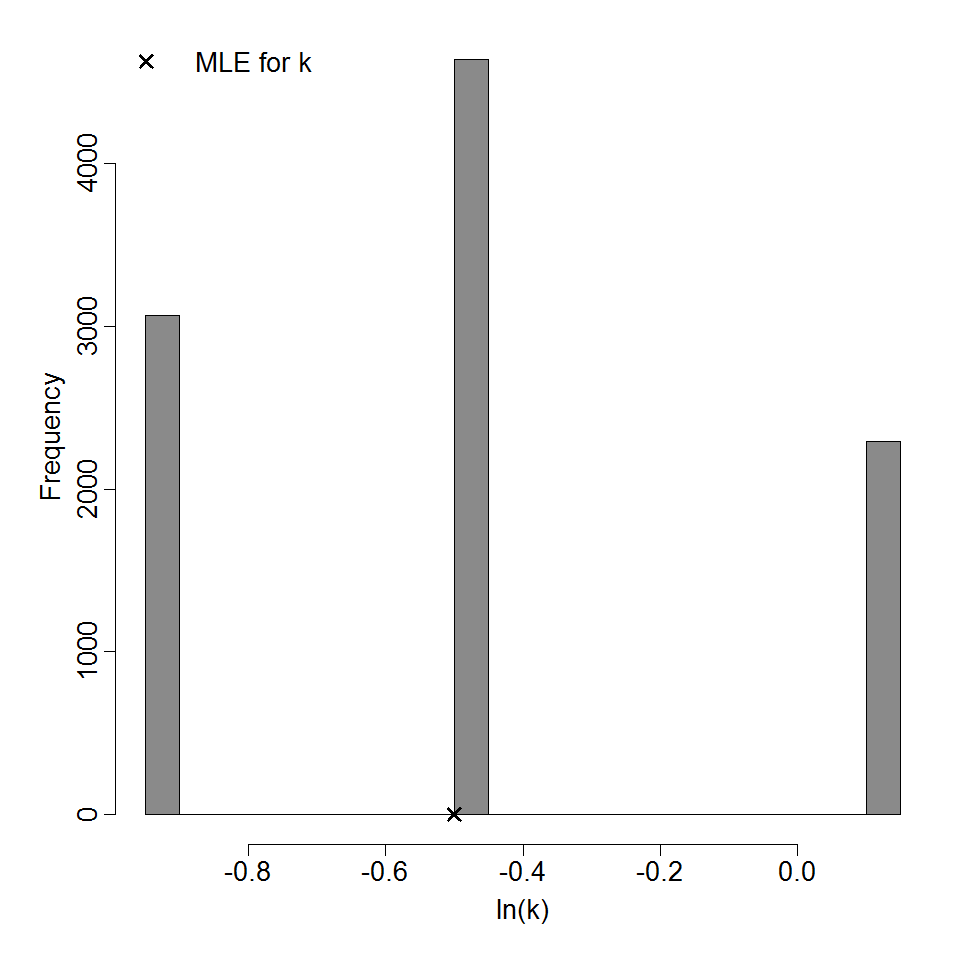
Parameter histogram for exponential model (uncertainty of the parameter)
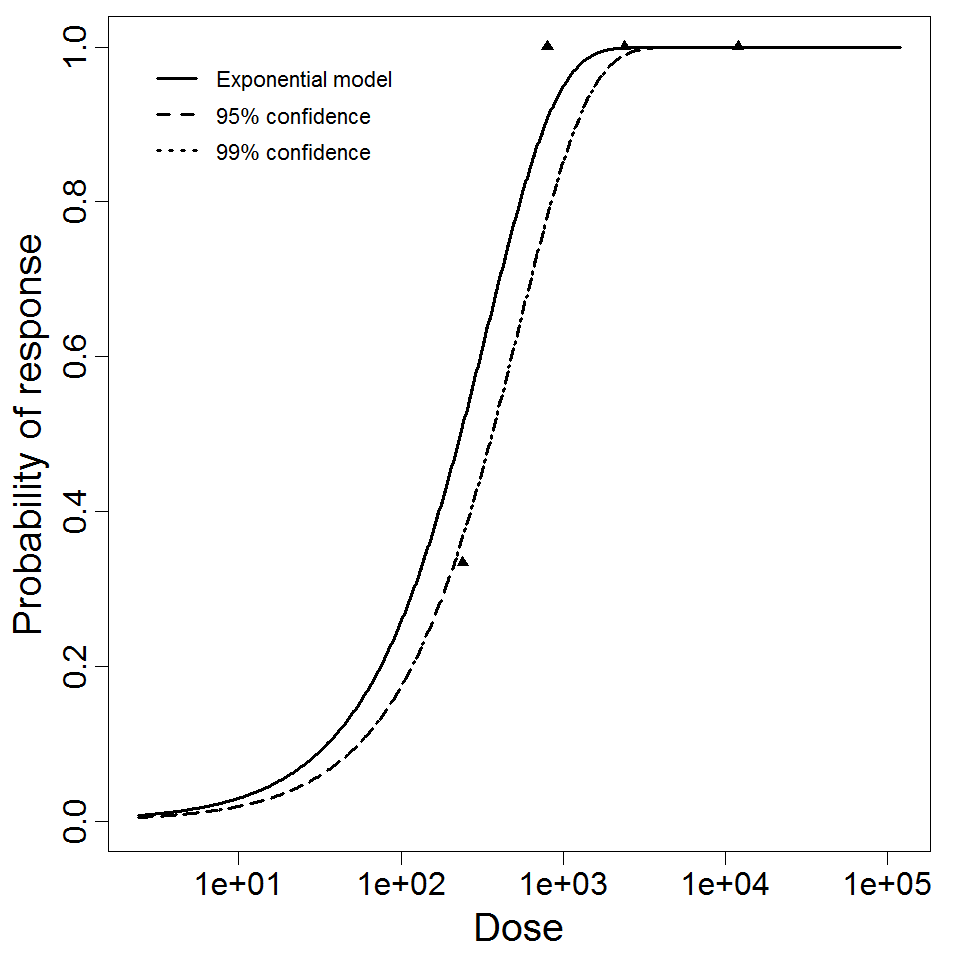
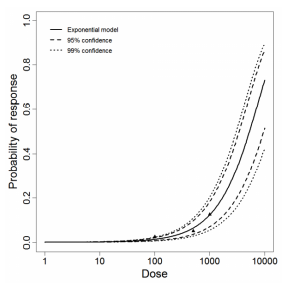
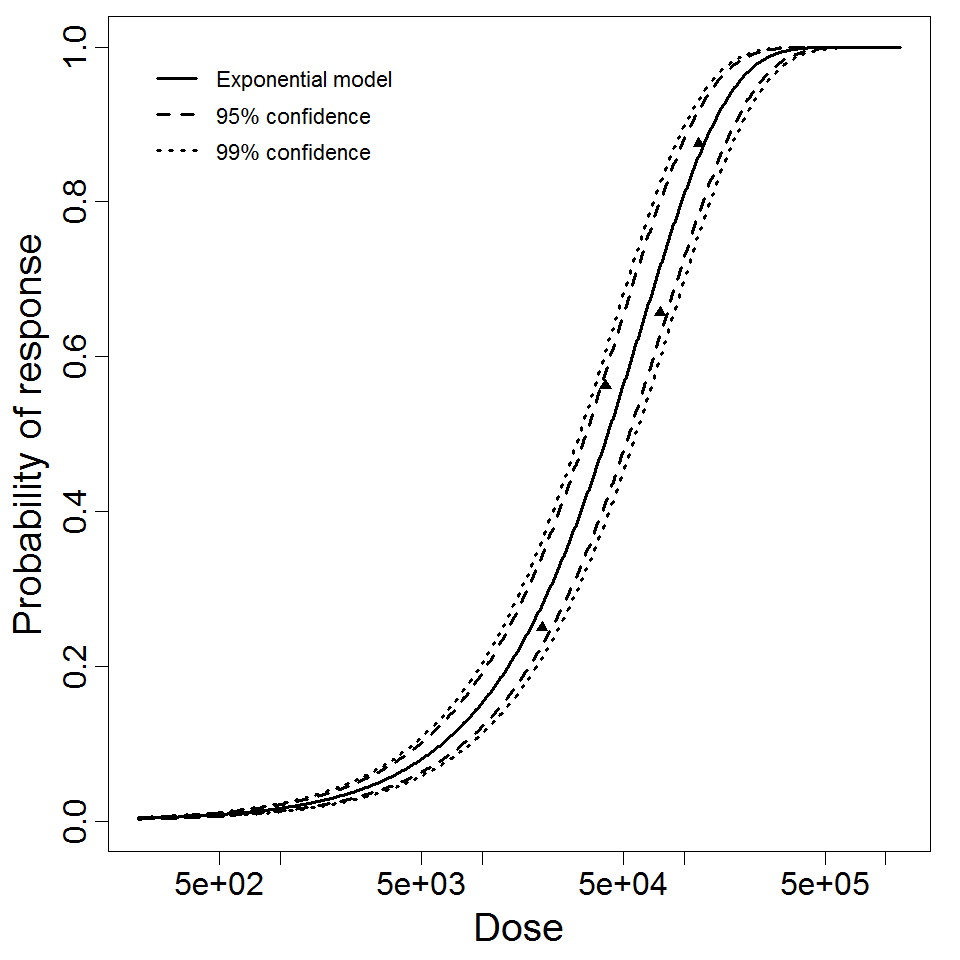
Exponential model plot, with confidence bounds around optimized model
|
|
||||||||||||||||||||||
|
||||||||||||||||||||||||||||||||||||||
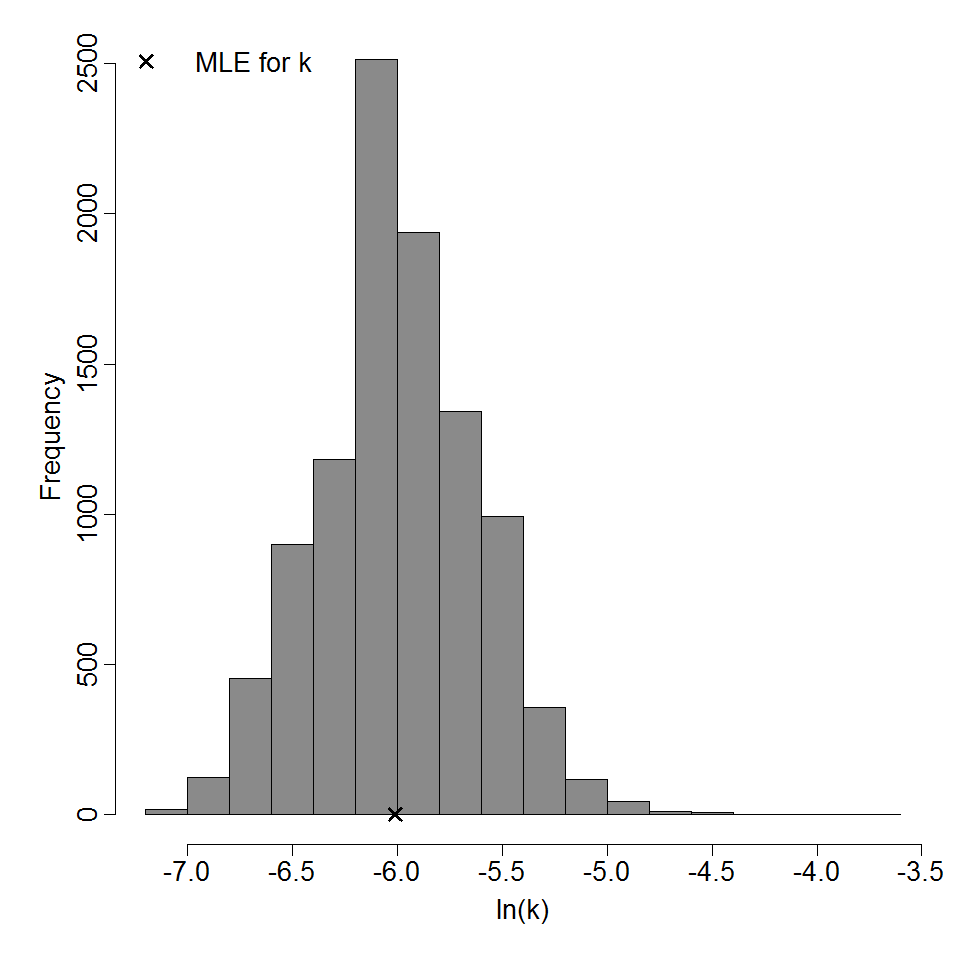
Parameter histogram for exponential model (uncertainty of the parameter)
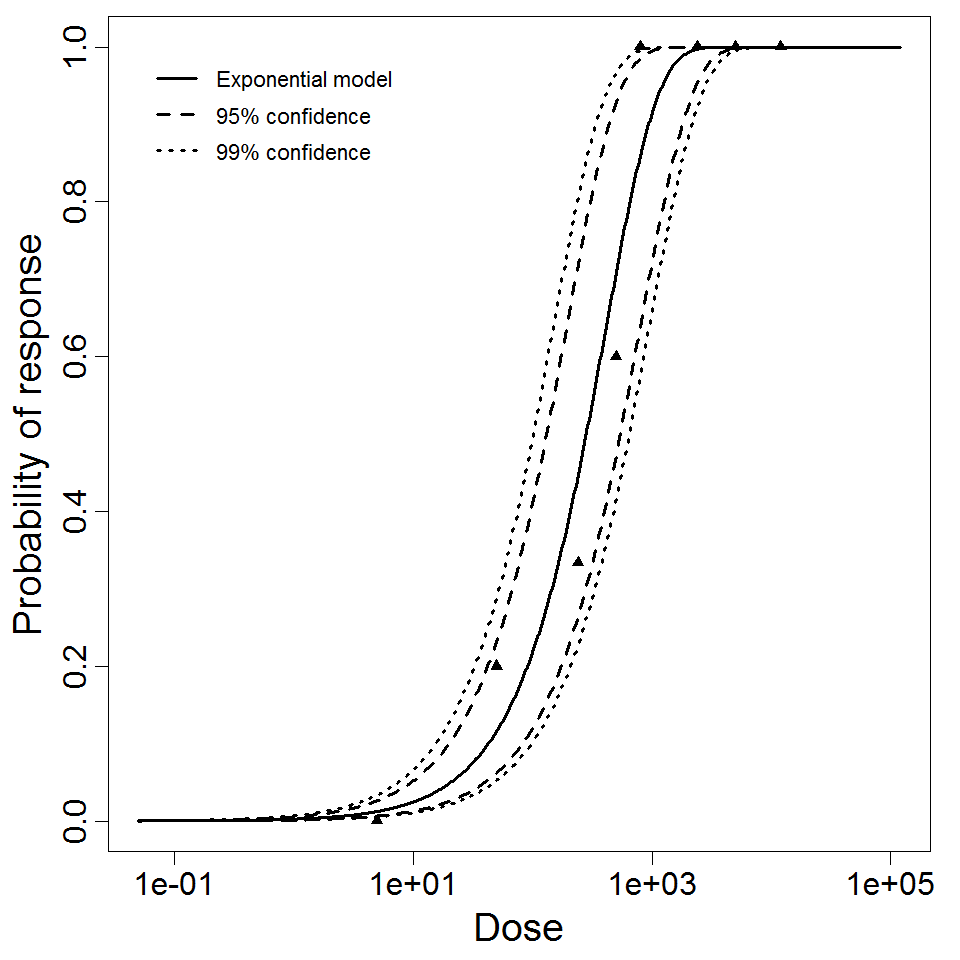
Exponential model plot, with confidence bounds around optimized model
|
|
||||||||||||||||||||||
|
||||||||||||||||||||||||||||||||||||||

Parameter histogram for exponential model (uncertainty of the parameter)

Exponential model plot, with confidence bounds around optimized model
Adenovirus: Dose Response Experiments
| ID | Exposure Route | # of Doses | Agent Strain | Dose Units | Host type | Μodel | LD50/ID50 | Optimized parameters | Response type | Reference |
|---|---|---|---|---|---|---|---|---|---|---|
| 31 | inhalation | 4.00 | type 4 | TCID50 | human | exponential | 1.14E+00 | k = 6.07E-01 | infection |
Couch, R. B., Cate, T. R., Douglas, R. G., Gerone, P. J., & . (1966). Effect of route of inoculation on experimental respiratory viral disease in volunteers and evidence for airborne transmission. Bacteriological Reviews, 30, 3. |
|
|
||||||||||||||||||||||
|
||||||||||||||||||||||||||||||||||||||
Parameter histogram for exponential model (uncertainty of the parameter)
Exponential model plot, with confidence bounds around optimized model
|
|
||||||||||||||||||||||
|
||||||||||||||||||||||||||||||

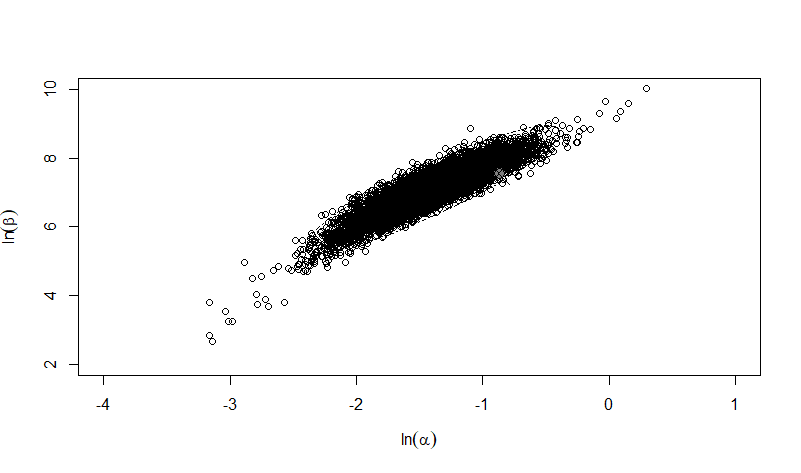
Parameter scatter plot for beta Poisson model ellipses signify the 0.9, 0.95 and 0.99 confidence of the parameters.

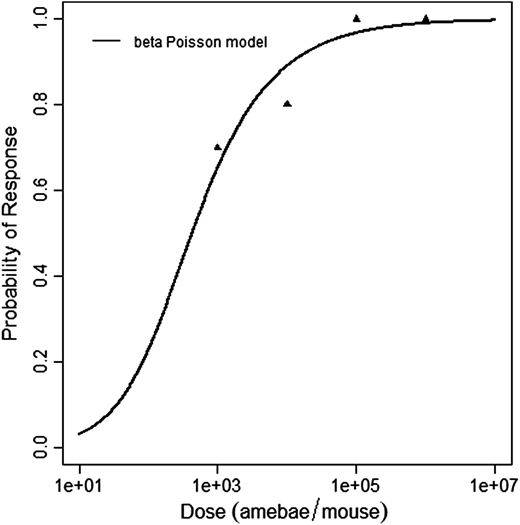
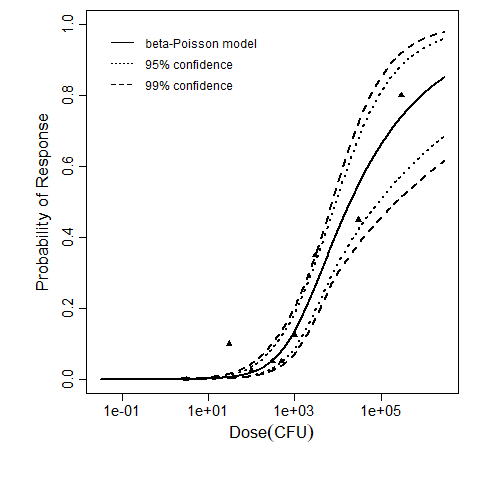
beta Poisson model plot, with confidence bounds around optimized model
|
|
||||||||||||||||||||||
|
||||||||||||||||||||||||||||||

Parameter scatter plot for beta Poisson model ellipses signify the 0.9, 0.95 and 0.99 confidence of the parameters.

beta Poisson model plot, with confidence bounds around optimized model