Description
|
|
||||||||||||||||||||||
|
||||||||||||||||||||||||||||||||||||||
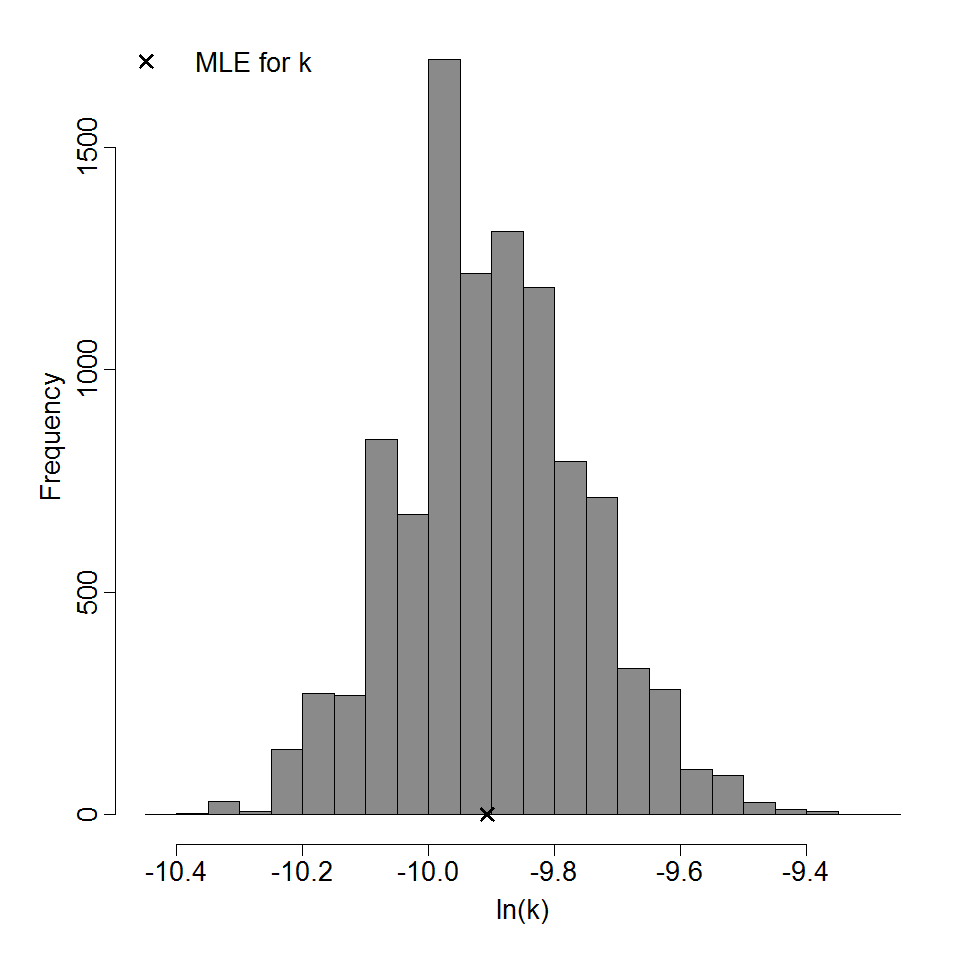
Parameter histogram for exponential model (uncertainty of the parameter)
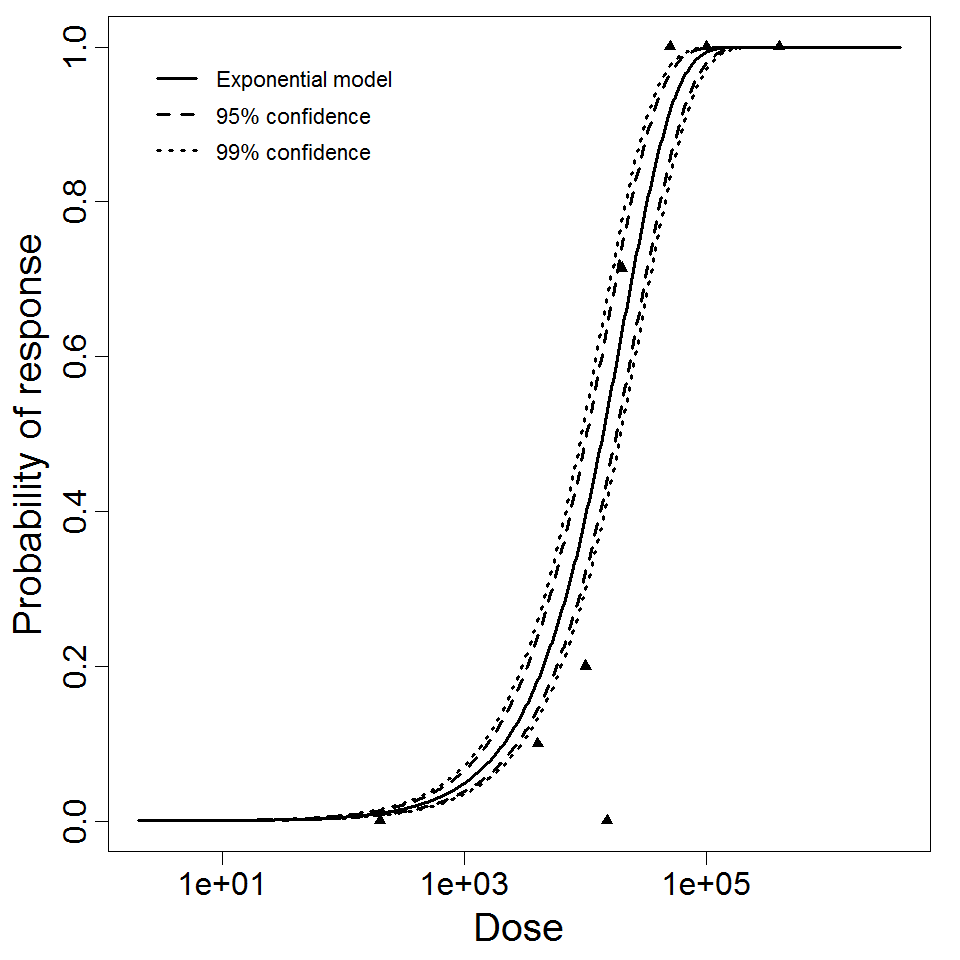
Exponential model plot, with confidence bounds around optimized model
# of Doses
9.00
Μodel
LD50/ID50
1.39E+04
Dose Units
Response
Exposure Route
Contains Preferred Model
k
4.99E-05
Agent Strain
strain 74/81
Experiment ID
242, 243
Host type
Description
|
|
||||||||||||||||||||||
|
||||||||||||||||||||||||||||||||||||||
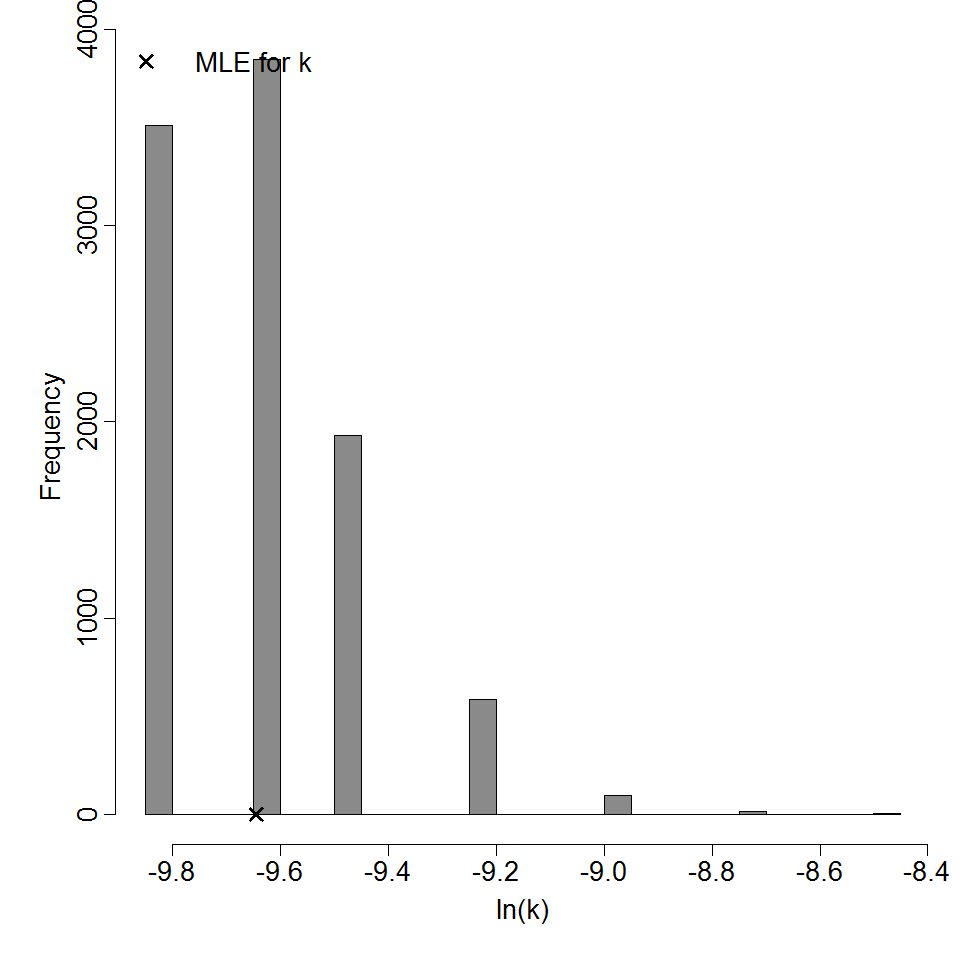
Parameter histogram for exponential model (uncertainty of the parameter)
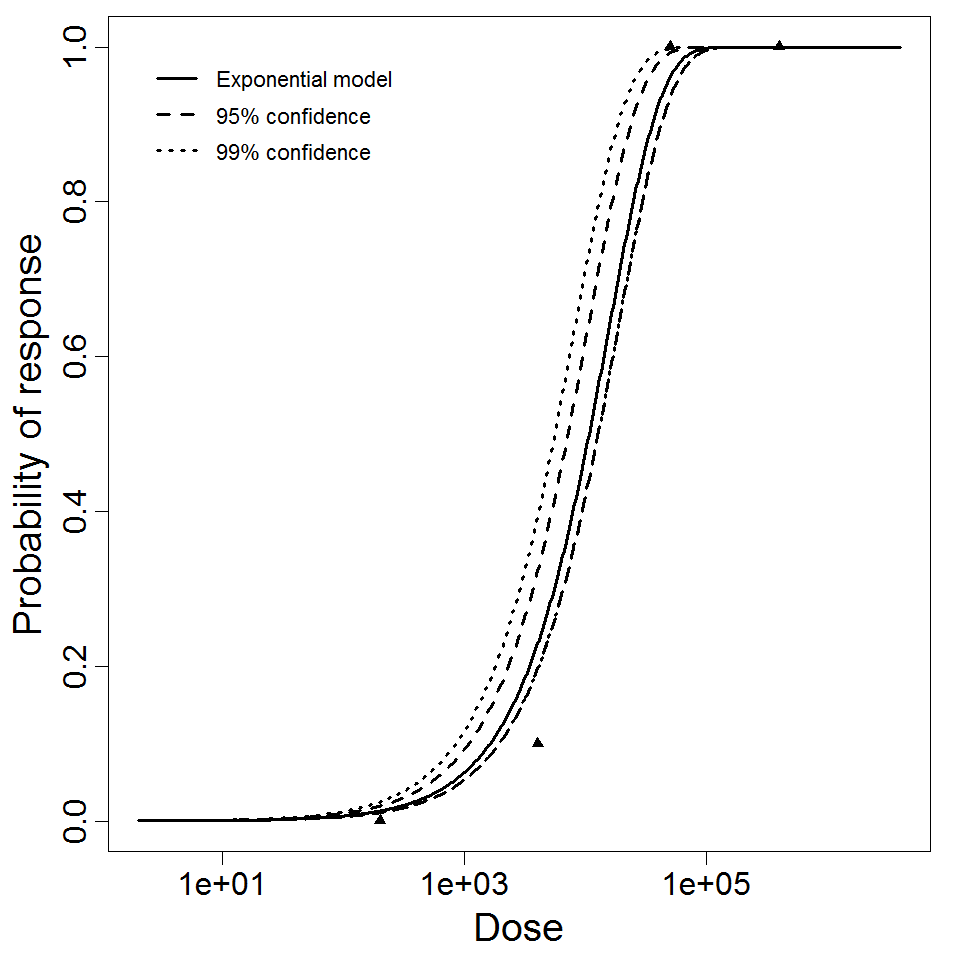
Exponential model plot, with confidence bounds around optimized model
# of Doses
4.00
Μodel
LD50/ID50
1.07E+04
Dose Units
Response
Exposure Route
Contains Preferred Model
k
6.48E-05
Agent Strain
strain 74/81
Experiment ID
242
Host type
Description
|
|
||||||||||||||||||||||
|
||||||||||||||||||||||||||||||||||||||
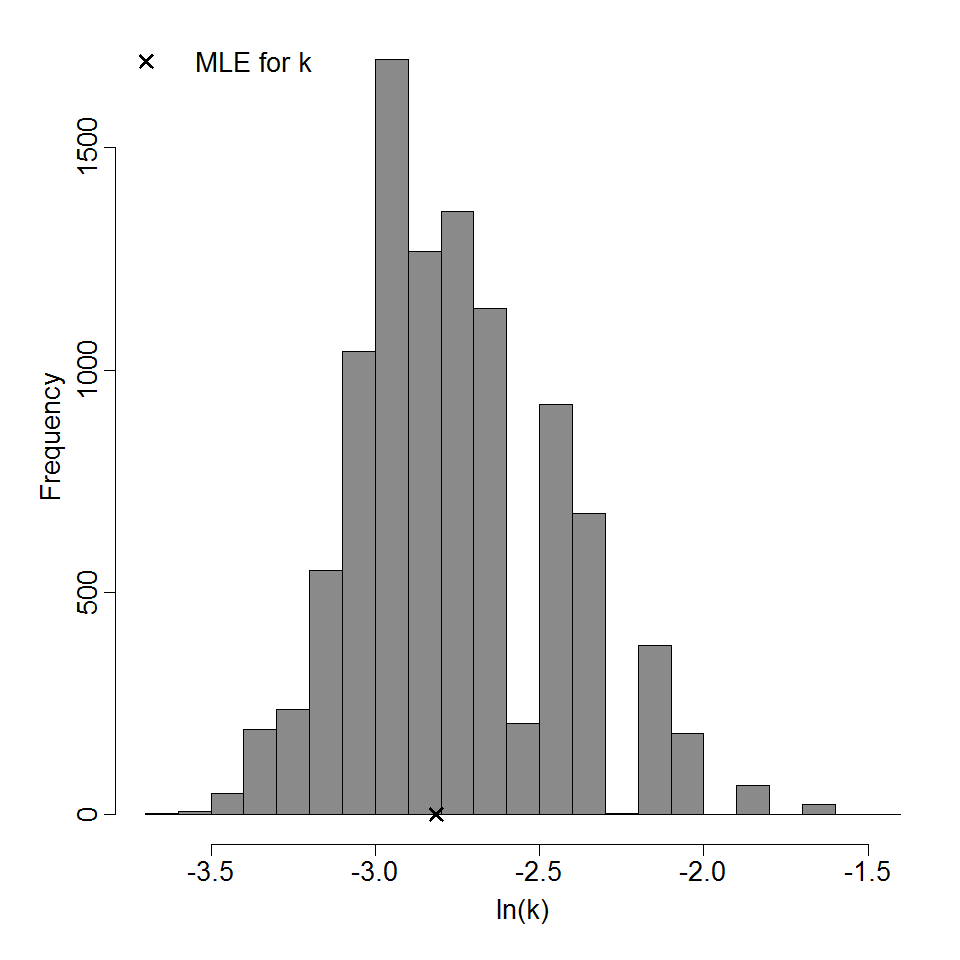
Parameter histogram for exponential model (uncertainty of the parameter)
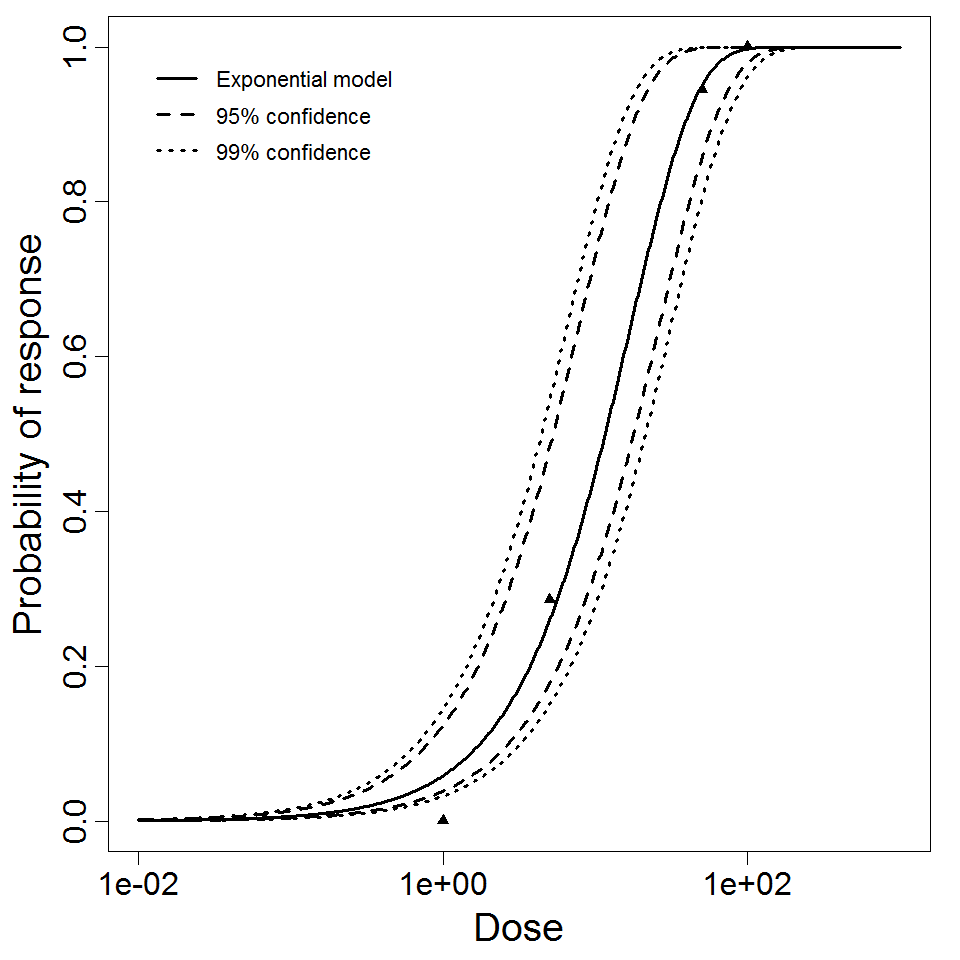
Exponential model plot, with confidence bounds around optimized model
# of Doses
4.00
Μodel
LD50/ID50
1.16E+01
Dose Units
Response
Exposure Route
Contains Preferred Model
k
5.99E-02
Agent Strain
Philadelphia 1
Experiment ID
241
Host type
Description
|
|
||||||||||||||||||||||
|
||||||||||||||||||||||||||||||

Parameter scatter plot for beta Poisson model ellipses signify the 0.9, 0.95 and 0.99 confidence of the parameters.

beta Poisson model plot, with confidence bounds around optimized model
# of Doses
4.00
Μodel
N50
1.43E+04
LD50/ID50
1.43E+04
Dose Units
Response
Exposure Route
Contains Preferred Model
a
7.94E-02
Agent Strain
Josiah strain
Experiment ID
15
Host type