Lassa virus: Dose Response Experiments

General Overview

Lassa virus is an RNA virus belonging to the family of Arenaviridae. As the causative agent of hemorrhagic fever, Lassa virus infects more than 200,000 people per year, causing more than 3,000 deaths with a mortality rate of about 15% among the hospitalized cases. Hemorrhagic fever is highly fatal disease mostly found in West Africa. The disease has an acute phase lasting 1 to 4 weeks, characterized by fever, skin rash with hemorrhages, sore throat, headache, and diarrhea. The U.S.

ID Exposure Route # of Doses Agent Strain Dose Units Host type Μodel LD50/ID50 Optimized parameters Response type Reference
15 inhalation 4.00 Josiah strain PFU guinea pig beta-Poisson 1.43E+04 a = 7.94E-02 N50 = 1.43E+04 death
Stephenson, E. H., Larson, E. W., & Dominik, J. W. (1984). Effect of environmental factors on aerosol-induced Lassa virus infection. Journal of Medical Virology, 14, 4. Retrieved from https://onlinelibrary.wiley.com/doi/abs/10.1002/jmv.1890140402
Exposure Route:
inhalation
# of Doses:
4.00
Agent Strain:
Josiah strain
Dose Units:
PFU
Host type:
guinea pig
Μodel:
beta-Poisson
LD50/ID50:
1.43E+04
Optimized parameters: a = 7.94E-02 N50 = 1.43E+04
Response type:
death

Guinea pig/ Josiah strain model data 
Dose Dead Survived Total
5 1 7 8
48 1 7 8
724 3 5 8
5370 4 4 8


Goodness of fit and model selection
Model Deviance Δ Degrees 
of freedom
χ20.95,1 
p-value
χ20.95,m-k 
p-value
Exponential 14.4 13.8 3 3.84 
0.000203
7.81 
0.00237
Beta Poisson 0.633 2 5.99 
0.729
Beta-Poisson fits better than exponential; cannot reject good fit for beta-Poisson.


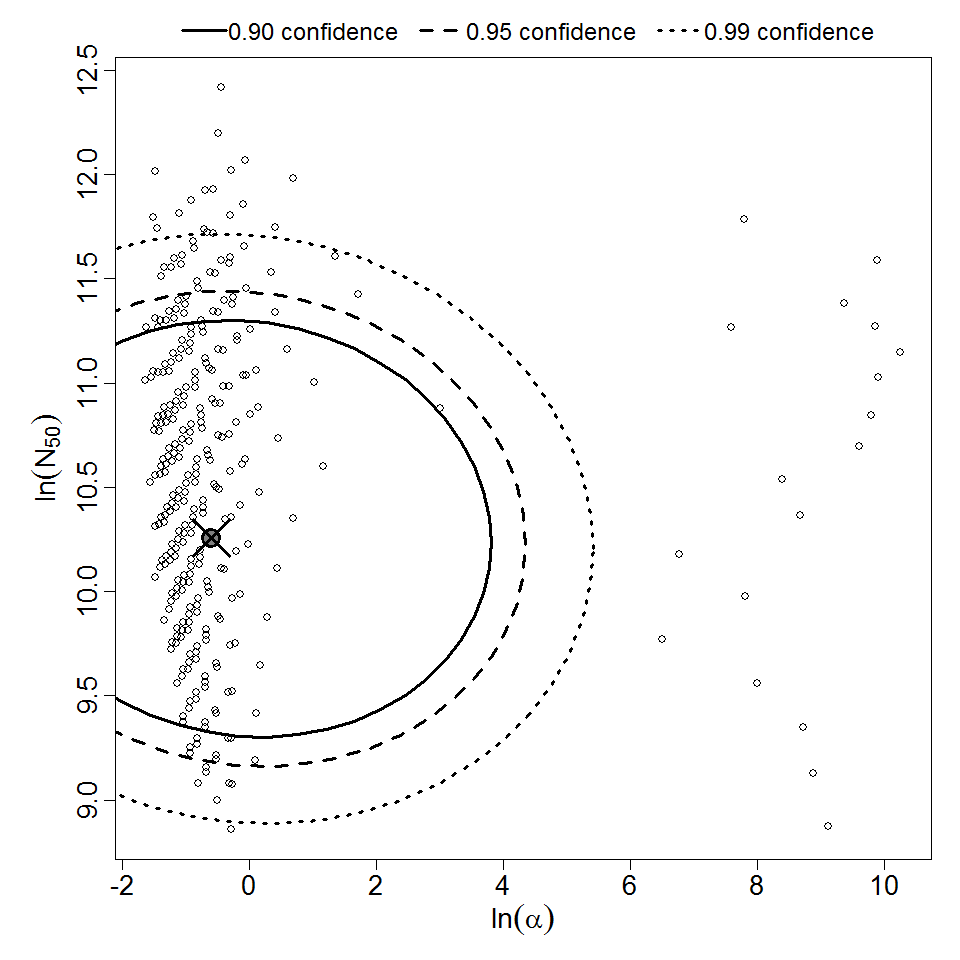
Optimized parameters for the beta-Poisson model, from 10000 bootstrap iterations
Parameter MLE estimate Percentiles
0.5% 2.5% 5% 95% 97.5% 99.5%
α 7.94E-02 9.77E-04 9.85E-04 9.87E-04 4.57E-01 1.19E+00 5.76E+02
N50 1.43E+04 2.13E-01 9.22E-01 2.90E+00 1.82E+13 3.06E+17 2.25E+34


Parameter scatter plot for beta Poisson model ellipses signify the 0.9, 0.95 and 0.99 confidence of the parameters.

beta Poisson model plot, with confidence bounds around optimized model

Adenovirus: Dose Response Experiments

General Overview

Adenoviruses are medium-sized (90-100 nm), nonenveloped (naked) icosohedral viruses containing double-stranded DNA. According to the CDC, there are more than 52 immunologically distinct types that can cause infections in humans and animals.

ID Exposure Route # of Doses Agent Strain Dose Units Host type Μodel LD50/ID50 Optimized parameters Response type Reference
31 inhalation 4.00 type 4 TCID50 human exponential 1.14E+00 k = 6.07E-01 infection
Couch, R. B., Cate, T. R., Douglas, R. G., Gerone, P. J., & . (1966). Effect of route of inoculation on experimental respiratory viral disease in volunteers and evidence for airborne transmission. Bacteriological Reviews, 30, 3.
Highest quality
Exposure Route:
inhalation
# of Doses:
4.00
Agent Strain:
type 4
Dose Units:
TCID50
Host type:
human
Μodel:
exponential
LD50/ID50:
1.14E+00
Optimized parameters: k = 6.07E-01
Response type:
infection

Humans/ type 4 Strain model data 
Dose Infected Non-infected Total
1 1 2 3
5 3 0 3
11 3 0 3
1000 6 0 6


Goodness of fit and model selection
Model Deviance Δ Degrees 
of freedom
χ20.95,1 
p-value
χ20.95,m-k 
p-value
Exponential 0.487 -0.000723 3 3.84 
1
7.81 
0.922
Beta Poisson 0.488 2 5.99 
0.784
Exponential is preferred to beta-Poisson; cannot reject good fit for exponential.


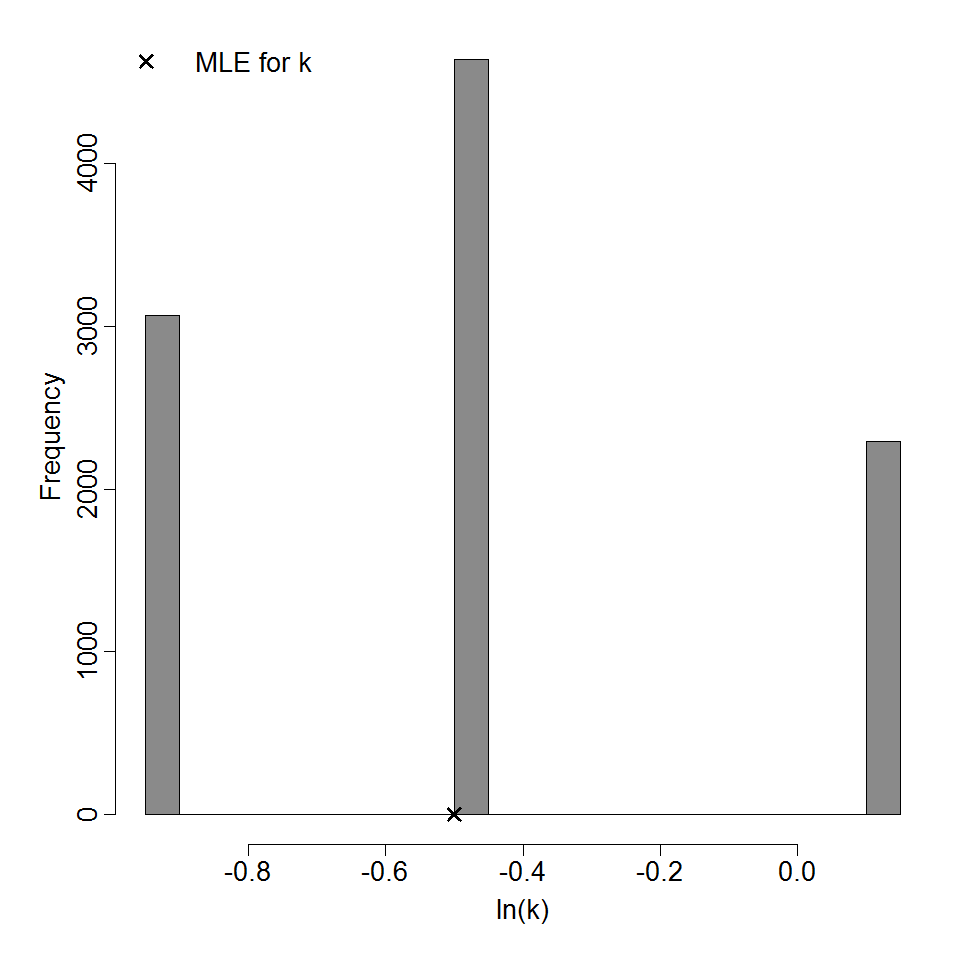
Optimized k parameter for the exponential model, from 10000 bootstrap iterations
Parameter MLE estimate Percentiles
0.5% 2.5% 5% 95% 97.5% 99.5%
k 6.07E-01 3.87E-01 3.87E-01 3.87E-01 1.13E+00 1.13E+00 1.13E+00
ID50/LD50/ETC* 1.14E+00 6.11E-01 6.11E-01 6.11E-01 1.79E+00 1.79E+00 1.79E+00
*Not a parameter of the exponential model; however, it facilitates comparison with other models.


Parameter histogram for exponential model (uncertainty of the parameter)
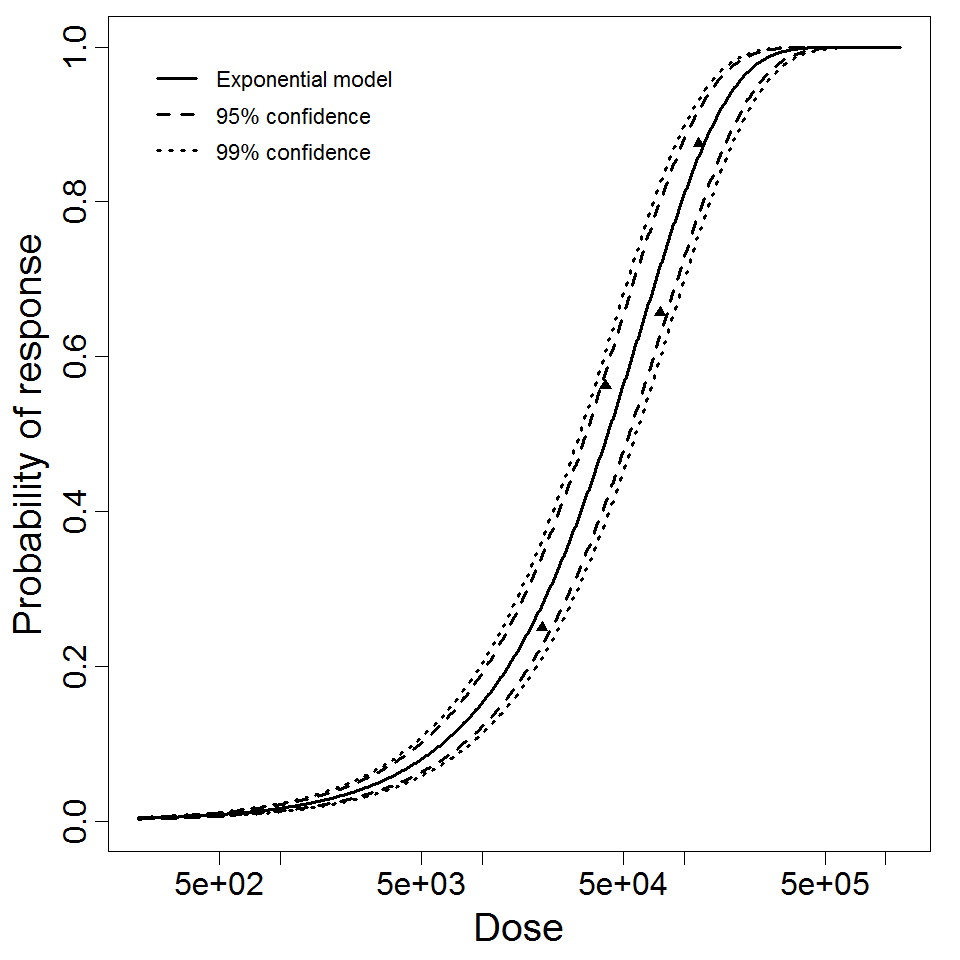
Exponential model plot, with confidence bounds around optimized model

Description
Guinea pig/Vollum Strain model data 
Dose Dead Survived Total
19800 8 24 32
40800 18 14 32
76200 21 11 32
118000 28 4 32


Goodness of fit and model selection
Model Deviance Δ Degrees 
of freedom
χ20.95,1 
p-value
χ20.95,m-k 
p-value
Exponential 1.43 -0.000184 3 3.84 
1
7.81 
0.699
Beta Poisson 1.43 2 5.99 
0.49
Exponential is preferred to beta-Poisson; cannot reject good fit for exponential.


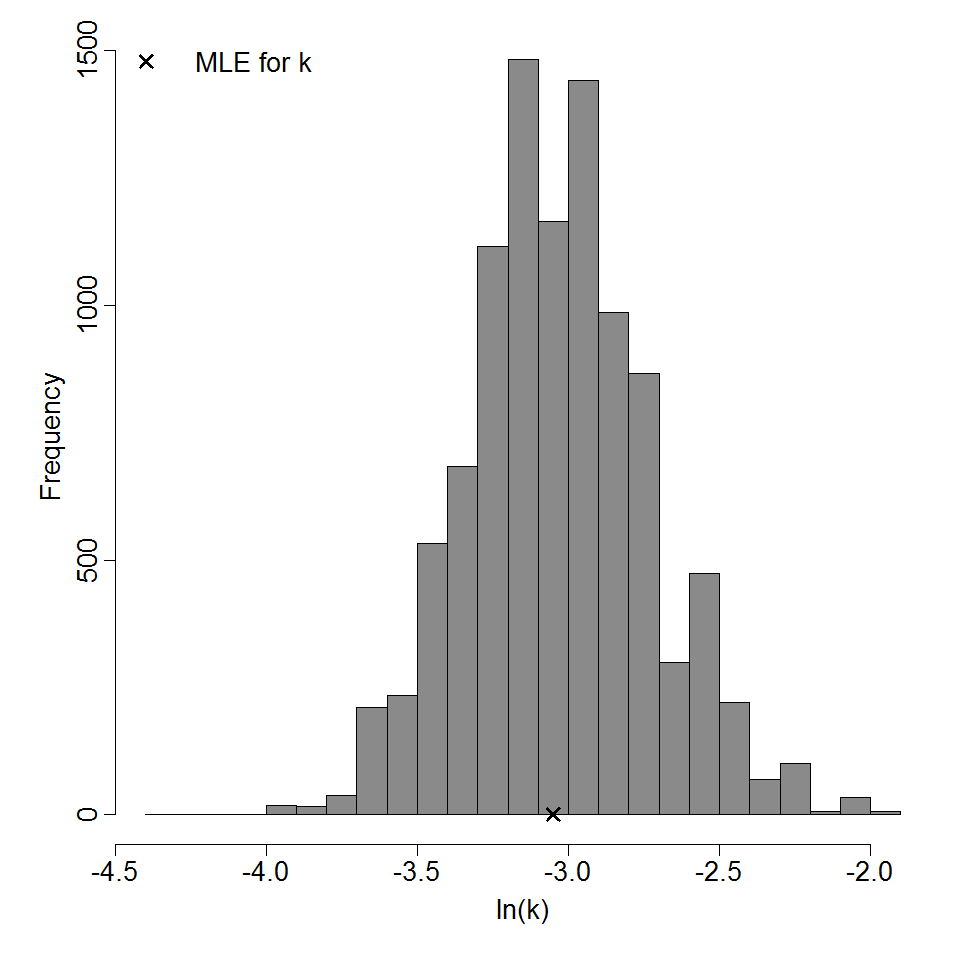
Optimized parameters for the exponential model, from 10000 bootstrap iterations
Parameter MLE estimate Percentiles
0.5% 2.5% 5% 95% 97.5% 99.5%
k 1.65E-05 1.20E-05 1.30E-05 1.35E-05 2.03E-05 2.12E-05 2.28E-05
ID50/LD50/ETC* 4.2E+04 3.04E+04 3.27E+04 3.41E+04 5.14E+04 5.35E+04 5.80E+04
*Not a parameter of the exponential model; however, it facilitates comparison with other models.


Parameter histogram for exponential model (uncertainty of the parameter)

Exponential model plot, with confidence bounds around optimized model

Bacillus Graph 2.png

# of Doses
4.00
Μodel
LD50/ID50
4.2E+04
Dose Units
Response
Exposure Route
Contains Preferred Model
k
1.65E-05
Agent Strain
Vollum
Experiment ID
87
Host type
Description
Rhesus Macaques/Vollum Strain model data
Dose Dead Survived Total
70300 1 7 8
77000 4 4 8
109000 5 3 8
138000 6 2 8
156000 5 3 8
161000 3 5 8
240000 8 0 8
3E+05 7 1 8
398000 8 0 8


Goodness of fit and model selection
Model Deviance Δ Degrees 
of freedom
χ20.95,1 
p-value
χ20.95,m-k 
p-value
Exponential 11.3 -0.000503 8 3.84 
1
15.5 
0.188
Beta Poisson 11.3 7 14.1 
0.128
Exponential is preferred to beta-Poisson; cannot reject good fit for exponential.


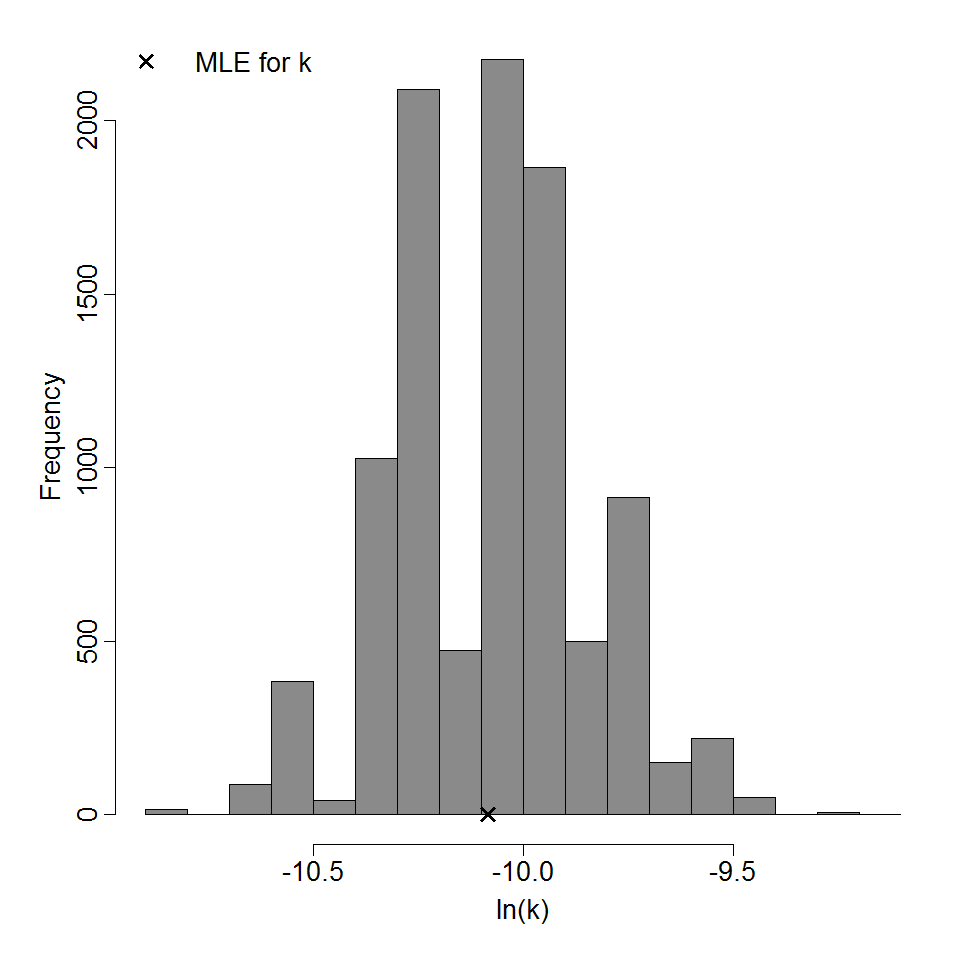
Optimized parameters for the exponential model, from 10000 bootstrap iterations
Parameter MLE estimate Percentiles
0.5% 2.5% 5% 95% 97.5% 99.5%
k 7.16E-06 4.99E-06 5.47E-06 5.71E-06 9.09E-06 9.51E-06 1.05E-05
ID50/LD50/ETC* 9.69E+04 6.63E+04 7.29E+04 7.63E+04 1.21E+05 1.27E+05 1.39E+05
*Not a parameter of the exponential model; however, it facilitates comparison with other models.

Parameter histogram for exponential model (uncertainty of the parameter)
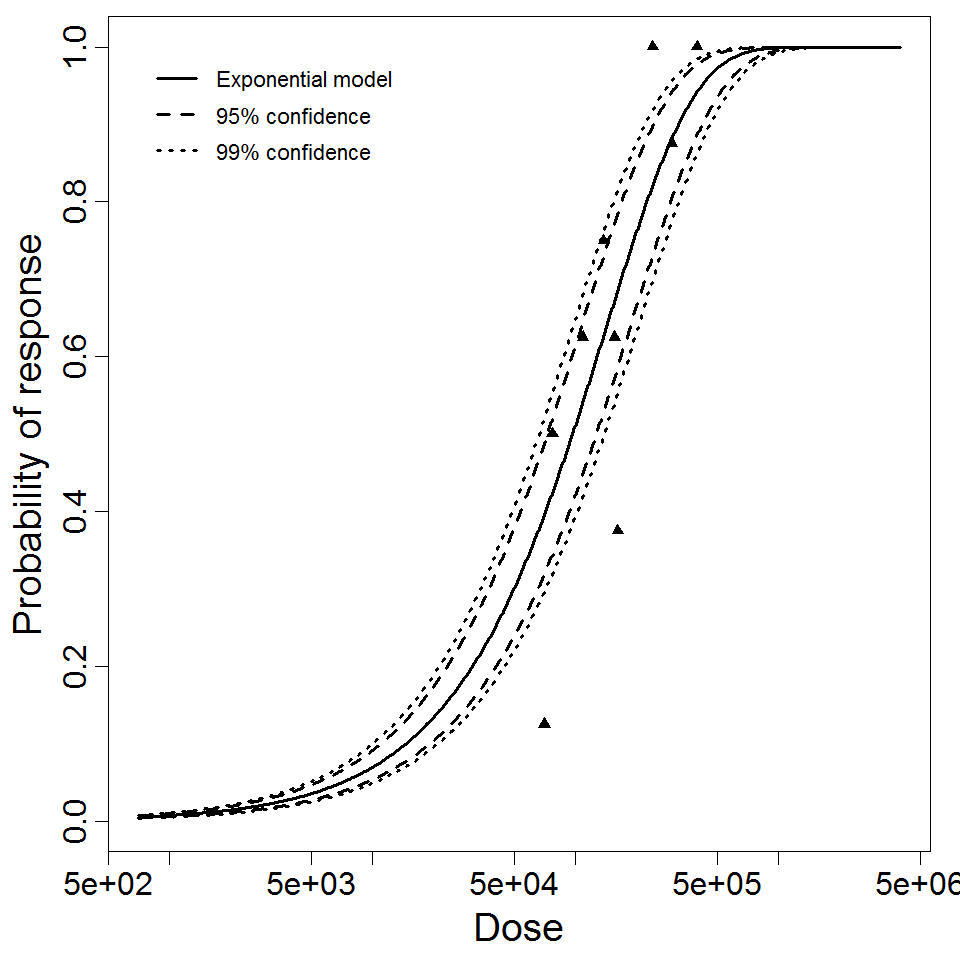
 

Exponential model plot, with confidence bounds around optimized model


# of Doses
9.00
Μodel
LD50/ID50
9.69E+04
Dose Units
Response
Exposure Route
Contains Preferred Model
k
7.16E-06
Agent Strain
Vollum
Experiment ID
86
Host type
Description
Guinea pig/ATCC 6605 Strain model data 
Dose Dead Survived Total
30 0 6 6
300 1 5 6
3000 0 10 10
3E+04 3 7 10
3E+05 8 2 10
3E+06 10 0 10


Goodness of fit and model selection
Model Deviance Δ Degrees 
of freedom
χ20.95,1 
p-value
χ20.95,m-k 
p-value
Exponential 8.56 1.81 5 3.84 
0.178
11.1 
0.128
Beta Poisson 6.75 4 9.49 
0.15
Exponential is preferred to beta-Poisson; cannot reject good fit for exponential.


Optimized parameters for the exponential model, from 10000 bootstrap iterations
Parameter MLE estimate Percentiles
0.5% 2.5% 5% 95% 97.5% 99.5%
k 7.11E-06 2.60E-06 3.52E-06 3.87E-06 1.61E-05 1.97E-05 2.85E-05
ID50/LD50/ETC* 9.75E+04 2.43E+04 3.52E+04 4.30E+04 1.79E+05 1.97E+05 2.66E+05
*Not a parameter of the exponential model; however, it facilitates comparison with other models.

Parameter histogram for exponential model (uncertainty of the parameter)
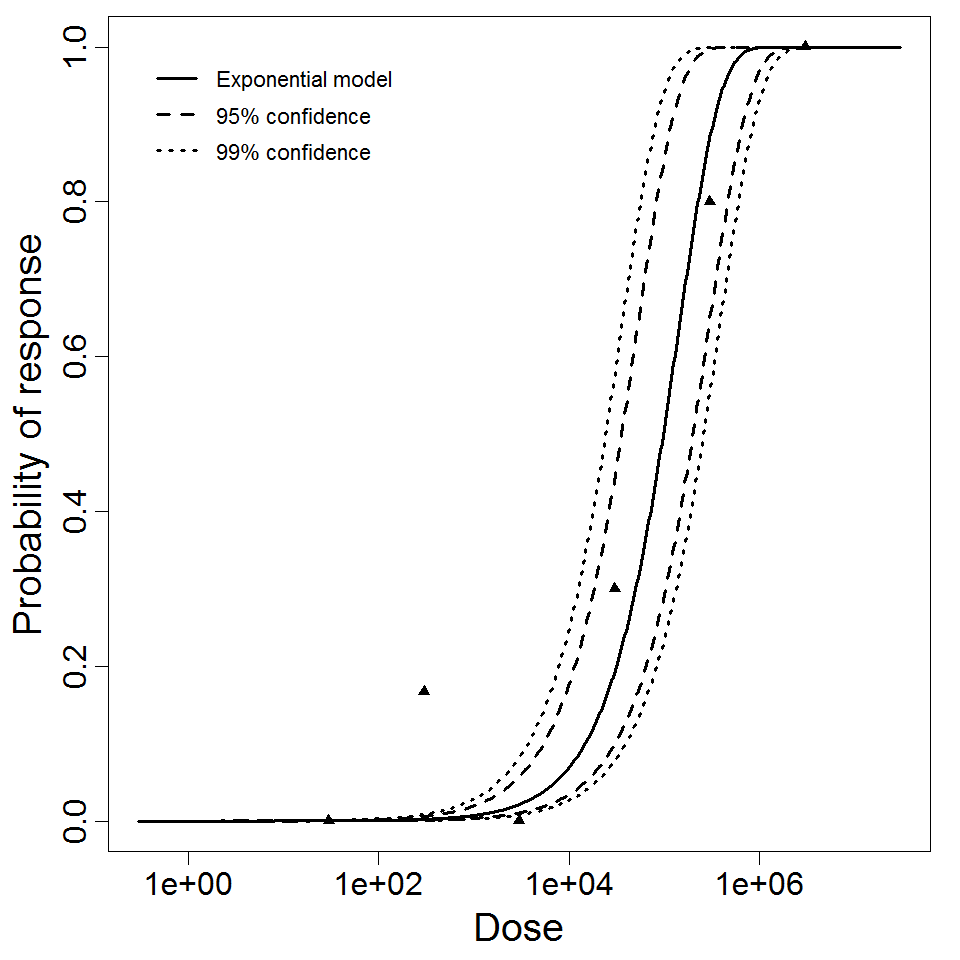
 

Exponential model plot, with confidence bounds around optimized model

# of Doses
6.00
Μodel
LD50/ID50
9.75E+04
Dose Units
Response
Exposure Route
Contains Preferred Model
k
7.11E-06
Agent Strain
ATCC 6605
Experiment ID
85
Host type
Description
Guinea pig/Vollum Strain model data 
Dose Dead Survived Total
200 0 4 4
2000 0 8 8
2E+04 6 6 12
2E+05 10 2 12
2E+06 7 1 8
2E+07 7 0 7


Goodness of fit and model selection
Model Deviance Δ Degrees 
of freedom
χ20.95,1 
p-value
χ20.95,m-k 
p-value
Exponential 29.2 26.6 5 3.84 
2.46e-07
11.1 
2.11e-05
Beta Poisson 2.58 4 9.49 
0.631
Beta-Poisson fits better than exponential; cannot reject good fit for beta-Poisson.


Optimized parameters for the beta-Poisson model, from 10000 bootstrap iterations
Parameter MLE estimate Percentiles
0.5% 2.5% 5% 95% 97.5% 99.5%
α 5.49E-01 2.55E-01 3.03E-01 3.32E-01 5.51E+00 2.45E+03 6.16E+03
N50 2.85E+04 1.00E+04 1.25E+04 1.43E+04 6.57E+04 7.85E+04 1.09E+05


Parameter scatter plot for beta Poisson model ellipses signify the 0.9, 0.95 and 0.99 confidence of the parameters.
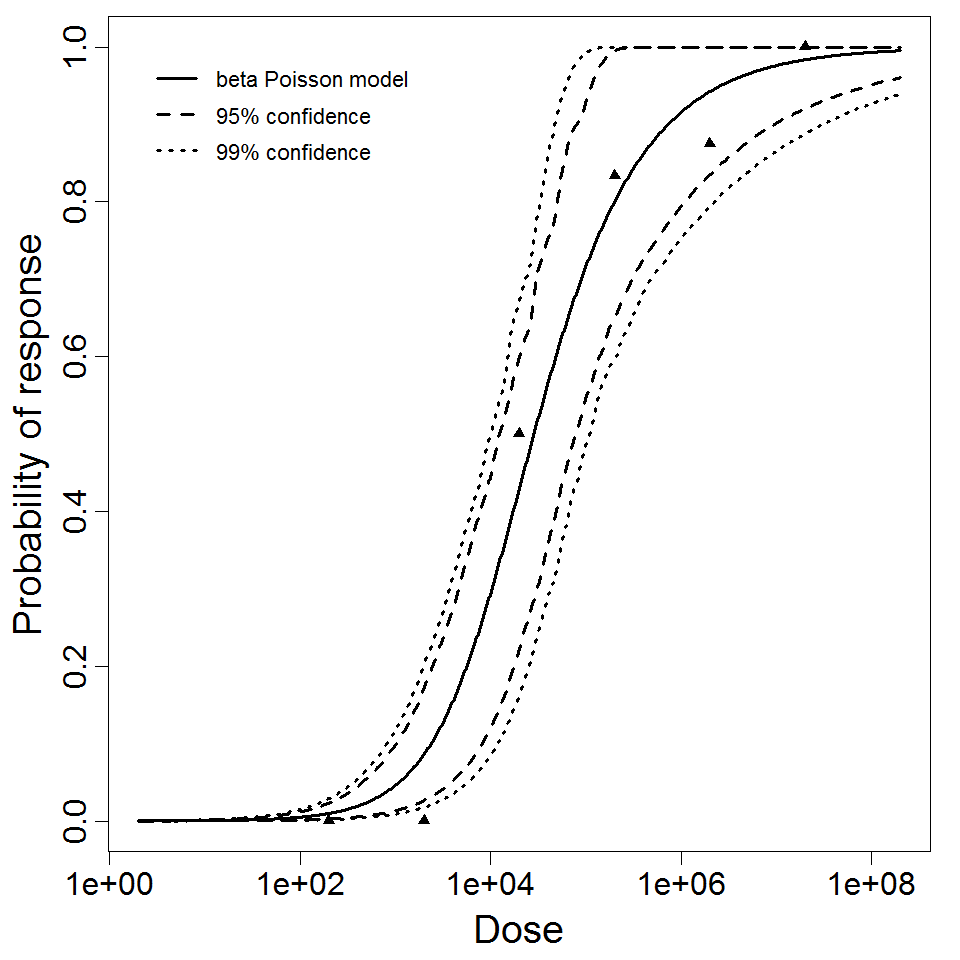
beta Poisson model plot, with confidence bounds around optimized model

# of Doses
6.00
Μodel
N50
2.85E+04
LD50/ID50
2.85E+04
Dose Units
Response
Exposure Route
Contains Preferred Model
a
5.49E-01
Agent Strain
Vollum
Experiment ID
84
Host type
Description
Humans/ type 4 Strain model data 
Dose Infected Non-infected Total
1 1 2 3
5 3 0 3
11 3 0 3
1000 6 0 6


Goodness of fit and model selection
Model Deviance Δ Degrees 
of freedom
χ20.95,1 
p-value
χ20.95,m-k 
p-value
Exponential 0.487 -0.000723 3 3.84 
1
7.81 
0.922
Beta Poisson 0.488 2 5.99 
0.784
Exponential is preferred to beta-Poisson; cannot reject good fit for exponential.


Optimized k parameter for the exponential model, from 10000 bootstrap iterations
Parameter MLE estimate Percentiles
0.5% 2.5% 5% 95% 97.5% 99.5%
k 6.07E-01 3.87E-01 3.87E-01 3.87E-01 1.13E+00 1.13E+00 1.13E+00
ID50/LD50/ETC* 1.14E+00 6.11E-01 6.11E-01 6.11E-01 1.79E+00 1.79E+00 1.79E+00
*Not a parameter of the exponential model; however, it facilitates comparison with other models.


Parameter histogram for exponential model (uncertainty of the parameter)

Exponential model plot, with confidence bounds around optimized model

# of Doses
4.00
Μodel
LD50/ID50
1.14E+00
Dose Units
Response
Exposure Route
Contains Preferred Model
k
6.07E-01
Agent Strain
type 4
Experiment ID
31
Host type
Description

Optimization Output for experiment 274

Monkeys / SCHU S-4 model data 
Dose Dead Survived Total
5 1 5 6
11 3 3 6
32 4 2 6
65 6 0 6


Goodness of fit and model selection
Model Deviance Δ Degrees 
of freedom
χ20.95,1 
p-value
χ20.95,m-k 
p-value
Exponential 1.26 -0.000367 3 3.84 
1
7.81 
0.738
Beta Poisson 1.26 2 5.99 
0.531
Exponential is preferred to beta-Poisson; cannot reject good fit for exponential.


Optimized k parameter for the exponential model, from 10000 bootstrap iterations
Parameter MLE estimate Percentiles
0.5% 2.5% 5% 95% 97.5% 99.5%
k 4.73E-02 2.28E-02 2.72E-02 2.98E-02 7.81E-02 9.03E-02 1.11E-01
ID50/LD50/ETC* 1.46E+01 6.27E+00 7.67E+00 8.88E+00 2.33E+01 2.55E+01 3.04E+01
*Not a parameter of the exponential model; however, it facilitates comparison with other models.


Parameter histogram for exponential model (uncertainty of the parameter)
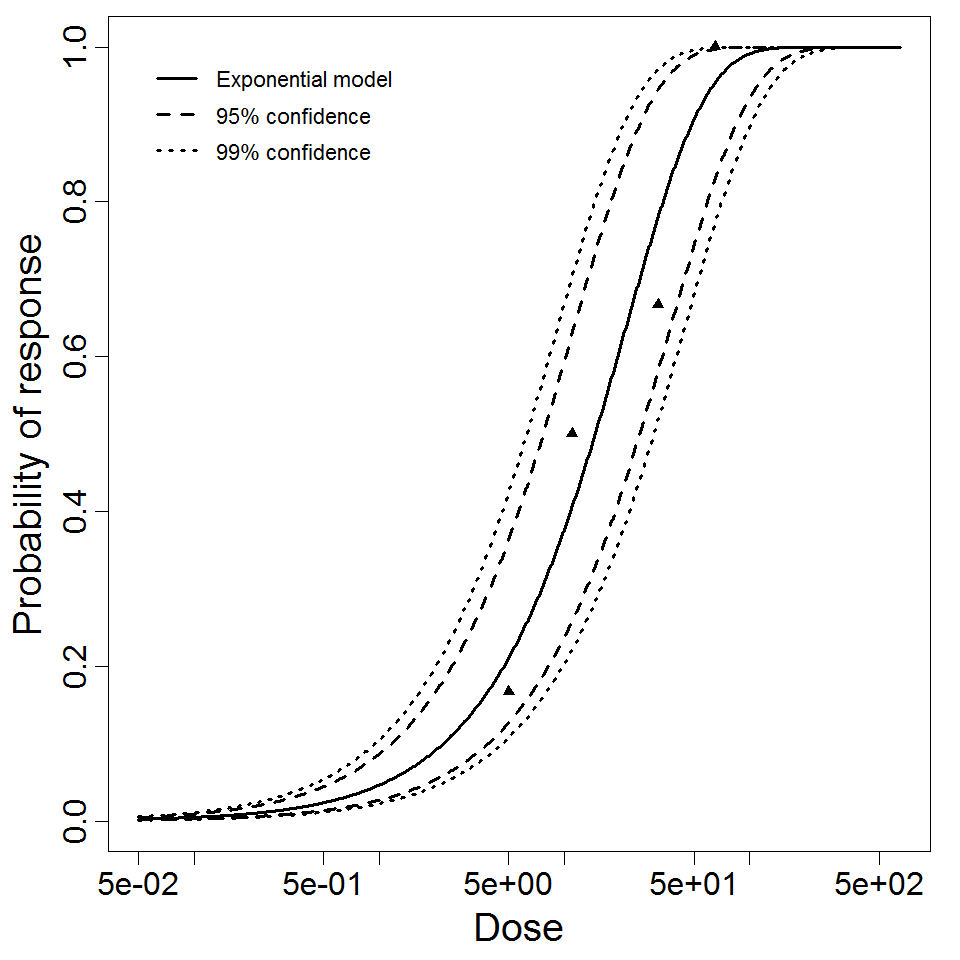
Exponential model plot, with confidence bounds around optimized model

# of Doses
4.00
Μodel
LD50/ID50
1.46E+01
Dose Units
Response
Exposure Route
Contains Preferred Model
k
4.73E-02
Agent Strain
SCHU S-4
Experiment ID
274
Host type
Description
Guinea pigs/ Philadelphia 1 Strain model data
Dose Dead Survived Total
1E+04 1 4 5
15000 0 3 3
2E+04 5 2 7
5E+04 3 0 3
1E+05 5 0 5


Goodness of fit and model selection
Model Deviance Δ Degrees 
of freedom
χ20.95,1 
p-value
χ20.95,m-k 
p-value
Exponential 5.85 -0.000131 4 3.84 
1
9.49 
0.211
Beta Poisson 5.85 3 7.81 
0.119
Exponential is preferred to beta-Poisson; cannot reject good fit for exponential.


Optimized k parameter for the exponential model, from 10000 bootstrap iterations
Parameter MLE estimate Percentiles
0.5% 2.5% 5% 95% 97.5% 99.5%
k 4.17E-05 2.29E-05 2.68E-05 3.00E-05 5.87E-05 6.78E-05 7.86E-05
ID50/LD50/ETC* 1.66E+04 8.82E+03 1.02E+04 1.18E+04 2.31E+04 2.59E+04 3.03E+04
*Not a parameter of the exponential model; however, it facilitates comparison with other models.


Parameter histogram for exponential model (uncertainty of the parameter)
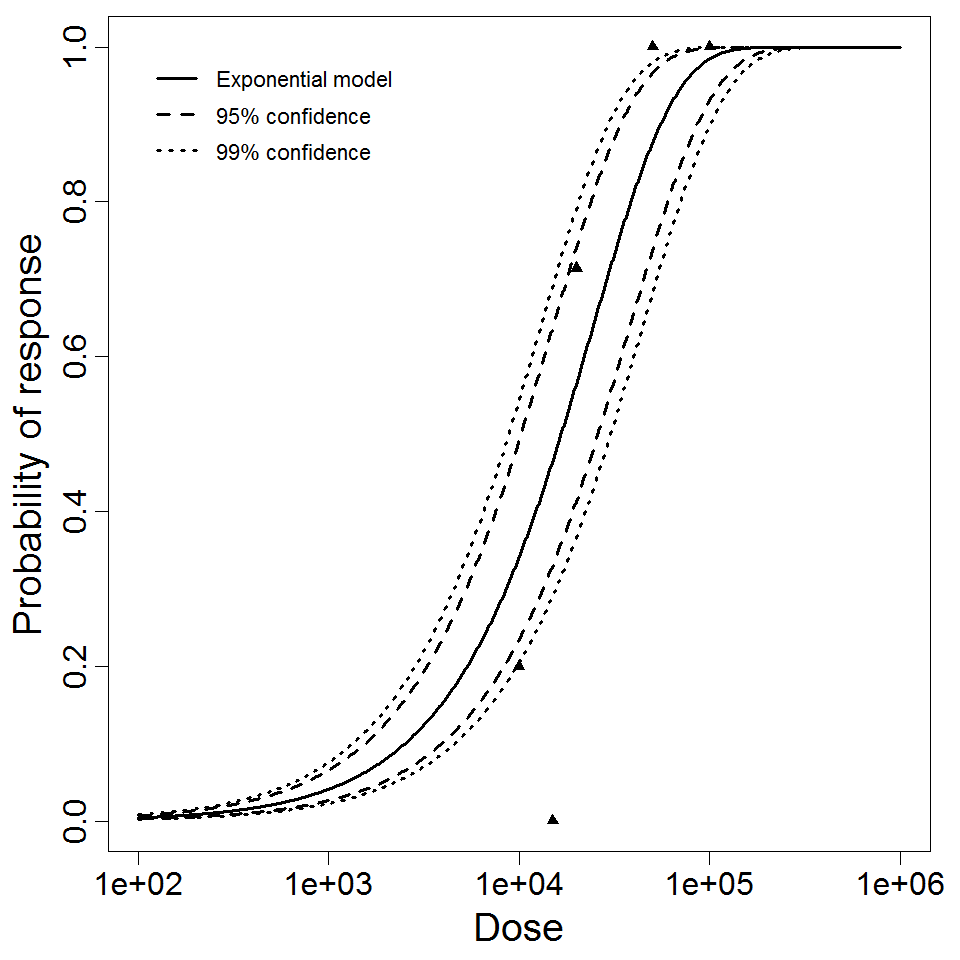
Exponential model plot, with confidence bounds around optimized model

# of Doses
5.00
Μodel
LD50/ID50
1.66E+04
Dose Units
Response
Exposure Route
Contains Preferred Model
k
4.17E-05
Agent Strain
Philadelphia 1
Experiment ID
243
Host type