Description
|
| ||||||||||||||||||||||
| ||||||||||||||||||||||||||||||||||||||

# of Doses
3.00
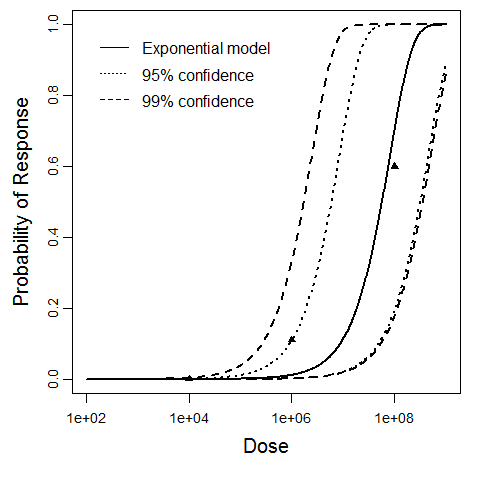
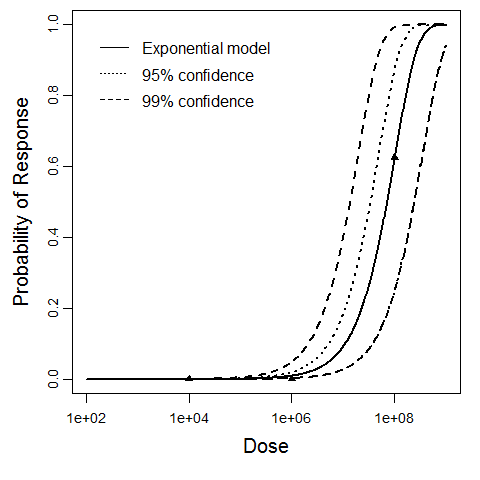
Μodel
LD50/ID50
5.7E+07
Dose Units
Response
Exposure Route
Contains Preferred Model
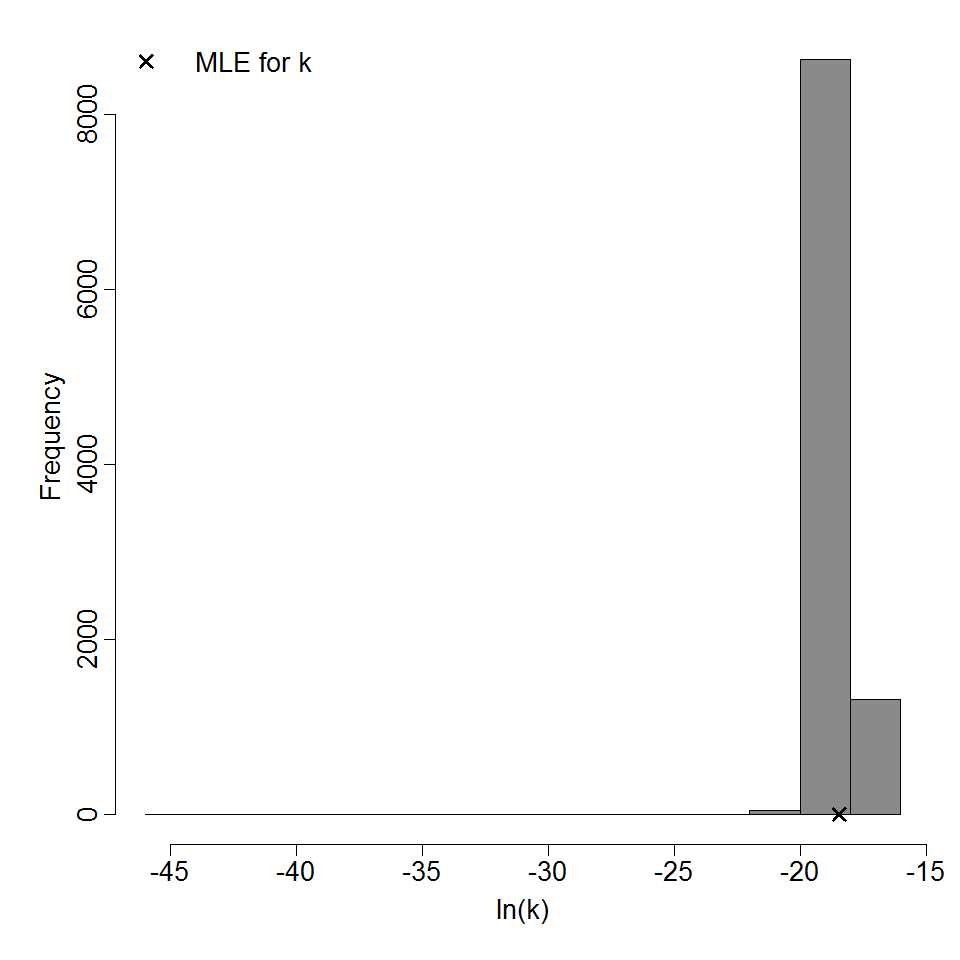
k
1.22E-08
Agent Strain
EIEC 1624
Experiment ID
40
Host type
Experiment Dataset
Description
|
| ||||||||||||||||||||||
| ||||||||||||||||||||||||||||||||||||||
# of Doses
6.00
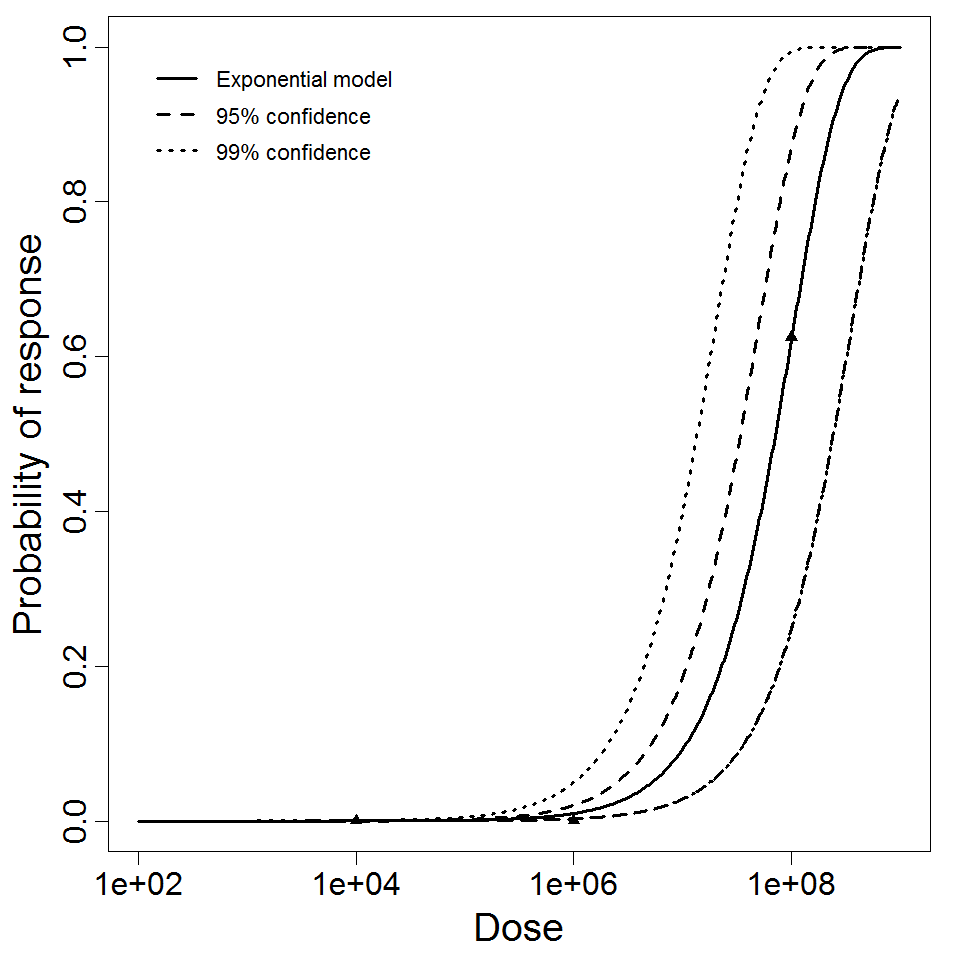
Μodel
LD50/ID50
6.5E+07
Dose Units
Response
Exposure Route
Contains Preferred Model
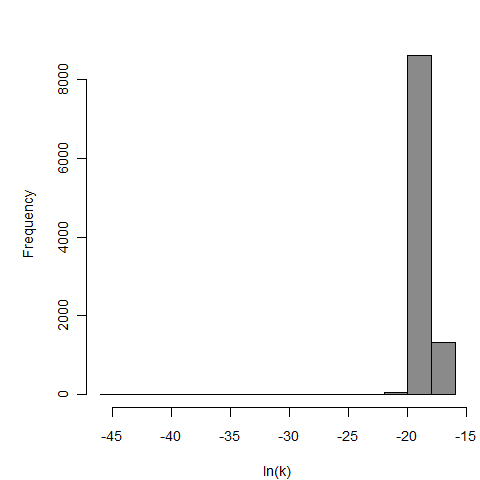
k
1.07E-08
Agent Strain
EIEC 4608
Experiment ID
39, 40
Host type
Experiment Dataset
Description
|
| ||||||||||||||||||||||
| ||||||||||||||||||||||||||||||||||||||
# of Doses
3.00
Μodel
LD50/ID50
7.14E+07
Dose Units
Response
Exposure Route
Contains Preferred Model
k
9.7E-09
Agent Strain
EIEC 4608
Experiment ID
39
Host type
Experiment Dataset
Description
|
| ||||||||||||||||||||||
| ||||||||||||||||||||||||||||||
# of Doses
11.00
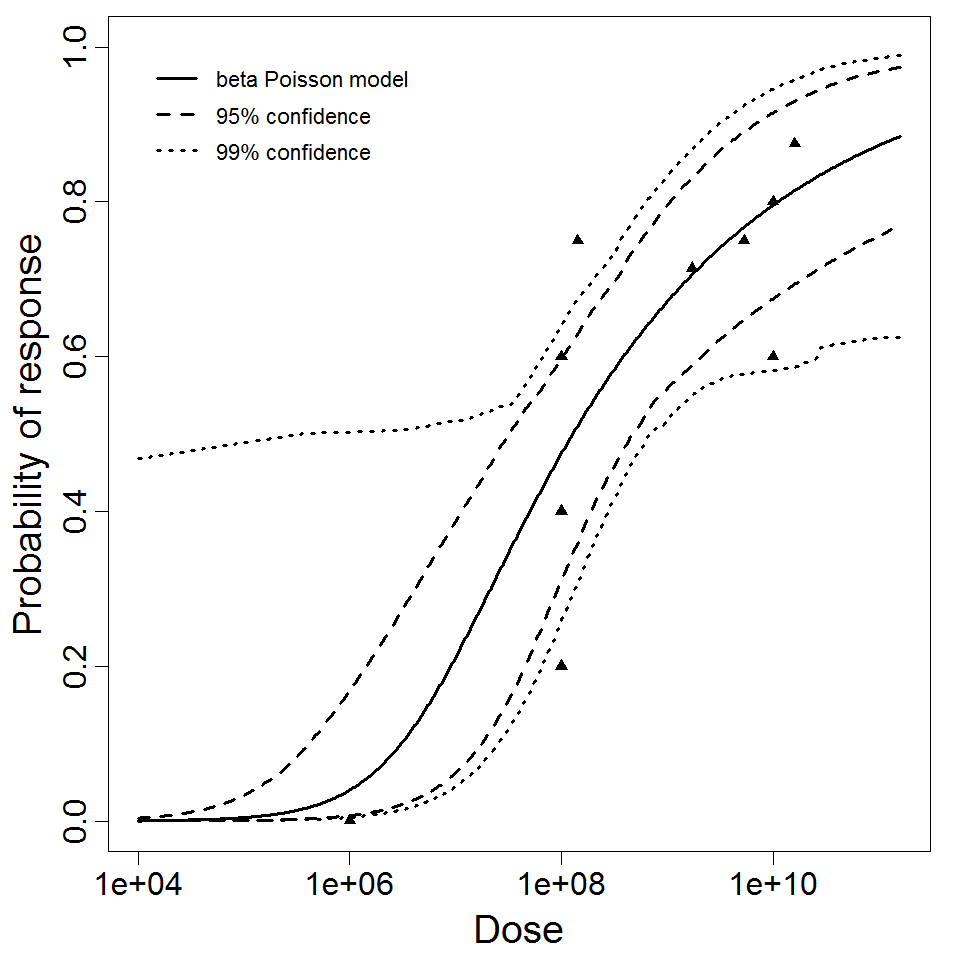
Μodel
N50
1.28E+08
LD50/ID50
1.28E+08
Dose Units
Response
Exposure Route
Contains Preferred Model
a
2.06E-01
Agent Strain
ETEC B7A
Experiment ID
38, 42, 99, 165
Host type
Experiment Dataset
Description
|
| ||||||||||||||||||||||
| ||||||||||||||||||||||||||||||

# of Doses
15.00
Μodel
N50
8.6E+07
LD50/ID50
8.6E+07
Dose Units
Response
Exposure Route
Contains Preferred Model
a
1.78E-01
Agent Strain
ETEC B7A
Experiment ID
38, 39, 40, 42, 99, 144
Host type
Experiment Dataset