Moredunn isolate data
| Dose |
Infected |
Non-infected |
Total |
| 100 |
2 |
2 |
4 |
| 300 |
2 |
3 |
5 |
| 1000 |
1 |
2 |
3 |
| 3000 |
3 |
1 |
4 |
|
Goodness of fit and model selection
| Model |
Deviance |
Δ |
Degrees
of freedom |
χ20.95,1
p-value
|
χ20.95,m-k
p-value
|
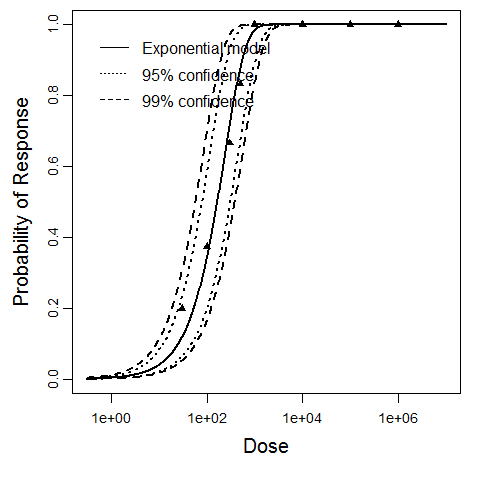
| Exponential |
7.37 |
6.16 |
3 |
3.84
0.0131
|
7.81
0.0611
|
| Beta Poisson |
1.21 |
2 |
5.99
0.546
|
| Beta-Poisson fits better than exponential; cannot reject good fit for beta-Poisson. |
|
Optimized parameters for the beta-Poisson model, from 10000 bootstrap iterations
| Parameter |
MLE estimate |
Percentiles |
| 0.5% |
2.5% |
5% |
95% |
97.5% |
99.5% |
| α |
1.14E-01 |
9.79E-04 |
9.81E-04 |
9.82E-04 |
1.17E+03 |
2.25E+03 |
5.52E+03 |
| N50
|
4.55E+02 |
2.13E-09 |
2.19E-06 |
1.55E-05 |
5.62E+05 |
3.59E+09 |
1.43E+16 |
|

Parameter scatter plot for beta Poisson model ellipses signify the 0.9, 0.95 and 0.99 confidence of the parameters.

beta Poisson model plot, with confidence bounds around optimized model.