Description
humans/ echovirus-12 strain 
Dose infected Non-infected Total
330 15 35 50
1000 9 11 20
3300 19 7 26
1E+04 12 0 12


Goodness of fit and model selection
Model Deviance Δ Degrees 
of freedom
χ20.95,1 
p-value
χ20.95,m-k 
p-value
Exponential 7.39 4.18 3 3.84 
0.041
7.81 
0.0605
Beta Poisson 3.21 2 5.99 
0.201
Beta-Poisson fits better than exponential; cannot reject good fit for beta-Poisson.


Optimized parameters for the beta-Poisson model, from 10000 bootstrap iterations
Parameter MLE estimate Percentiles
0.5% 2.5% 5% 95% 97.5% 99.5%
α 1.06E+00 3.07E-01 4.04E-01 4.69E-01 1.23E+01 6.22E+02 3.74E+04
N50 9.22E+02 4.68E+02 5.59E+02 6.15E+02 1.37E+03 1.49E+03 1.73E+03


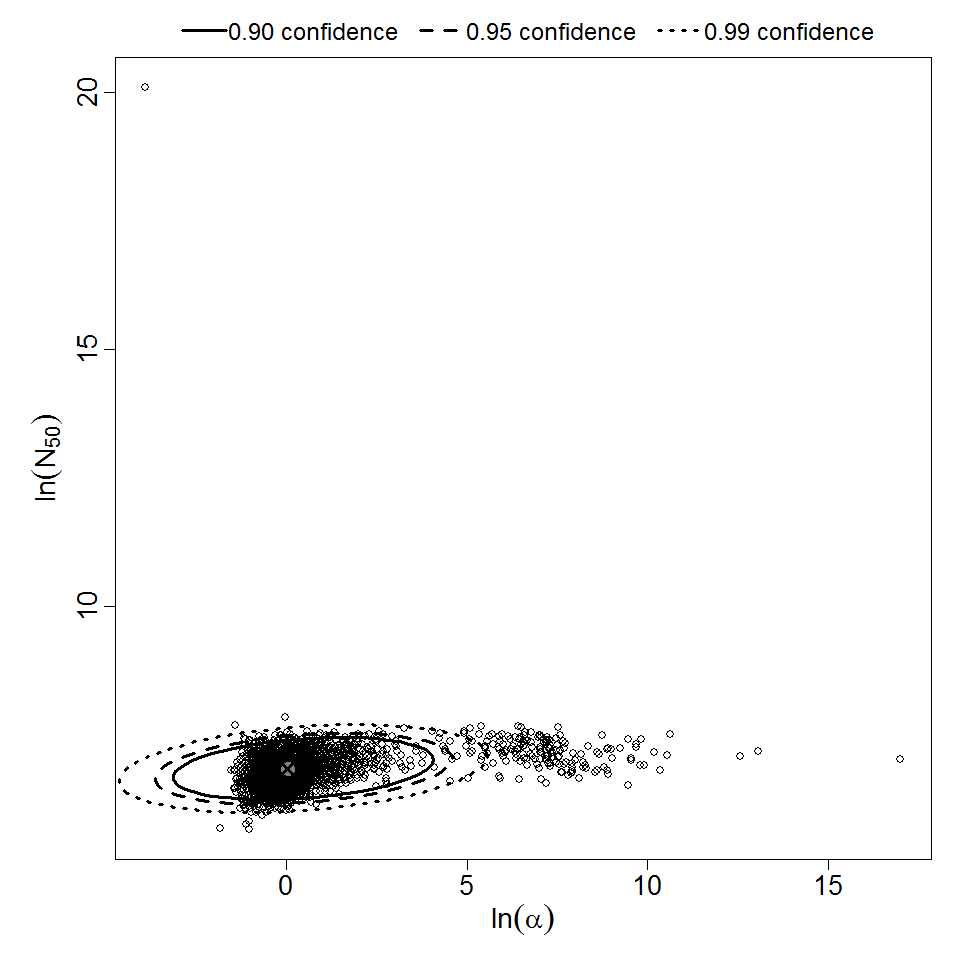
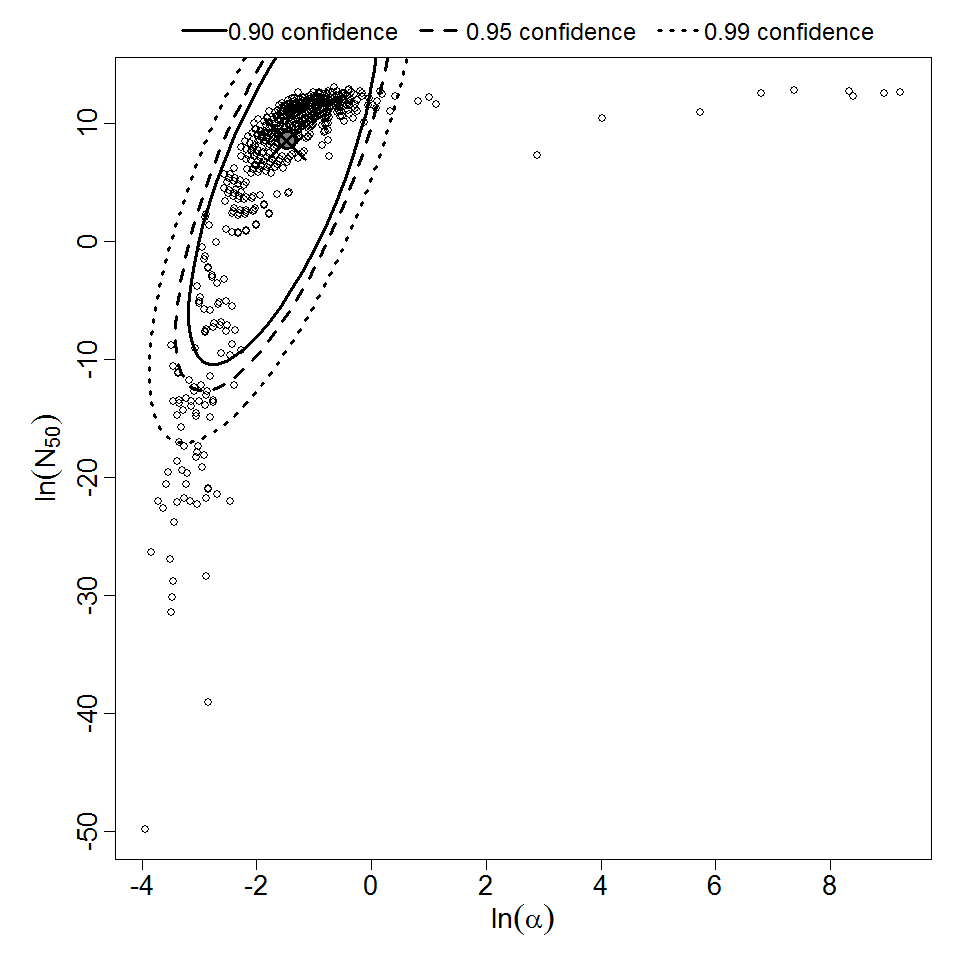
Parameter scatter plot for beta Poisson model ellipses signify the 0.9, 0.95 and 0.99 confidence of the parameters.
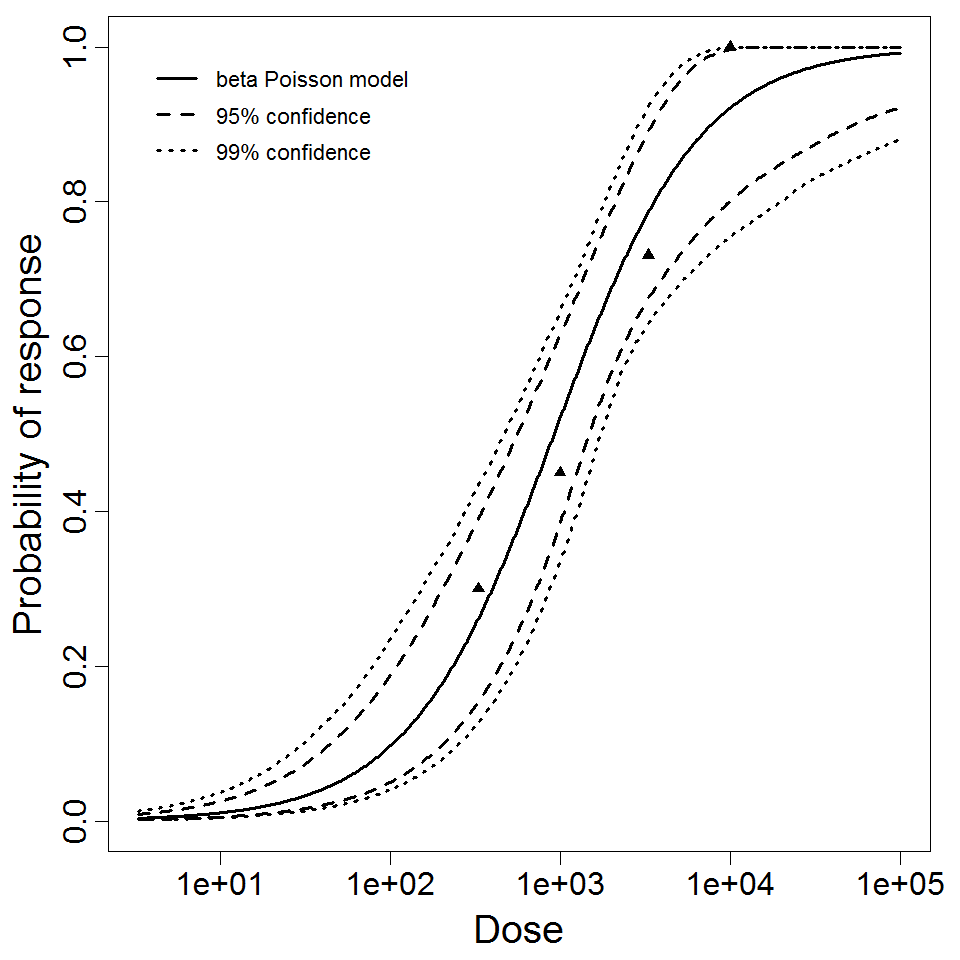
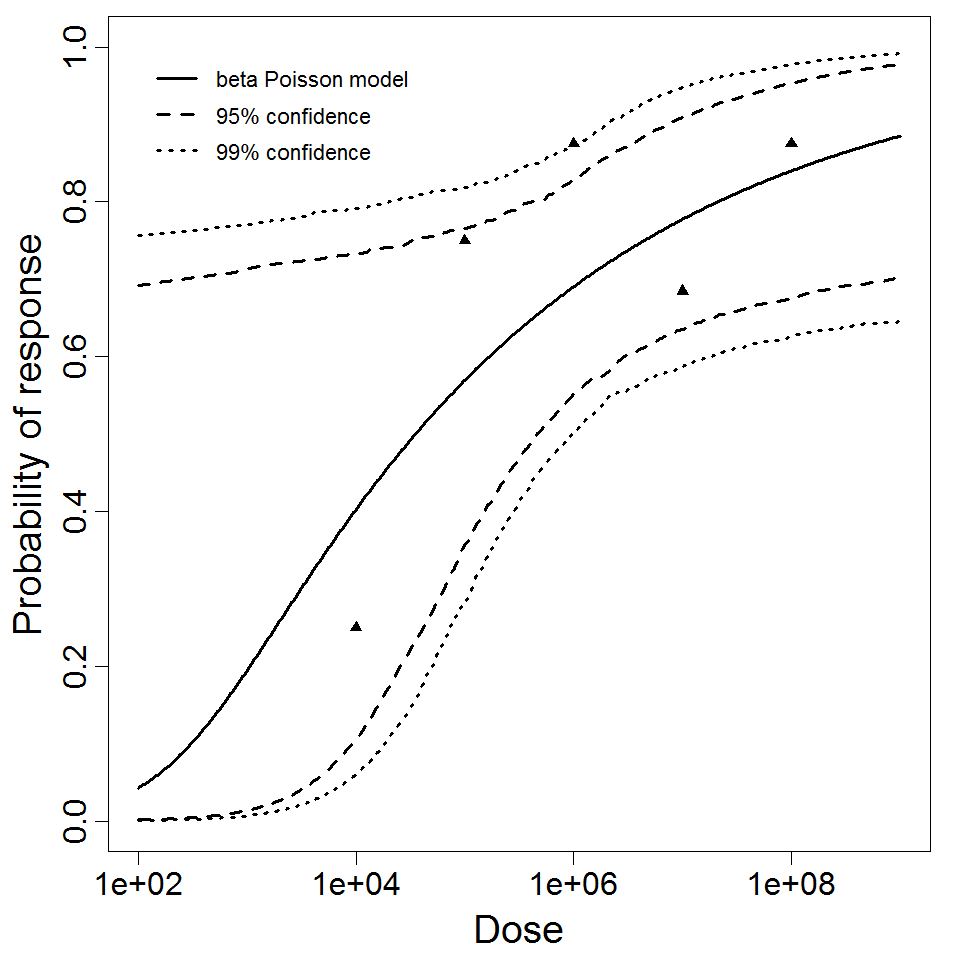
beta Poisson model plot, with confidence bounds around optimized model

# of Doses
4.00
Μodel
N50
9.22E+02
LD50/ID50
9.22E+02
Dose Units
Response
Exposure Route
Contains Preferred Model
a
1.06E+00
Agent Strain
strain 12
Experiment ID
256 (excluding the outliers of exp 112)
Host type
Description
Humans/ type 4 Strain model data 
Dose Infected Non-infected Total
3 0 6 6
10 0 2 2
14 1 1 2
79 2 1 3
400 3 0 3


Goodness of fit and model selection
Model Deviance Δ Degrees 
of freedom
χ20.95,1 
p-value
χ20.95,m-k 
p-value
Exponential 2.14 -0.00118 4 3.84 
1
9.49 
0.71
Beta Poisson 2.14 3 7.81 
0.544
Exponential is preferred to beta-Poisson; cannot reject good fit for exponential.


Optimized k parameter for the exponential model, from 10000 bootstrap iterations
Parameter MLE estimate Percentiles
0.5% 2.5% 5% 95% 97.5% 99.5%
k 1.51E-02 4.00E-03 5.88E-03 6.35E-03 4.56E-02 4.56E-02 4.56E-02
ID50/LD50/ETC* 4.59E+01 1.52E+01 1.52E+01 1.52E+01 1.09E+02 1.18E+02 1.73E+02
*Not a parameter of the exponential model; however, it facilitates comparison with other models.


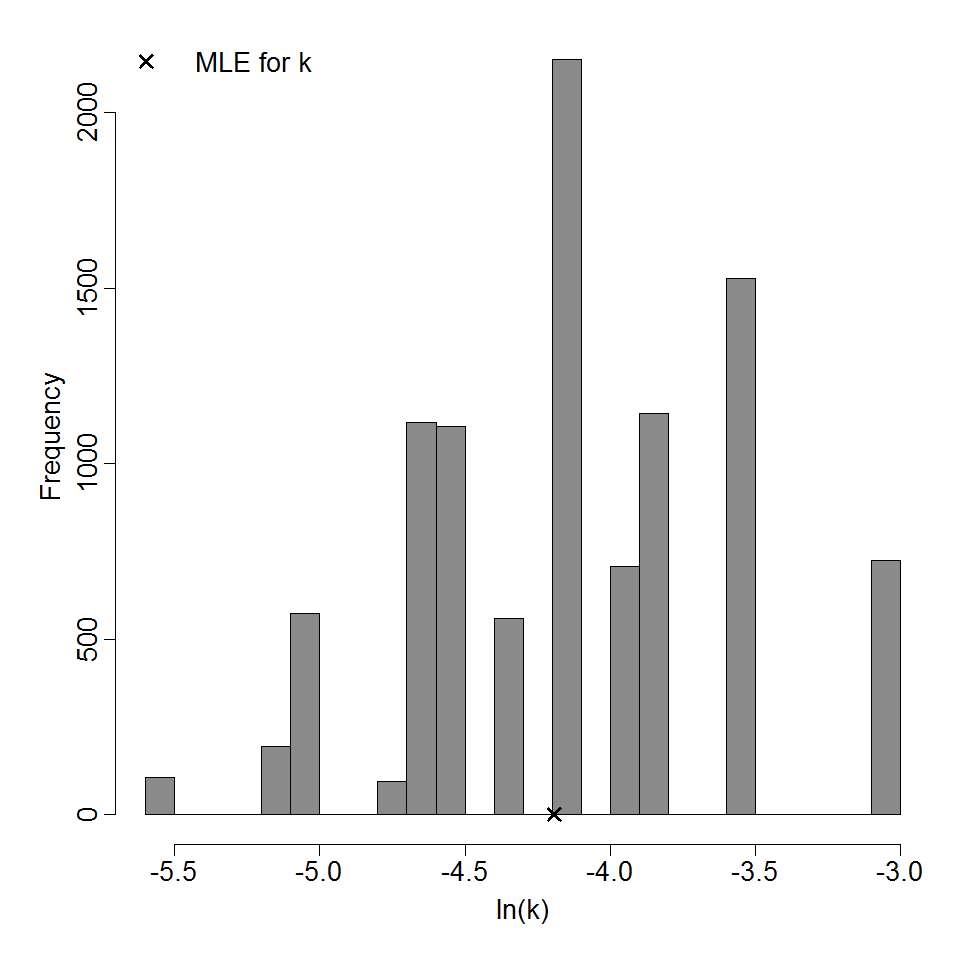
Parameter histogram for exponential model (uncertainty of the parameter)
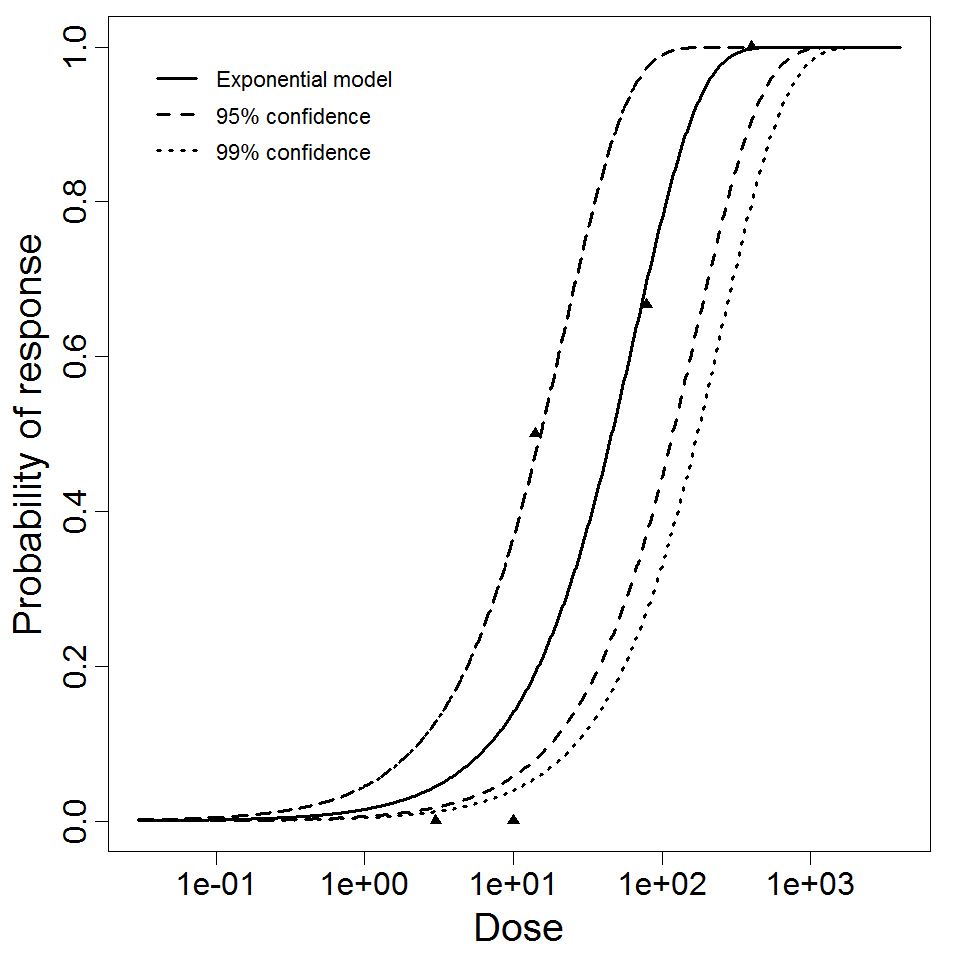
Exponential model plot, with confidence bounds around optimized model

# of Doses
5.00
Μodel
LD50/ID50
4.59E+01
Dose Units
Response
Exposure Route
Contains Preferred Model
k
1.51E-02
Agent Strain
type 4
Experiment ID
255
Host type
Description
Human Inaba Strain 569B  
Dose Infected Non-infected Total
10 0 2 2
1000 3 1 4
1E+04 11 2 13
1E+05 7 1 8
1E+06 21 2 23
1E+08 2 0 2


Goodness of fit and model selection
Model Deviance Δ Degrees 
of freedom
χ20.95,1 
p-value
χ20.95,m-k 
p-value
Exponential 92.4 91.2 5 3.84 
0
11.1 
0
Beta Poisson 1.16 4 9.49 
0.885
Beta-Poisson fits better than exponential; cannot reject good fit for beta-Poisson.


Optimized parameters for the beta-Poisson model, from 10000 bootstrap iterations
Parameter MLE estimate Percentiles
0.5% 2.5% 5% 95% 97.5% 99.5%
α 2.5E-01 1.14E-01 1.48E-01 1.66E-01 5.44E-01 6.55E-01 2.91E+00
N50 2.43E+02 1.88E+01 4.82E+01 6.35E+01 1.52E+03 2.08E+03 3.60E+03


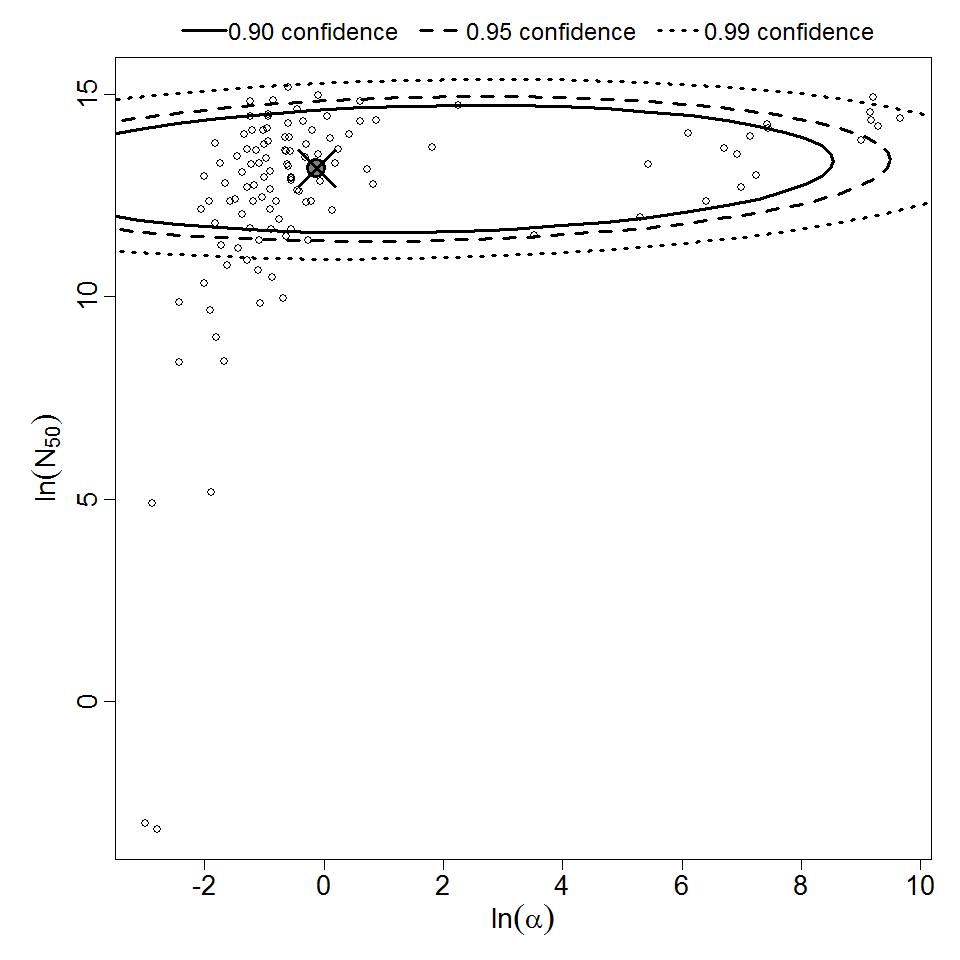
Parameter scatter plot for beta Poisson model ellipses signify the 0.9, 0.95 and 0.99 confidence of the parameters.
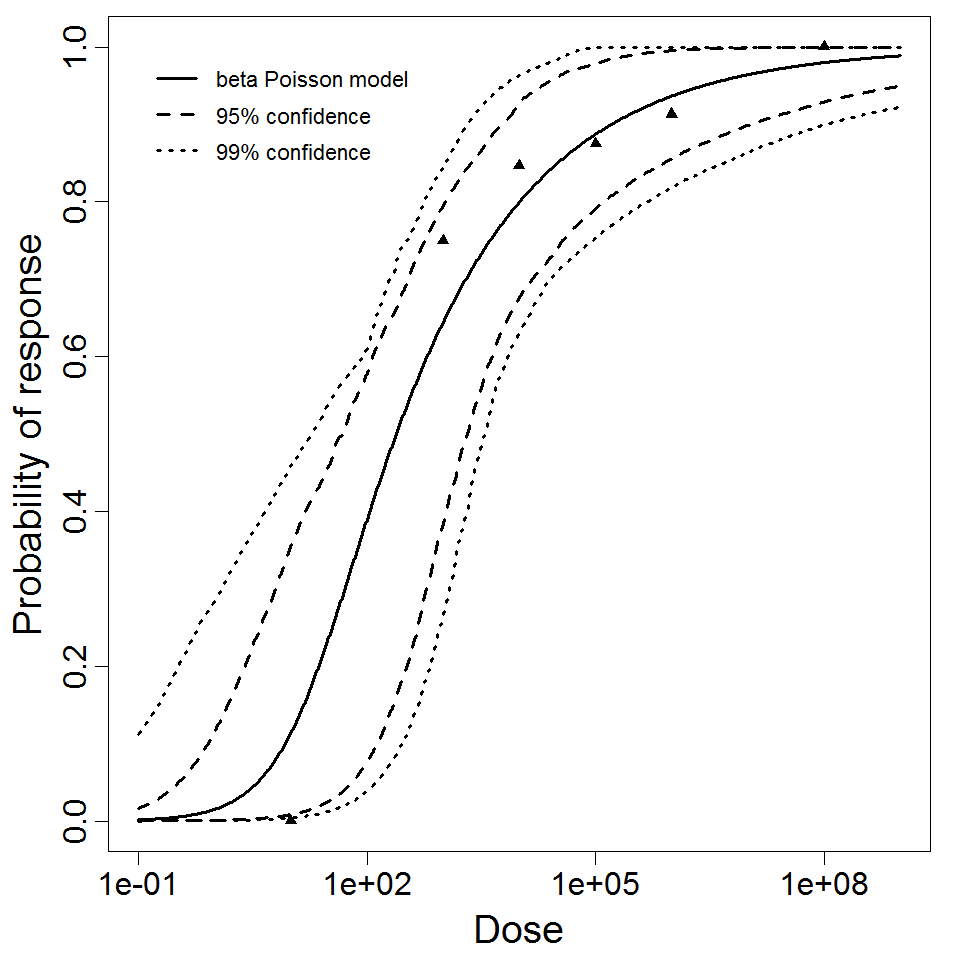
beta Poisson model plot, with confidence bounds around optimized model

# of Doses
6.00
Μodel
N50
2.43E+02
LD50/ID50
2.43E+02
Dose Units
Response
Exposure Route
Contains Preferred Model
a
2.50E-01
Agent Strain
Inaba 569B
Experiment ID
249
Host type
Description
Human/ S. meleagridis strain III data 
Dose Infected Non-infected Total
158000 1 5 6
1.5E+06 5 1 6
7680000 6 0 6
1E+07 5 1 6


Goodness of fit and model selection
Model Deviance Δ Degrees 
of freedom
χ20.95,1 
p-value
χ20.95,m-k 
p-value
Exponential 7.81 5.51 3 3.84 
0.019
7.81 
0.0501
Beta Poisson 2.3 2 5.99 
0.316
Beta-Poisson fits better than exponential; cannot reject good fit for beta-Poisson.


Optimized parameters for the beta-Poisson model, from 10000 bootstrap iterations
Parameter MLE estimate Percentiles
0.5% 2.5% 5% 95% 97.5% 99.5%
α 8.85E-01 1.78E-01 2.91E-01 3.68E-01 1.40E+03 1.71E+03 8.24E+03
N50 5.24E+05 4.71E+04 1.20E+05 1.92E+05 1.19E+06 1.39E+06 1.90E+06


Parameter scatter plot for beta Poisson model ellipses signify the 0.9, 0.95 and 0.99 confidence of the parameters.

beta Poisson model plot, with confidence bounds around optimized model

# of Doses
4.00
Μodel
N50
5.24E+05
LD50/ID50
5.24E+05
Dose Units
Response
Exposure Route
Contains Preferred Model
a
8.85E-01
Agent Strain
strain III
Experiment ID
240
Host type
Description
Human / S. meleagridis strain I data
Dose Infected Non-infected Total
12000 3 3 6
24000 4 2 6
52000 3 3 6
96000 3 3 6
155000 5 1 6
3E+05 6 0 6
720000 4 1 5
1150000 6 0 6
5.5E+06 5 1 6
2.4E+07 5 0 5
5E+07 6 0 6


Goodness of fit and model selection
Model Deviance Δ Degrees 
of freedom
χ20.95,1 
p-value
χ20.95,m-k 
p-value
Exponential 71.8 63.8 10 3.84 
1.33e-15
18.3 
1.98e-11
Beta Poisson 7.99 9 16.9 
0.535
Beta-Poisson fits better than exponential; cannot reject good fit for beta-Poisson.


Optimized parameters for the beta-Poisson model, from 10000 bootstrap iterations
Parameter MLE estimate Percentiles
0.5% 2.5% 5% 95% 97.5% 99.5%
α 3.89E-01 1.23E-01 1.74E-01 2.01E-01 1.12E+00 1.91E+00 3.82E+02
N50 1.68E+04 7.98E+01 1.08E+03 2.27E+03 4.78E+04 5.71E+04 7.49E+04


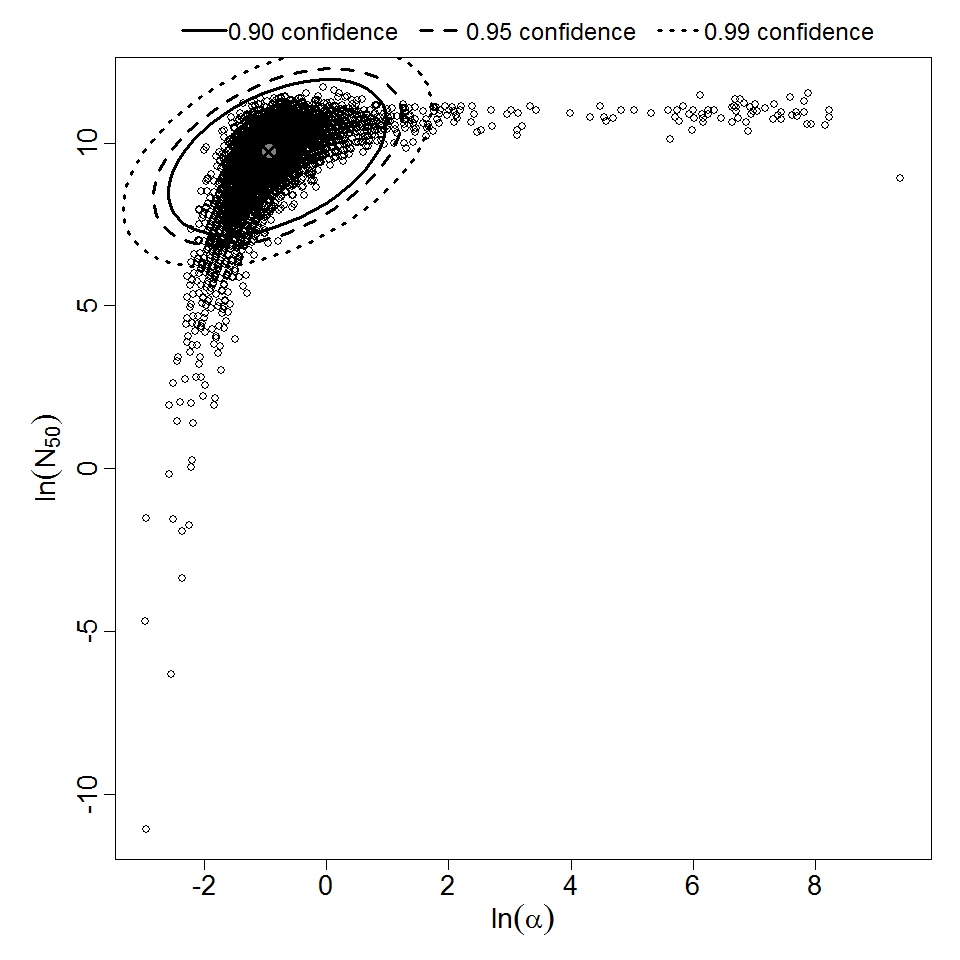
Parameter scatter plot for beta Poisson model ellipses signify the 0.9, 0.95 and 0.99 confidence of the parameters.
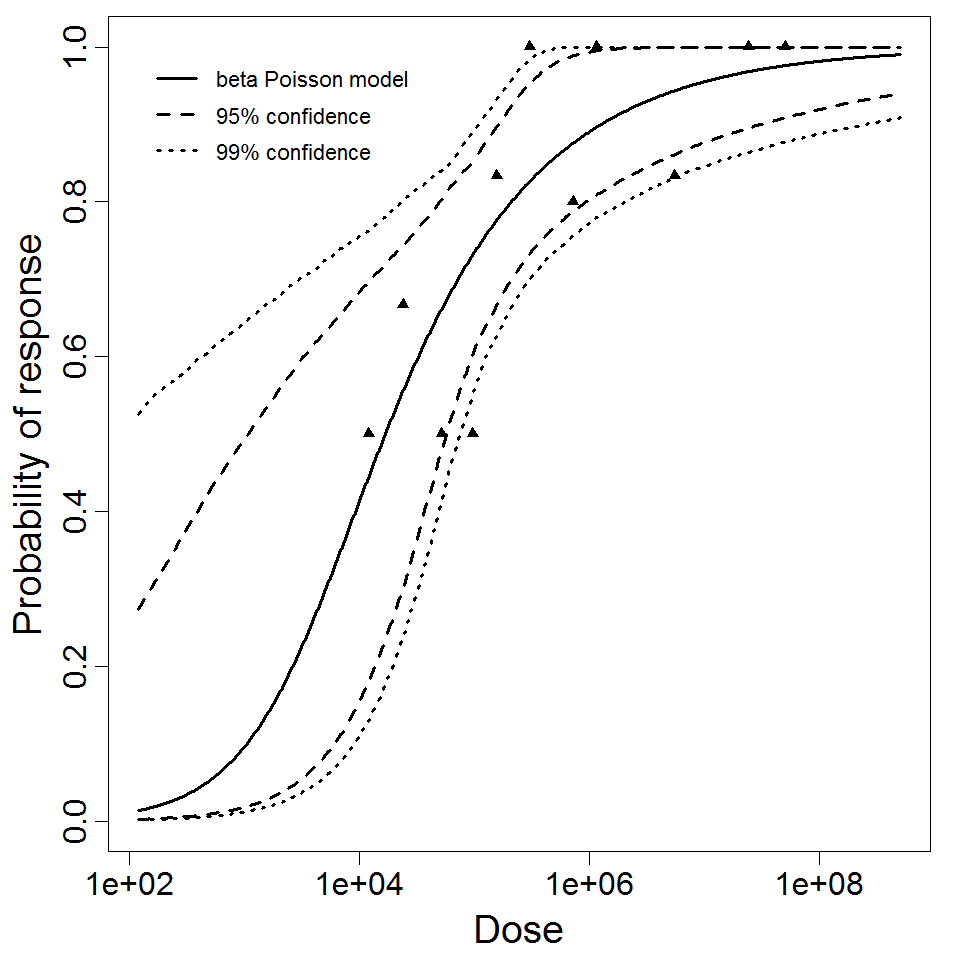
beta Poisson model plot, with confidence bounds around optimized model

# of Doses
11.00
Μodel
N50
1.68E+04
LD50/ID50
1.68E+04
Dose Units
Response
Exposure Route
Contains Preferred Model
a
3.89E-01
Agent Strain
strain I
Experiment ID
238
Host type
Description
Human/Salmonella newportmodel data ]
Dose Infected Non-infected Total
152000 3 3 6
385000 6 2 8
1350000 6 0 6


Goodness of fit and model selection
Model Deviance Δ Degrees 
of freedom
χ20.95,1 
p-value
χ20.95,m-k 
p-value
Exponential 0.16 -3.32e-05 2 3.84 
1
5.99 
0.923
Beta Poisson 0.16 1 3.84 
0.689
Exponential is preferred to beta-Poisson; cannot reject good fit for exponential.


Optimized k parameter for the exponential model, from 10000 bootstrap iterations
Parameter MLE estimate Percentiles
0.5% 2.5% 5% 95% 97.5% 99.5%
k 3.97E-06 1.75E-06 2.16E-06 2.32E-06 7.36E-06 9.04E-06 1.27E-05
ID50/LD50/ETC* 1.74E+05 5.45E+04 7.67E+04 9.41E+04 2.98E+05 3.20E+05 3.97E+05
*Not a parameter of the exponential model; however, it facilitates comparison with other models.


Parameter histogram for exponential model (uncertainty of the parameter)

Exponential model plot, with confidence bounds around optimized model

# of Doses
3.00
Μodel
LD50/ID50
1.74E+05
Dose Units
Response
Exposure Route
Contains Preferred Model
k
3.97E-06
Agent Strain
*Salmonella newport*
Experiment ID
235
Host type
Description
Human/ Salmonella anatum strain II data [4]
Dose Positive stool culture No positive stool culture Total
89000 5 1 6
448000 4 2 6
1040000 6 0 6
3.9E+06 4 2 6
1E+07 6 0 6
2.39E+07 5 1 6
4.45E+07 6 0 6
6.73E+07 8 0 8


Goodness of fit and model selection
Model Deviance Δ Degrees 
of freedom
χ20.95,1 
p-value
χ20.95,m-k 
p-value
Exponential 62.8 54.2 7 3.84 
1.84e-13
14.1 
4.22e-11
Beta Poisson 8.6 6 12.6 
0.198
Beta-Poisson fits better than exponential; cannot reject good fit for beta-Poisson.


Optimized parameters for the beta-Poisson model, from 10000 bootstrap iterations
Parameter MLE estimate Percentiles
0.5% 2.5% 5% 95% 97.5% 99.5%
α 2.3E-01 3.63E-02 5.29E-02 6.00E-02 5.51E-01 6.70E-01 1.40E+00
N50 4.91E+03 2.59E-10 2.73E-08 4.91E-06 8.72E+04 1.23E+05 2.29E+05


Parameter scatter plot for beta Poisson model ellipses signify the 0.9, 0.95 and 0.99 confidence of the parameters.

beta Poisson model plot, with confidence bounds around optimized model

# of Doses
8.00
Μodel
N50
4.91E+03
LD50/ID50
4.91E+03
Dose Units
Exposure Route
Contains Preferred Model
a
2.3E-01
Agent Strain
strain II
Experiment ID
233
Host type
Description
Human/ Salmonella anatum strain I & II pooled data [4]
Dose Positive stool culture No positive stool culture Total
12000 2 3 5
24000 3 3 6
66000 4 2 6
89000 5 1 6
93000 1 5 6
141000 3 3 6
256000 5 1 6
448000 4 2 6
587000 4 2 6
860000 6 0 6
1040000 6 0 6
3.9E+06 4 2 6
1E+07 6 0 6
2.39E+07 5 1 6
4.45E+07 6 0 6
6.73E+07 8 0 8


Goodness of fit and model selection
Model Deviance Δ Degrees 
of freedom
χ20.95,1 
p-value
χ20.95,m-k 
p-value
Exponential 138 119 15 3.84 
0
25 
0
Beta Poisson 18.9 14 23.7 
0.168
Beta-Poisson fits better than exponential; cannot reject good fit for beta-Poisson.


Optimized parameters for the beta-Poisson model, from 10000 bootstrap iterations
Parameter MLE estimate Percentiles
0.5% 2.5% 5% 95% 97.5% 99.5%
α 3.18E-01 1.35E-01 1.71E-01 1.92E-01 5.70E-01 6.66E-01 9.56E-01
N50 3.71E+04 1.40E+03 5.50E+03 8.86E+03 8.82E+04 1.00E+05 1.30E+05


Parameter scatter plot for beta Poisson model ellipses signify the 0.9, 0.95 and 0.99 confidence of the parameters.
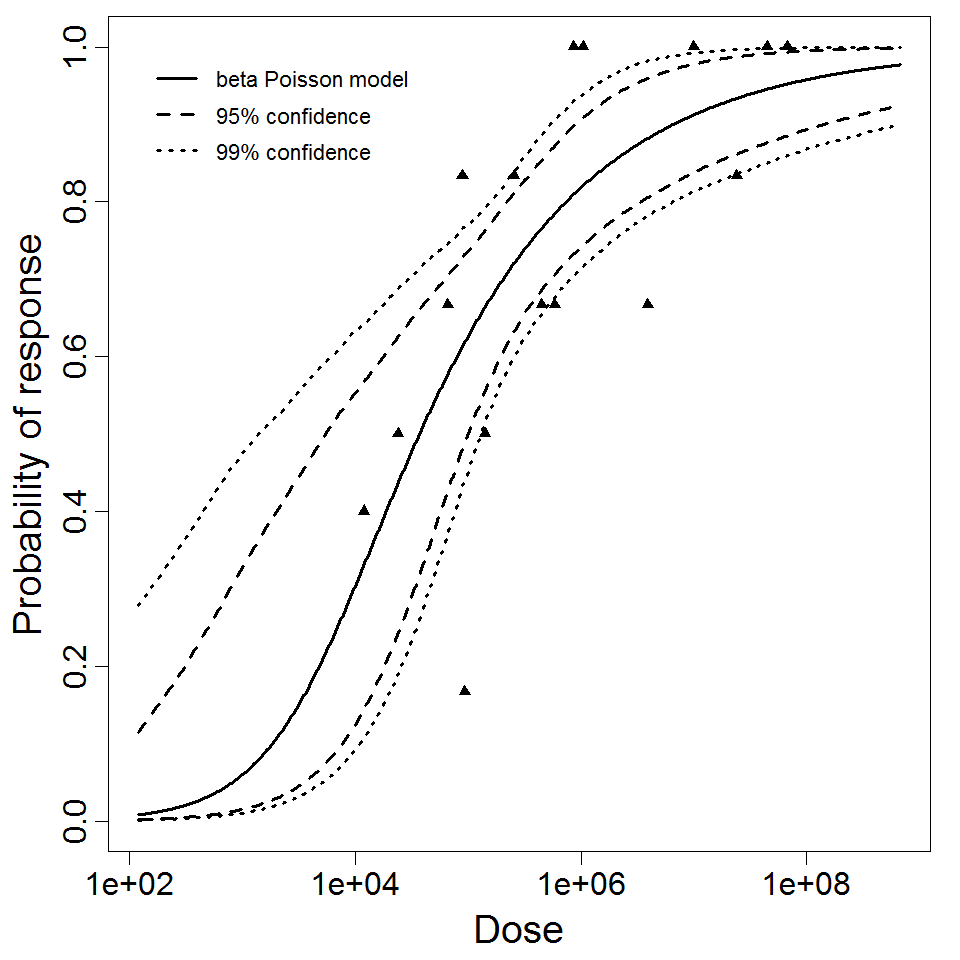
beta Poisson model plot, with confidence bounds around optimized model

# of Doses
16.00
Μodel
N50
3.71E+04
LD50/ID50
3.71E+04
Dose Units
Exposure Route
Contains Preferred Model
a
3.18E-01
Agent Strain
strain I
Experiment ID
232, 233
Host type
Description
Human / Salmonella anatum strain I data
Dose Positive stool culture No positive stool culture Total
12000 2 3 5
24000 3 3 6
66000 4 2 6
93000 1 5 6
141000 3 3 6
256000 5 1 6
587000 4 2 6
860000 6 0 6


Goodness of fit and model selection
Model Deviance Δ Degrees 
of freedom
χ20.95,1 
p-value
χ20.95,m-k 
p-value
Exponential 20.5 11 7 3.84 
0.000922
14.1 
0.00457
Beta Poisson 9.53 6 12.6 
0.146
Beta-Poisson fits better than exponential; cannot reject good fit for beta-Poisson.


Optimized parameters for the beta-Poisson model, from 10000 bootstrap iterations
Parameter MLE estimate Percentiles
0.5% 2.5% 5% 95% 97.5% 99.5%
α 2.91E-01 9.77E-04 9.77E-04 4.11E-02 1.68E+00 5.36E+00 1.20E+03
N50 4.44E+04 6.74E-02 8.03E+02 4.15E+03 1.64E+05 6.89E+06 9.07E+07


Parameter scatter plot for beta Poisson model ellipses signify the 0.9, 0.95 and 0.99 confidence of the parameters.
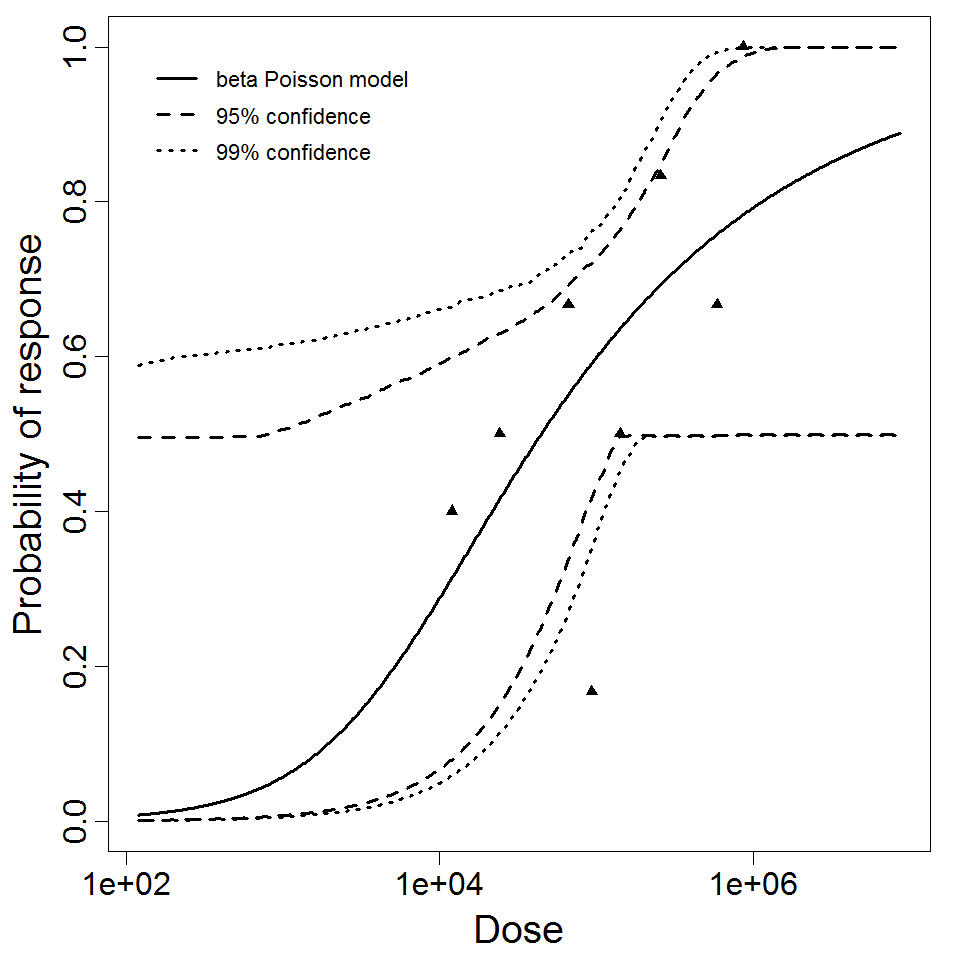
beta Poisson model plot, with confidence bounds around optimized model

# of Doses
8.00
Μodel
N50
4.44E+04
LD50/ID50
4.44E+04
Dose Units
Exposure Route
Contains Preferred Model
a
2.91E-01
Agent Strain
strain I
Experiment ID
232
Host type
Description
Model data for Shigella flexneri (2a, strain 2457T) in the human 
Dose Illness Not illness Total
180 9 27 36
5000 28 21 49
1E+04 52 36 88
1E+05 14 10 24


Goodness of fit and model selection
Model Deviance Δ Degrees 
of freedom
χ20.95,1 
p-value
χ20.95,m-k 
p-value
Exponential 154 153 3 3.84 
0
7.81 
0
Beta Poisson 1.69 2 5.99 
0.429
Beta-Poisson fits better than exponential; cannot reject good fit for beta-Poisson.


Optimized parameters for the beta-Poisson model, from 10000 bootstrap iterations
Parameter MLE estimate Percentiles
0.5% 2.5% 5% 95% 97.5% 99.5%
α 1.35E-01 9.86E-04 1.22E-02 6.85E-02 2.06E-01 2.22E-01 2.58E-01
N50 3.11E+03 5.09E+01 4.31E+02 9.64E+02 7.49E+03 9.14E+03 1.89E+04


Parameter scatter plot for beta Poisson model ellipses signify the 0.9, 0.95 and 0.99 confidence of the parameters
beta Poisson model plot, with confidence bounds around optimized model
# of Doses
4.00
Μodel
N50
3.11E+03
LD50/ID50
3.11E+03
Dose Units
Response
Exposure Route
Contains Preferred Model
a
1.35E-01
Agent Strain
2a (strain 2457T)
Experiment ID
223
Host type
Experiment Dataset