Guinea pig/ Josiah strain model data
| Dose |
Dead |
Survived |
Total |
| 5 |
1 |
7 |
8 |
| 48 |
1 |
7 |
8 |
| 724 |
3 |
5 |
8 |
| 5370 |
4 |
4 |
8 |
|
Goodness of fit and model selection
| Model |
Deviance |
Δ |
Degrees
of freedom |
χ20.95,1
p-value
|
χ20.95,m-k
p-value
|
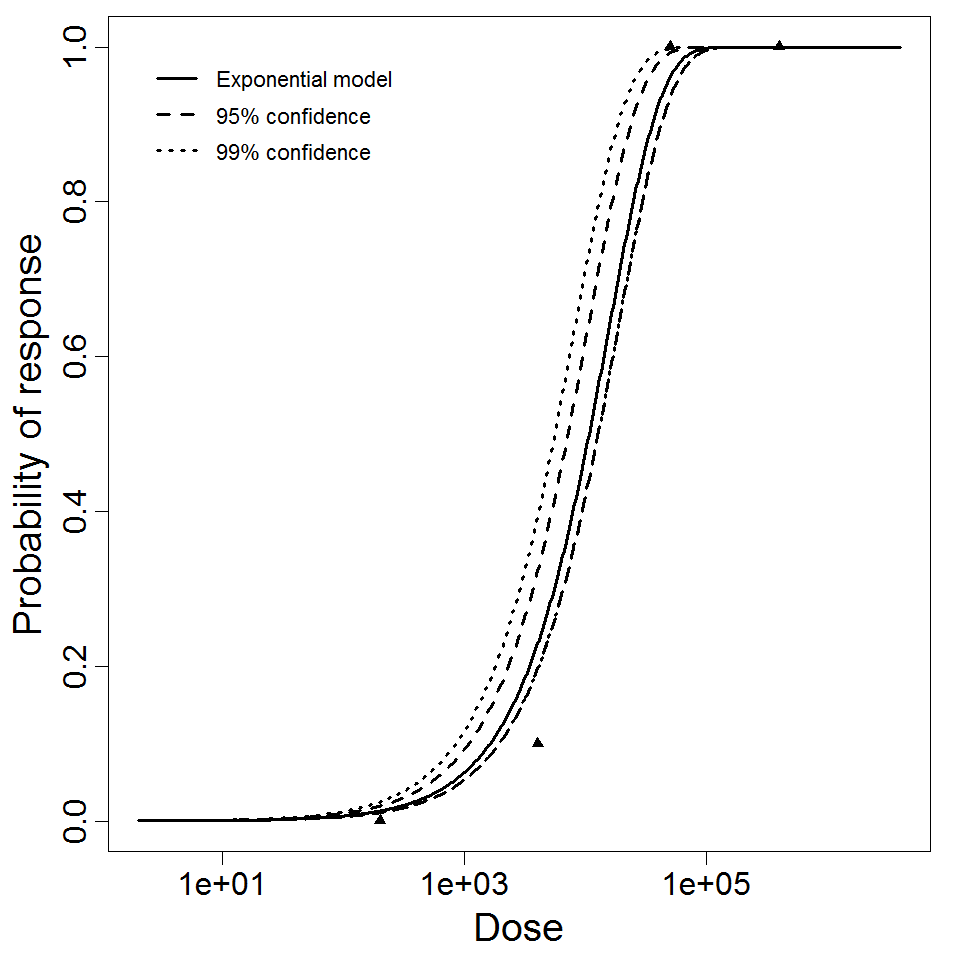
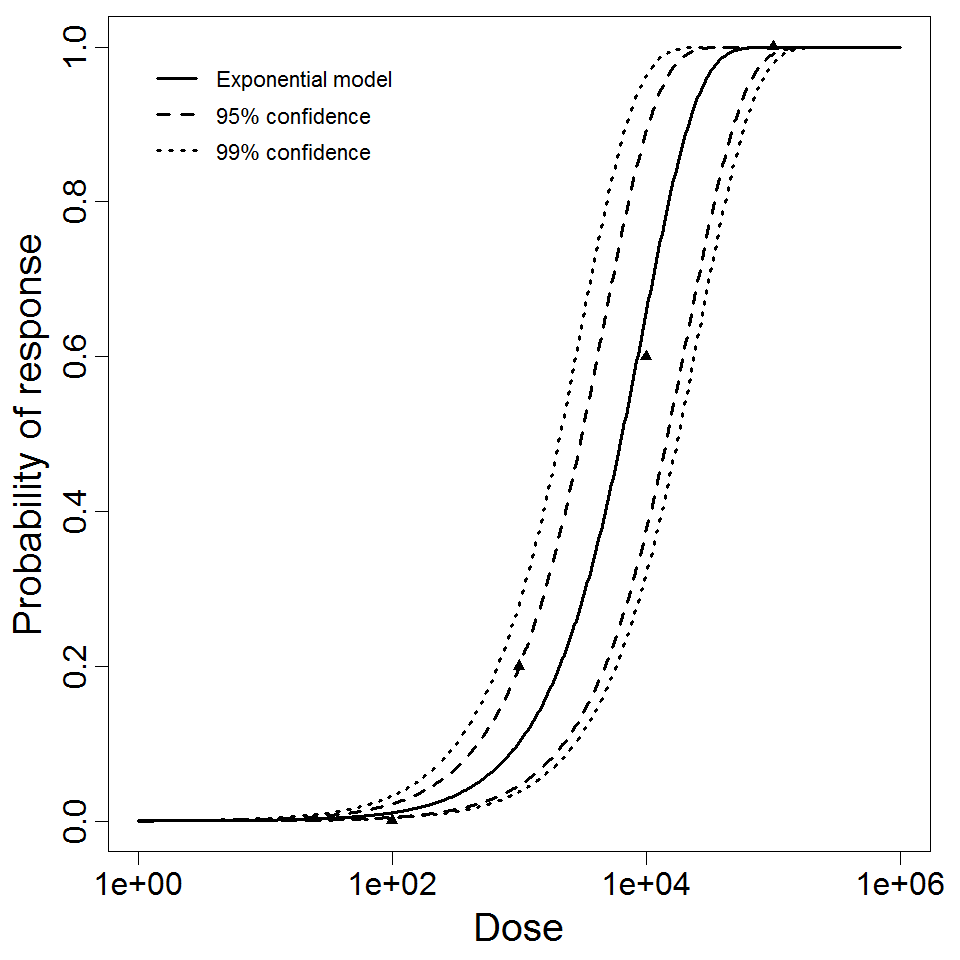
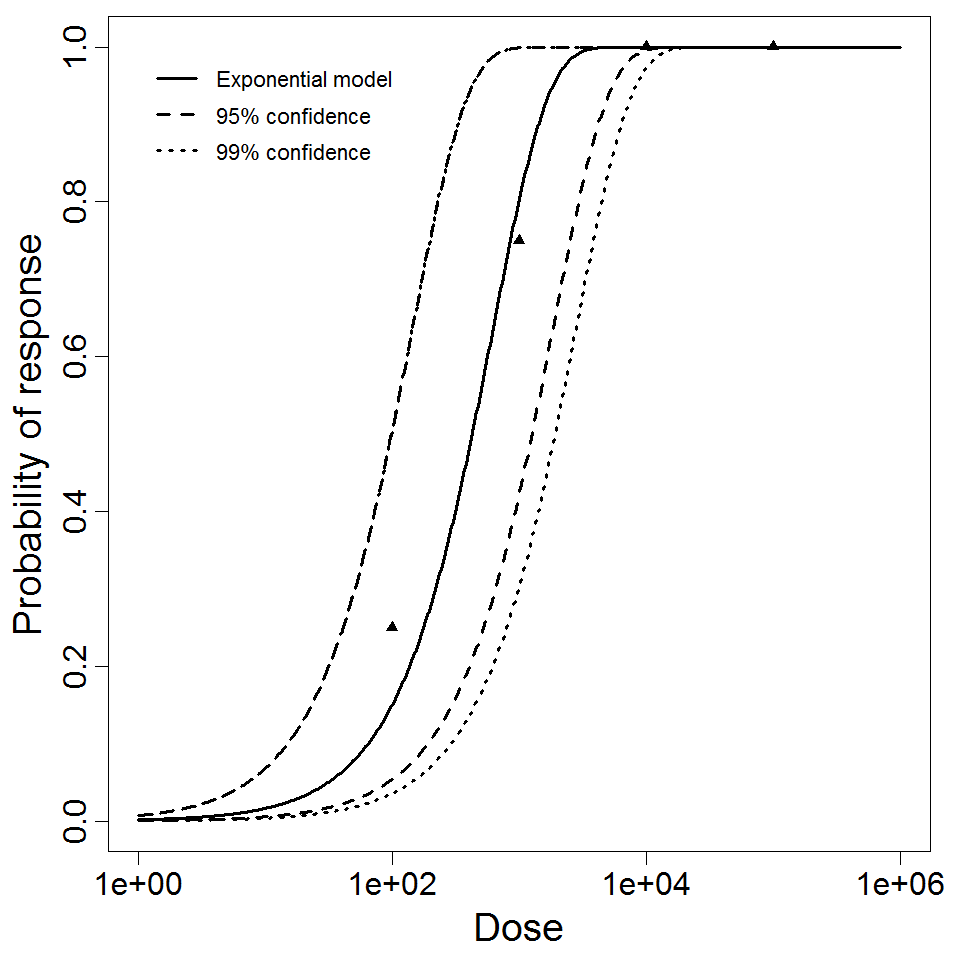
| Exponential |
14.4 |
13.8 |
3 |
3.84
0.000203
|
7.81
0.00237
|
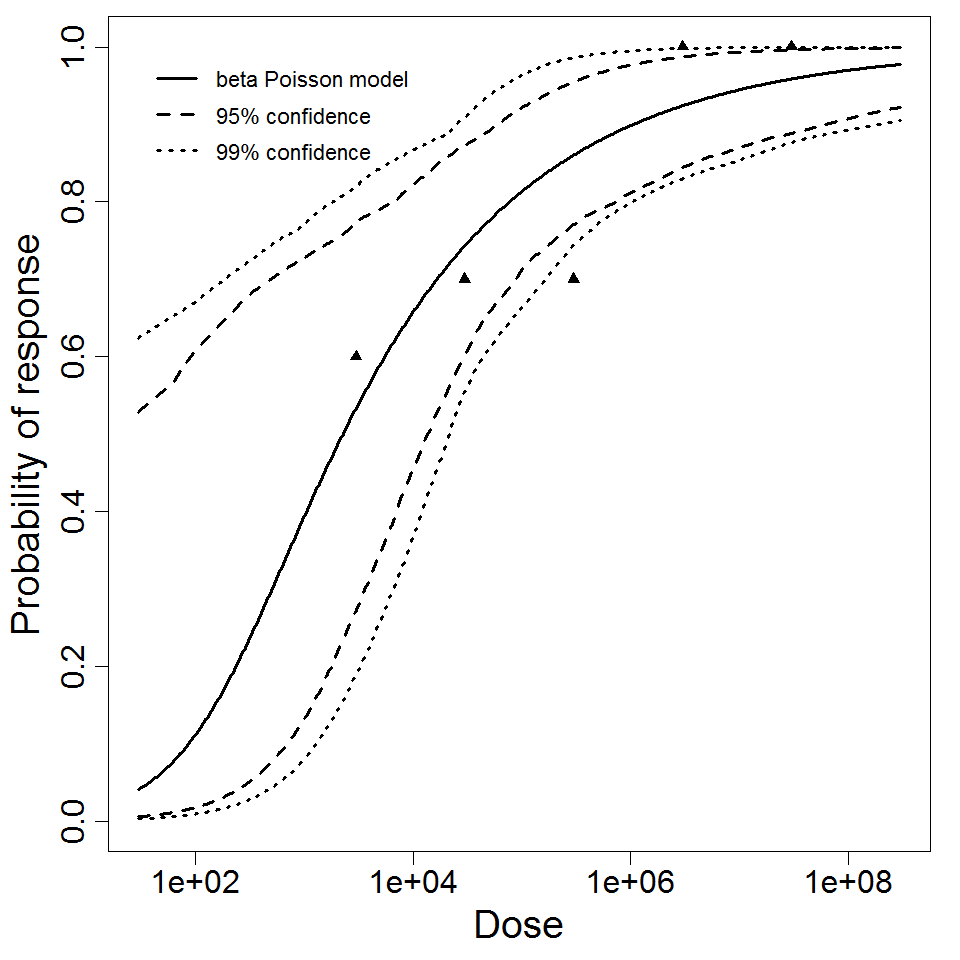
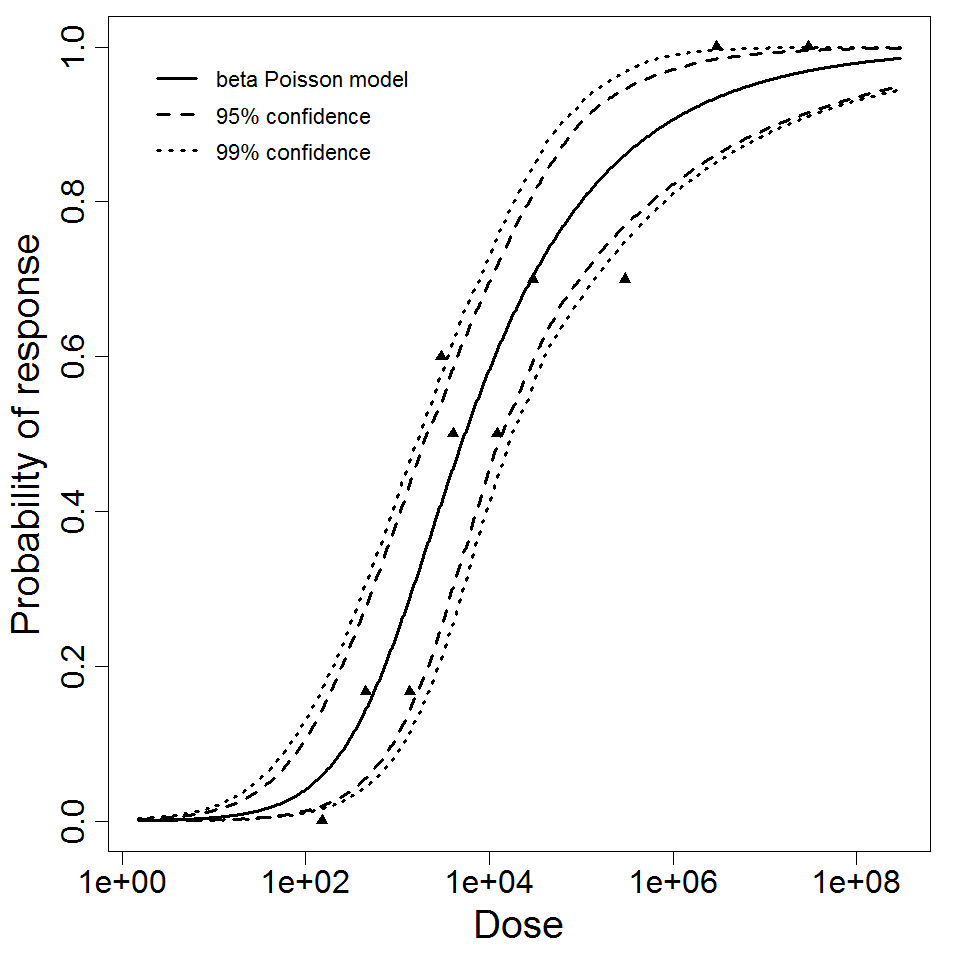
| Beta Poisson |
0.633 |
2 |
5.99
0.729
|
| Beta-Poisson fits better than exponential; cannot reject good fit for beta-Poisson. |
|
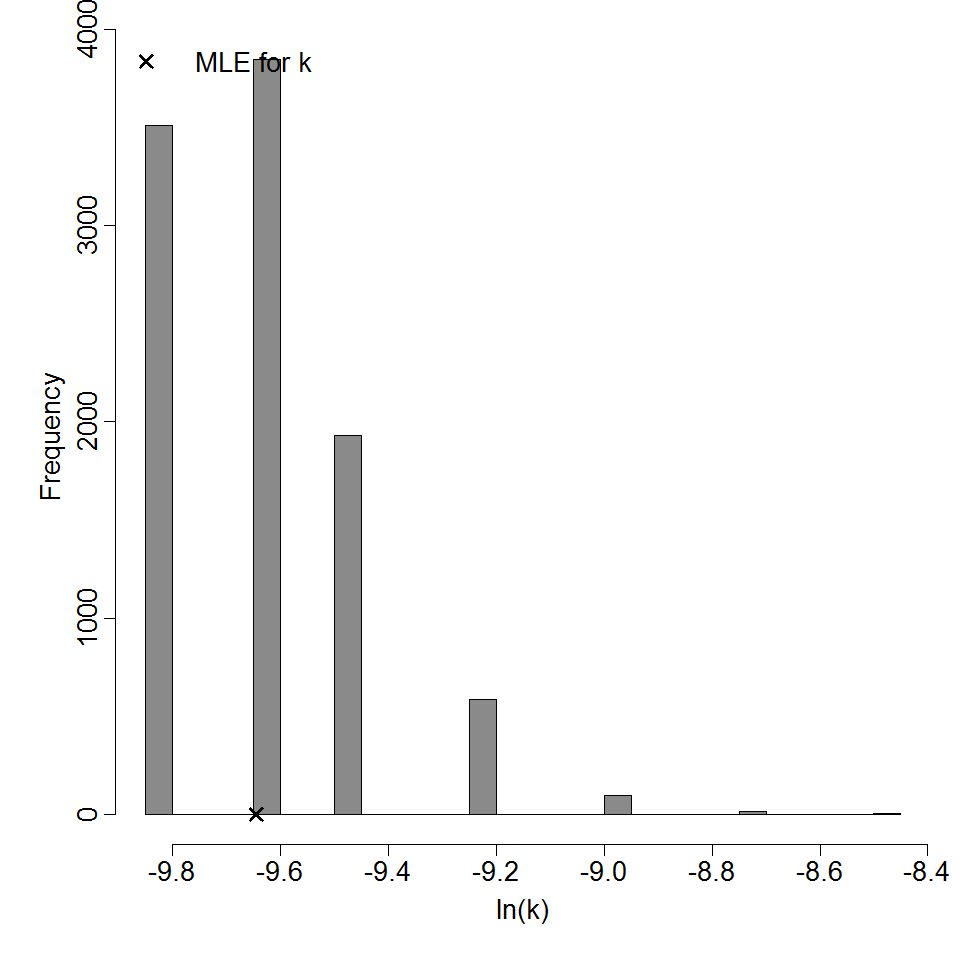
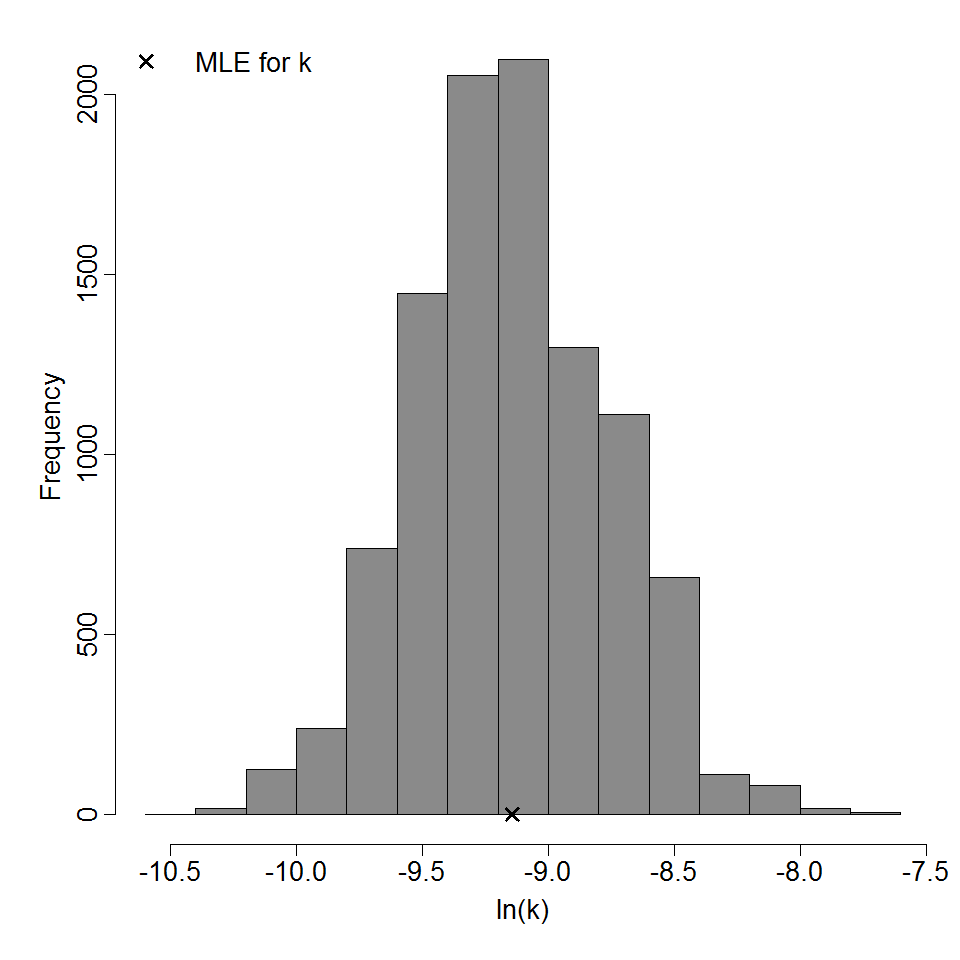
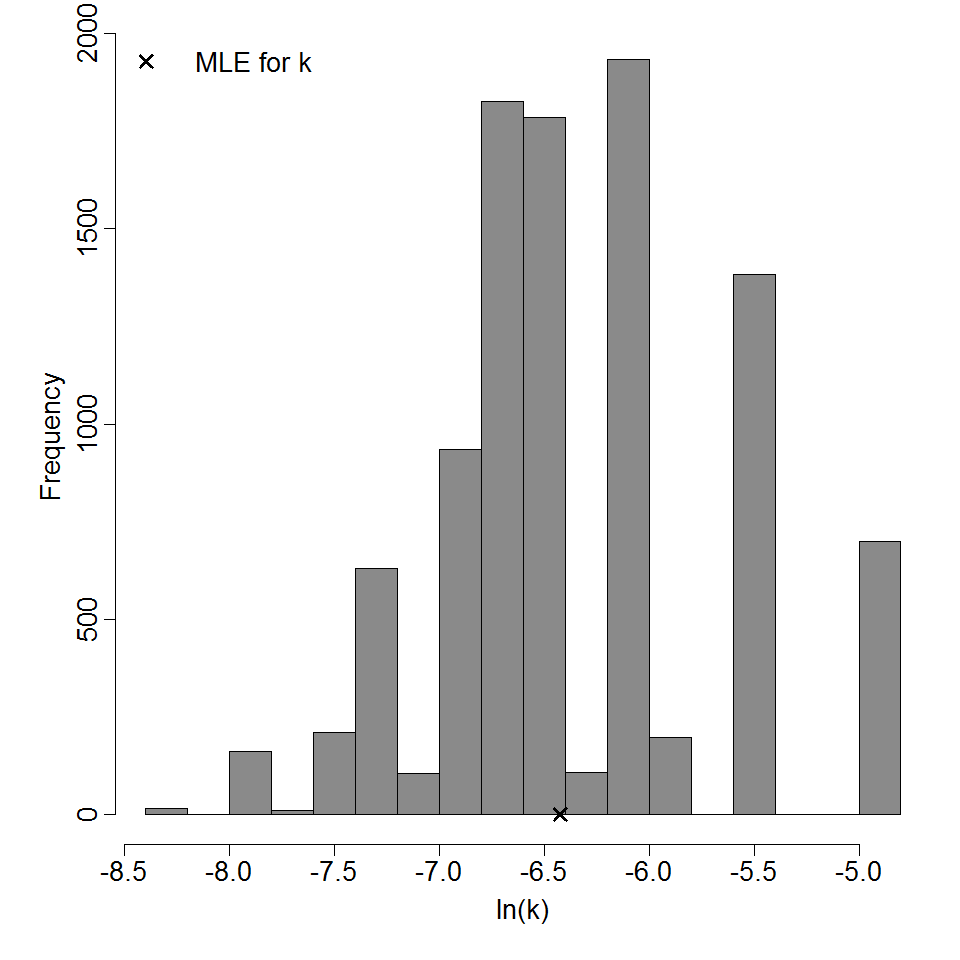
Optimized parameters for the beta-Poisson model, from 10000 bootstrap iterations
| Parameter |
MLE estimate |
Percentiles |
| 0.5% |
2.5% |
5% |
95% |
97.5% |
99.5% |
| α |
7.94E-02 |
9.77E-04 |
9.85E-04 |
9.87E-04 |
4.57E-01 |
1.19E+00 |
5.76E+02 |
| N50
|
1.43E+04 |
2.13E-01 |
9.22E-01 |
2.90E+00 |
1.82E+13 |
3.06E+17 |
2.25E+34 |
|

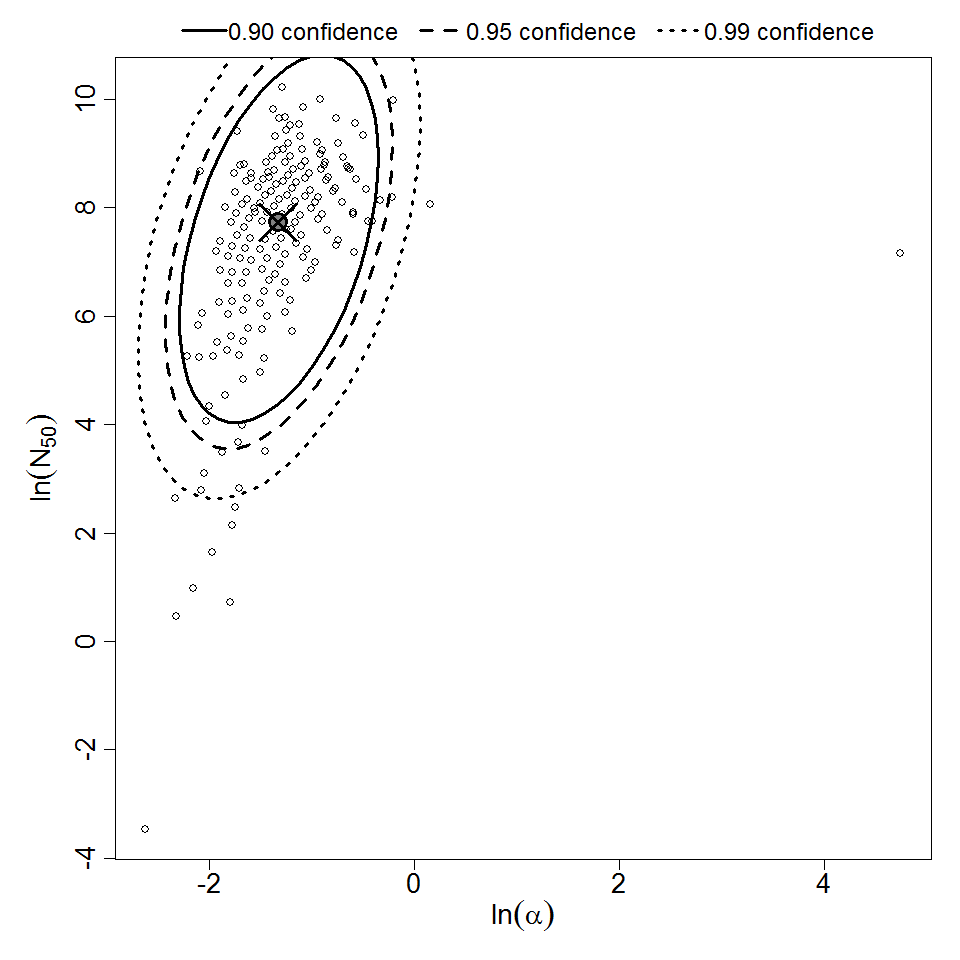
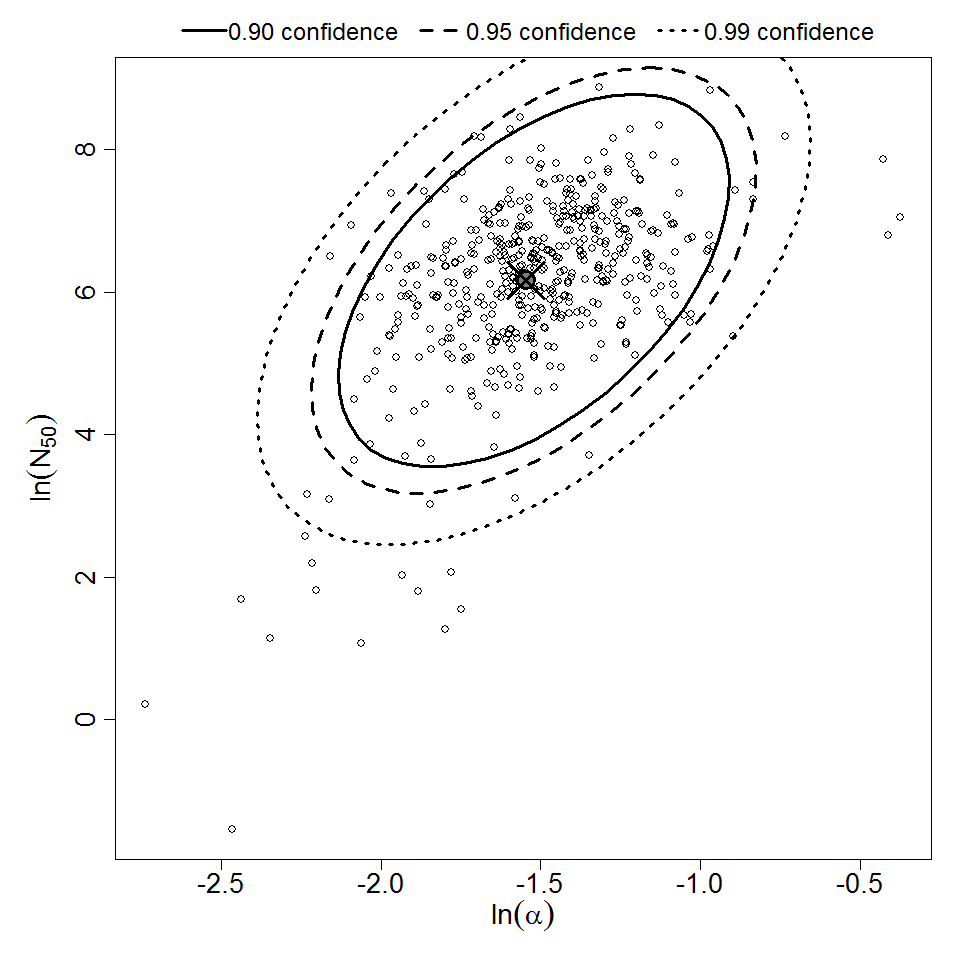
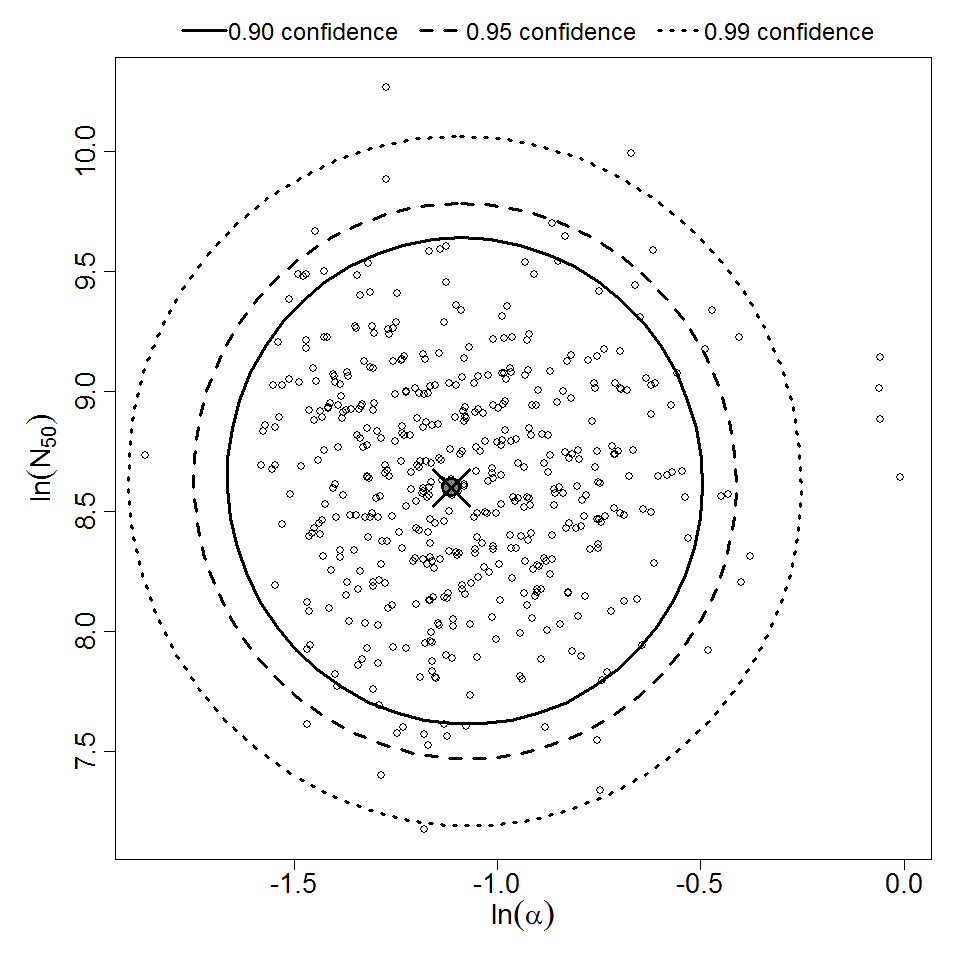
Parameter scatter plot for beta Poisson model ellipses signify the 0.9, 0.95 and 0.99 confidence of the parameters.

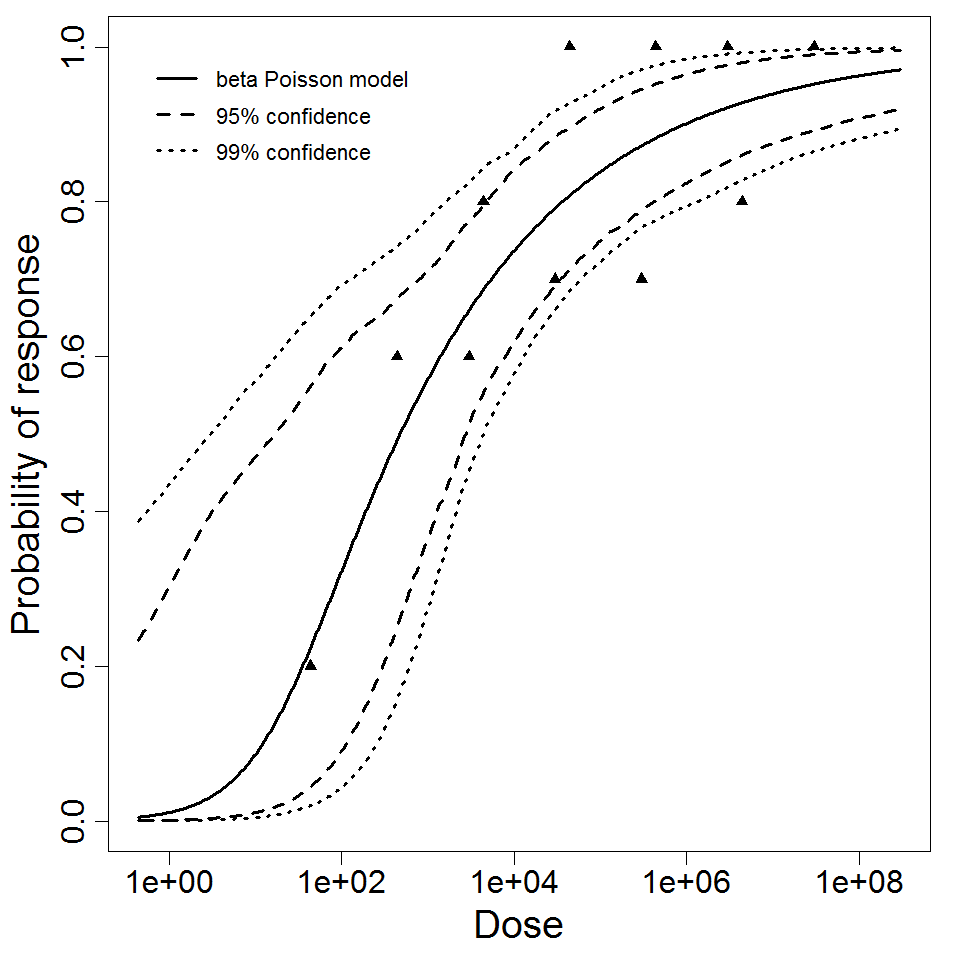
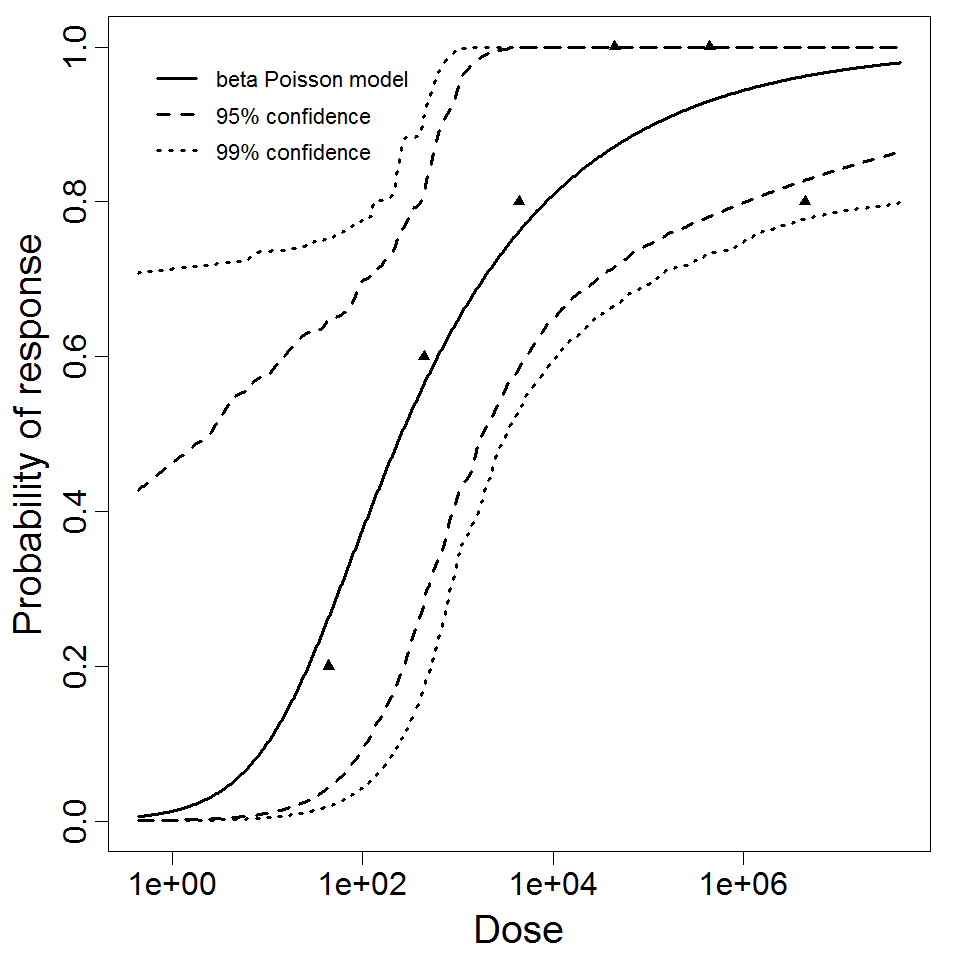
beta Poisson model plot, with confidence bounds around optimized model