Description
| ||||||||||||||||||||||
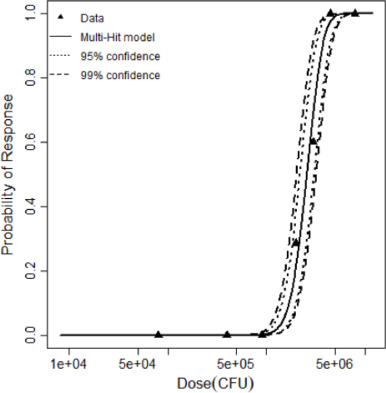
| Model | Deviance | Δ | DF | χ20.95,df | χ20.95,1 | Good fit? | Parameters | LD50 |
|---|---|---|---|---|---|---|---|---|
| Multi-hit | 1.09 | 15.69 | 5 | 11.1 | 3.84 | Yes | k = 4.12 × 10⁻⁶ kmin=11 | 2,588,047 |
# of Doses
7.00
Μodel
Dose Units
Response
Exposure Route
Contains Preferred Model
Status
fitted
k
3.22E-7
Agent Strain
PA01
Experiment ID
Ojielo2003
Host type
Experiment Dataset
| Dose (CFU) | Positive Response | Negative Response |
|---|---|---|
| 80000 | 0 | 10 |
| 400000 | 0 | 10 |
| 900000 | 0 | 10 |
| 2000000 | 2 | 5 |
| 3000000 | 6 | 4 |
| 4500000 | 10 | 0 |
| 8000000 | 10 | 0 |
Description
|
||||||||||||||||||||||
|
||||||||||||||||||||||||||||||||||||||

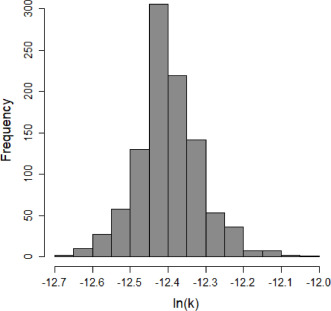
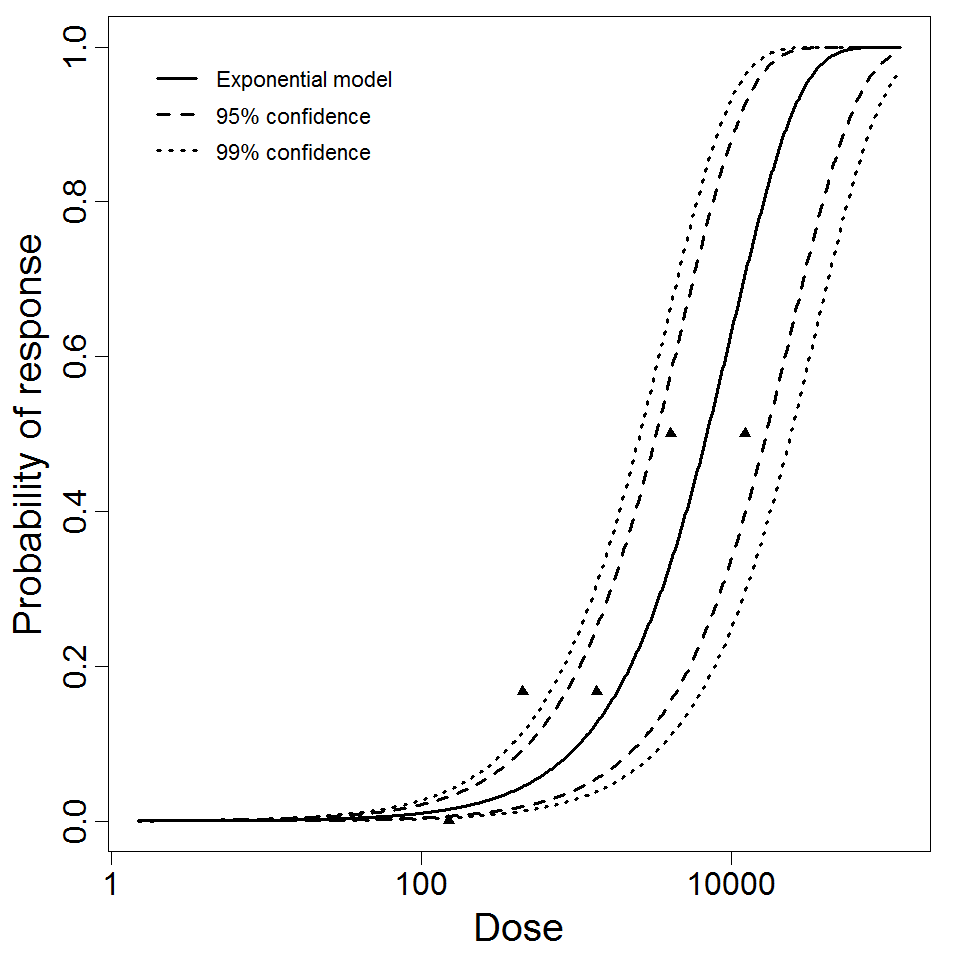
Parameter histogram for exponential model (uncertainty of the parameter)

Exponential model plot, with confidence bounds around optimized model
# of Doses
13.00
Μodel
LD50/ID50
1.22E+10
Dose Units
Response
Exposure Route
Contains Preferred Model
k
5.7E-11
Agent Strain
Nine mile phase I
Experiment ID
26
Host type
Description
|
|
||||||||||||||||||||||
|
||||||||||||||||||||||||||||||||||||||
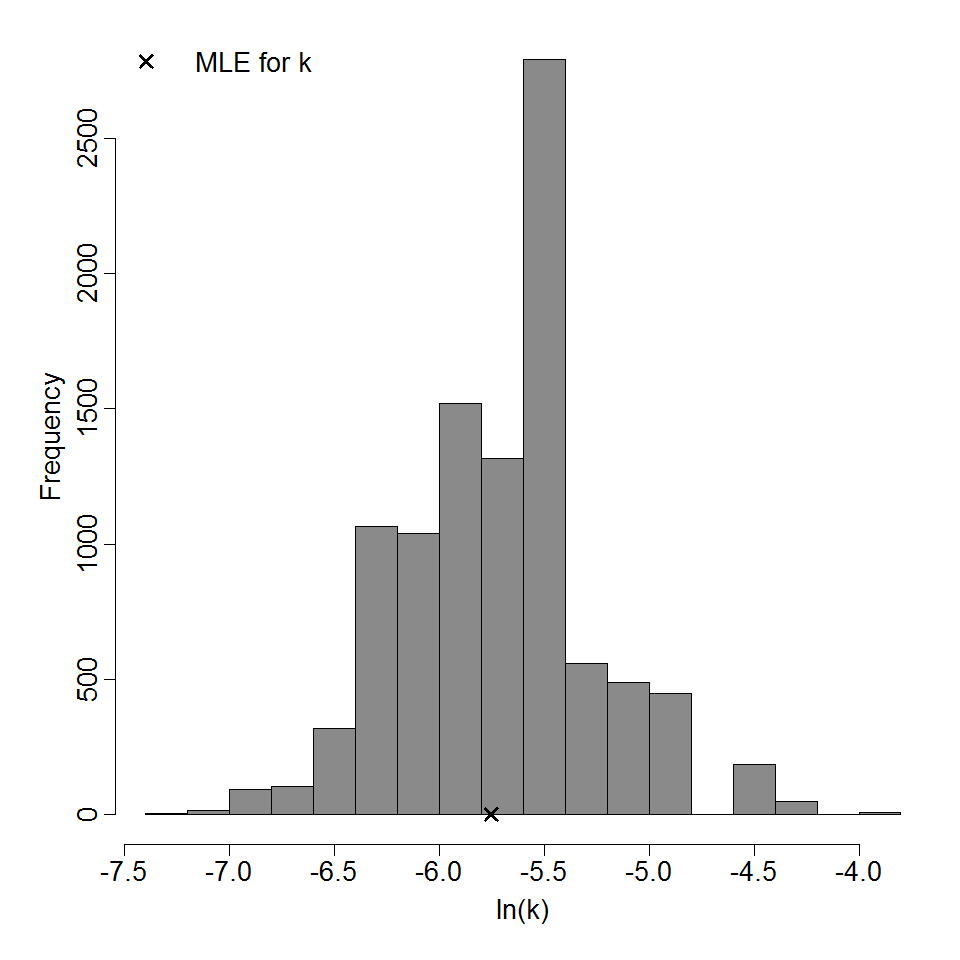
Parameter histogram for exponential model (uncertainty of the parameter)
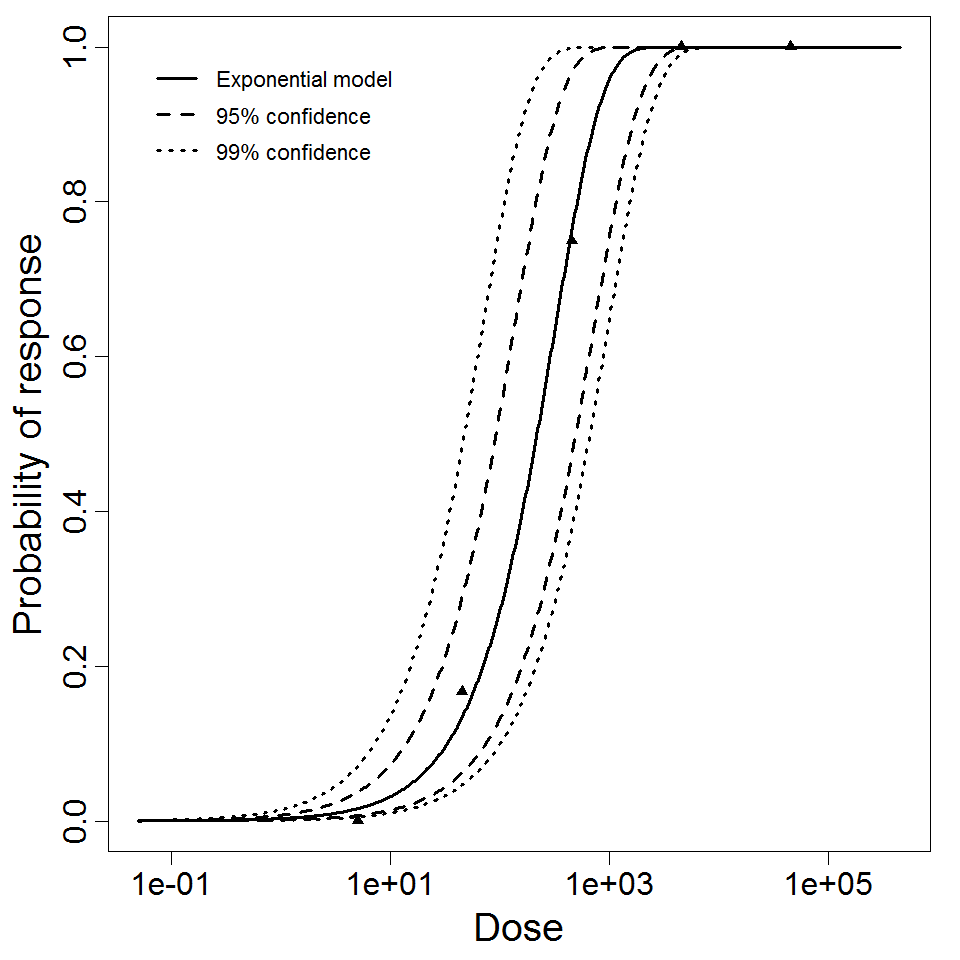
Exponential model plot, with confidence bounds around optimized model
# of Doses
5.00
Μodel
LD50/ID50
2.18E+02
Dose Units
Response
Exposure Route
Contains Preferred Model
k
3.18E-03
Agent Strain
KHW
Experiment ID
245
Host type
Description
|
| ||||||||||||||||||||||
| ||||||||||||||||||||||||||||||||||||||

# of Doses
5.00
Μodel
LD50/ID50
6.92E+03
Dose Units
Response
Exposure Route
Contains Preferred Model
k
1.00E-04
Agent Strain
KHW
Experiment ID
18
Host type
Experiment Dataset