Cryptosporidium hominis: Dose Response Experiments
| ID | Exposure Route | # of Doses | Agent Strain | Dose Units | Host type | Μodel | LD50/ID50 | Optimized parameters | Response type | Reference |
|---|---|---|---|---|---|---|---|---|---|---|
| 108 | oral | 8.00 | Iowa strain | oocysts | human | exponential | 1.65E+02 | k = 4.19E-03 | infection |
DuPont, H. L., Chappell, C. L., Sterling, C. R., Okhuysen, P. C., Rose, J. B., & Jakubowski, W. . (1995). The infectivity of Cryptosporidium parvum in healthy volunteers. The New England Journal of Medicine, 332, 13. Retrieved from https://www.nejm.org/doi/full/10.1056/NEJM199503303321304 |
| 139 | oral | 8.00 | Iowa isolate | oocysts | human | exponential | 1.32E+02 | k = 5.26E-03 | infection |
Messner, M. J., Chappell, C. L., & Okhuysen, P. C. (2001). Risk Assessment for Cryptosporidium: A Hierarchical Bayesian Analysis of Human Dose Response Data. Water Research, 35, 16. Retrieved from https://www.sciencedirect.com/science/article/pii/S0043135401001191 |
| 140 | oral | 4.00 | TAMU isolate | oocysts | human | exponential | 1.21E+01 | k = 5.72E-02 | infection |
Messner, M. J., Chappell, C. L., & Okhuysen, P. C. (2001). Risk Assessment for Cryptosporidium: A Hierarchical Bayesian Analysis of Human Dose Response Data. Water Research, 35, 16. Retrieved from https://www.sciencedirect.com/science/article/pii/S0043135401001191 |
| 141 | oral | 4.00 | UCP isolate | oocysts | human | beta-Poisson | 1.79E+02 | a = 1.45E-01 N50 = 1.79E+02 | infection |
Coster, T. S., Wolf, M. K., Hall, E. R., Cassels, F. J., Taylor, D. N., Liu, C. T., … McQueen, C. E. (2007). Immune response, ciprofloxacin activity, and gender differences after human experimental challenge by two strains of enterotoxigenic Escherichia coli. Infection and Immunity, 75, 1. |
| 181 | oral | 4.00 | *C. hominis*, TU502 | oocysts | human | beta-Poisson | 1.68E+01 | a = 2.7E-01 N50 = 1.68E+01 | diarrhea |
Okhuysen, P. C., Rich, S. M., Chappell, C. L., Grimes, K. A., Widmer, G. ., Feng, X. ., & Tzipori, S. . (2002). Infectivity of a Cryptosporidium parvum Isolate of Cervine Origin for Healthy Adults and Interferon-γ Knockout Mice. Journal of Infectious Diseases, 185, 9. Retrieved from https://academic.oup.com/jid/article/185/9/1320/937719 |
| 183 | oral | 4.00 | Moredun isolate | oocysts | human | beta-Poisson | 4.55E+02 | a = 1.14E-01 N50 = 4.55E+02 | infection |
Blaser, M. J., Duncan, D. J., Warren, G. H., & W-ll, W. . (1983). Experimental Campylobacter jejuni Infection of Adult Mice. Infection and Immunity, 39, 2. |
|
| ||||||||||||||||||||||
| ||||||||||||||||||||||||||||||||||||||

|
|
||||||||||||||||||||||
|
||||||||||||||||||||||||||||||||||||||

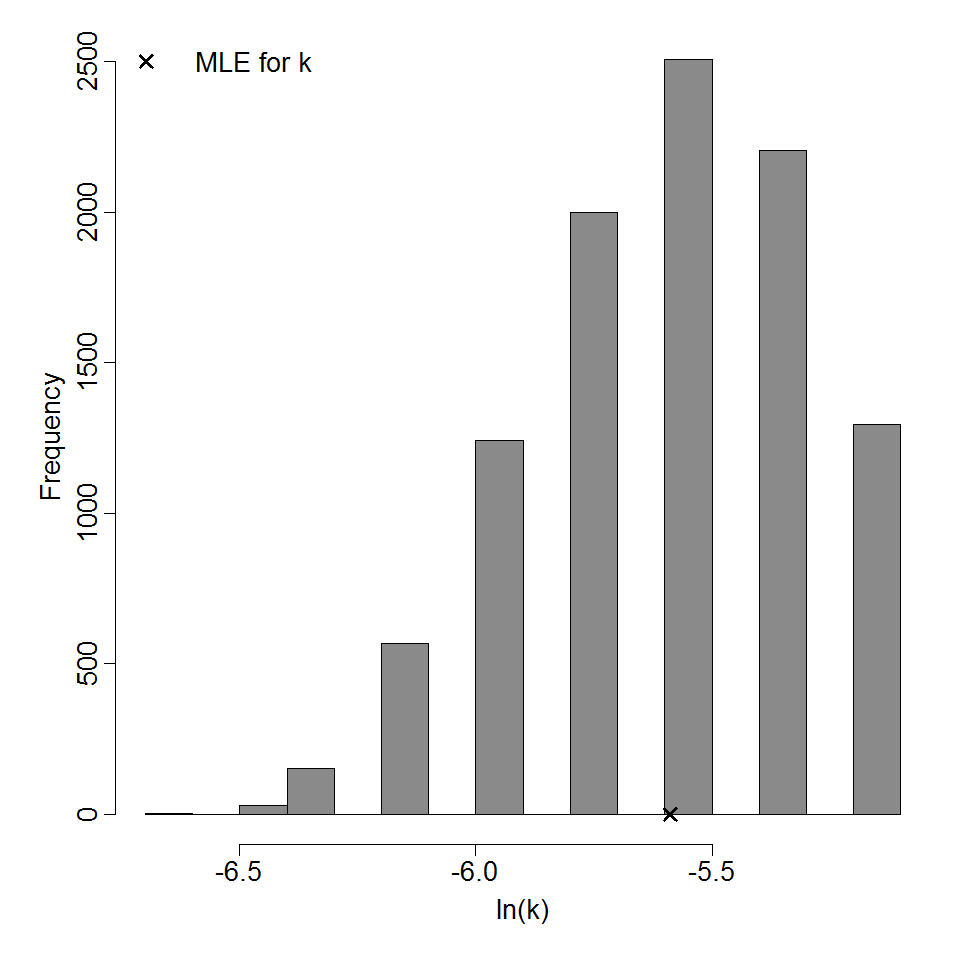
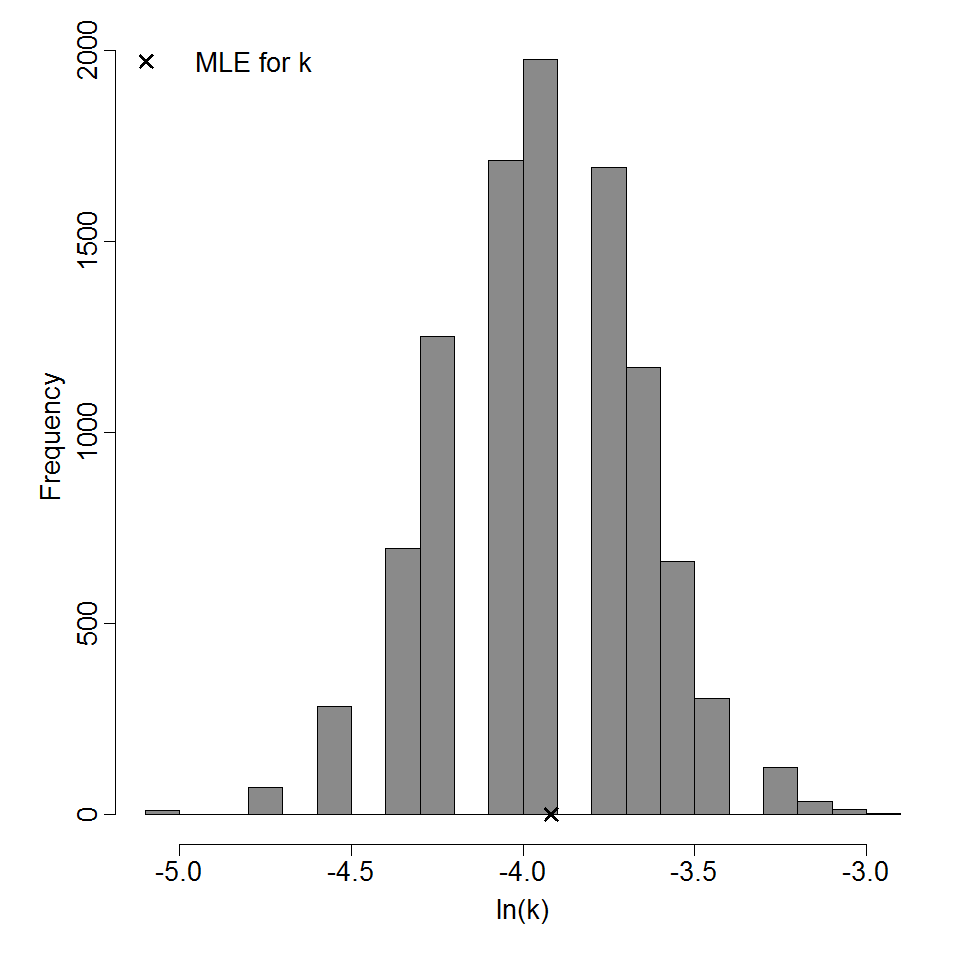
Parameter histogram for exponential model (uncertainty of the parameter)

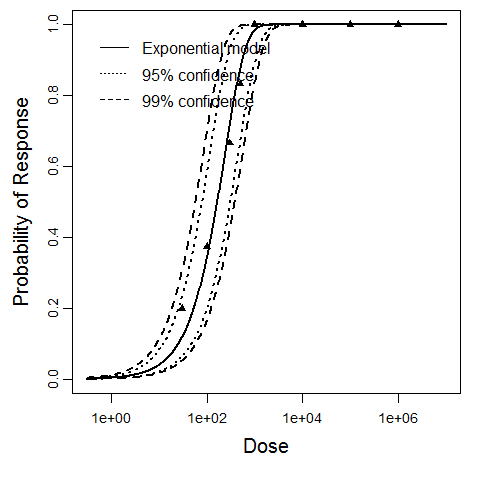
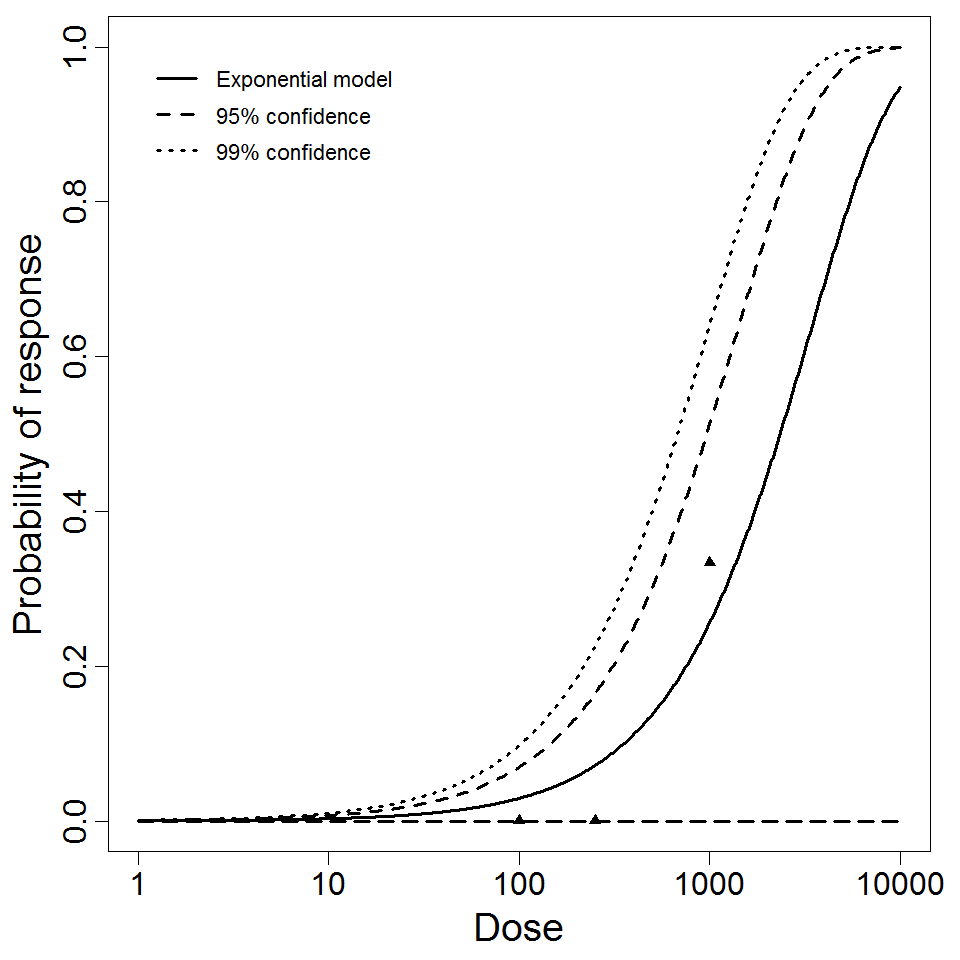
Exponential model plot, with confidence bounds around optimized model
|
|
||||||||||||||||||||||
|
||||||||||||||||||||||||||||||||||||||

Exponential model plot, with confidence bounds around optimized model

Parameter histogram for exponential model (uncertainty of the parameter)
|
|
||||||||||||||||||||||
|
||||||||||||||||||||||||||||||

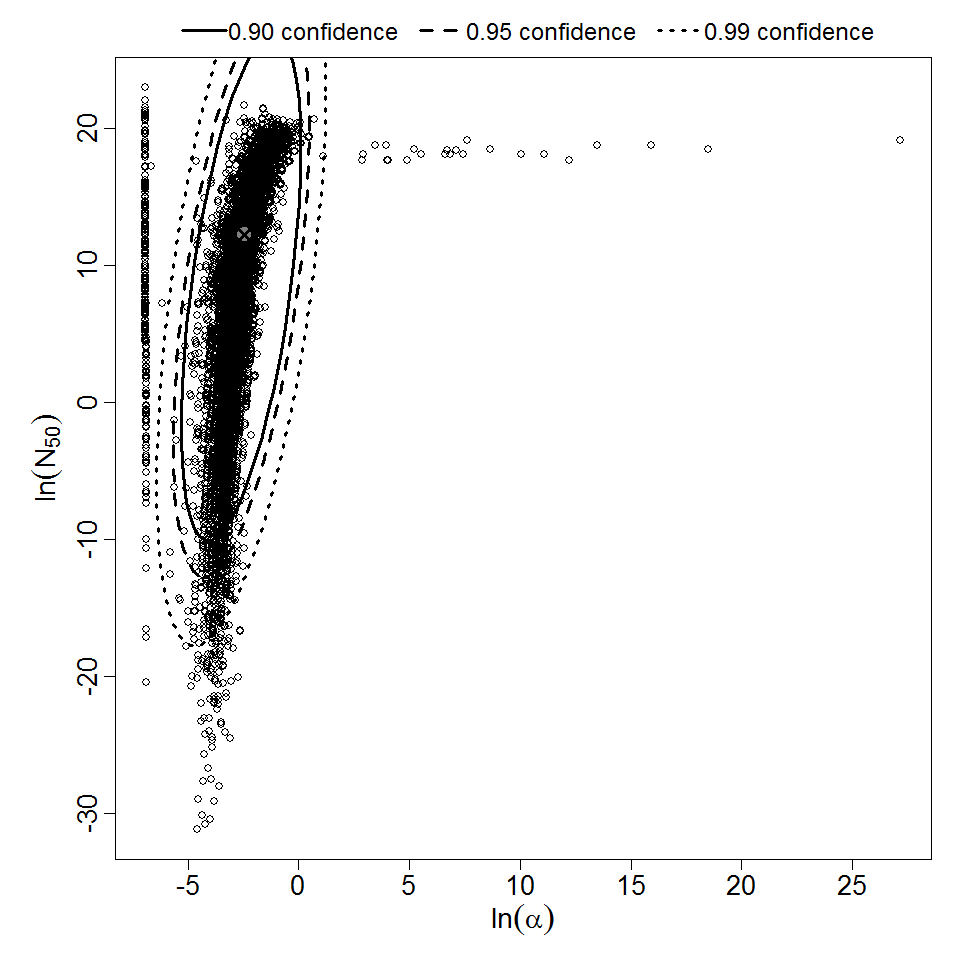
Parameter scatter plot for beta Poisson model ellipses signify the 0.9, 0.95 and 0.99 confidence of the parameters.

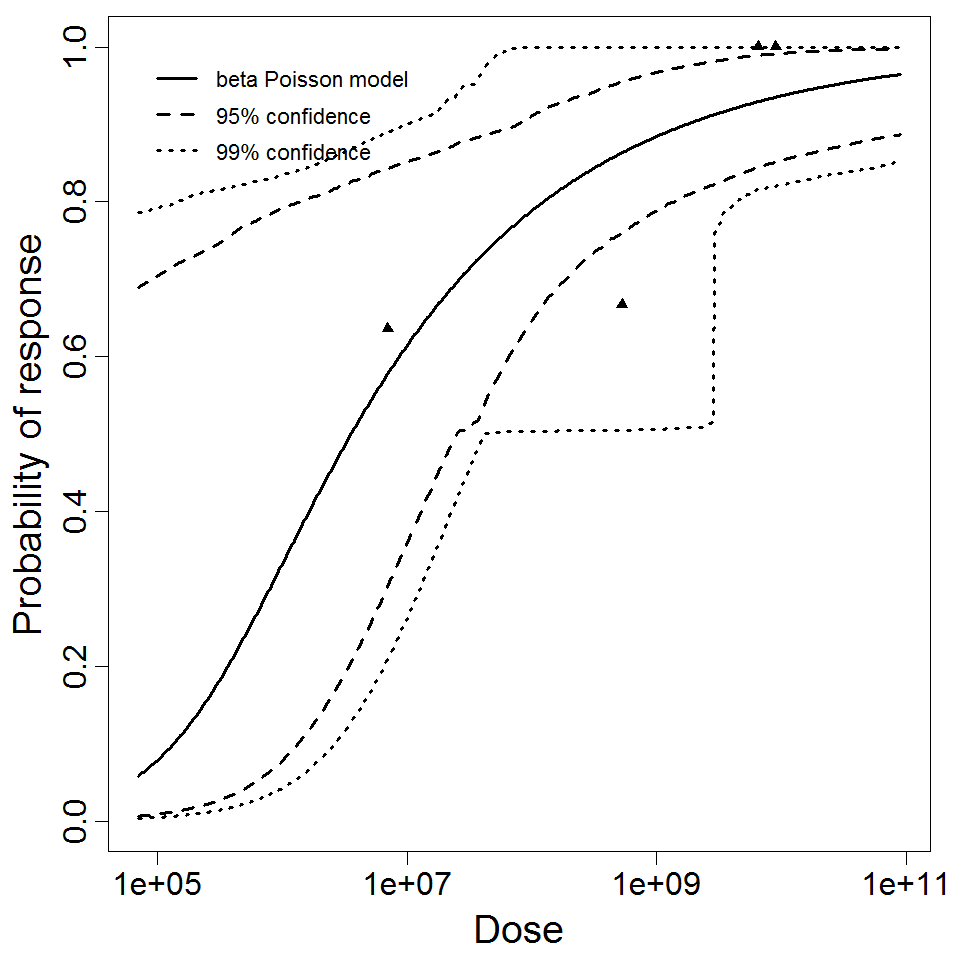
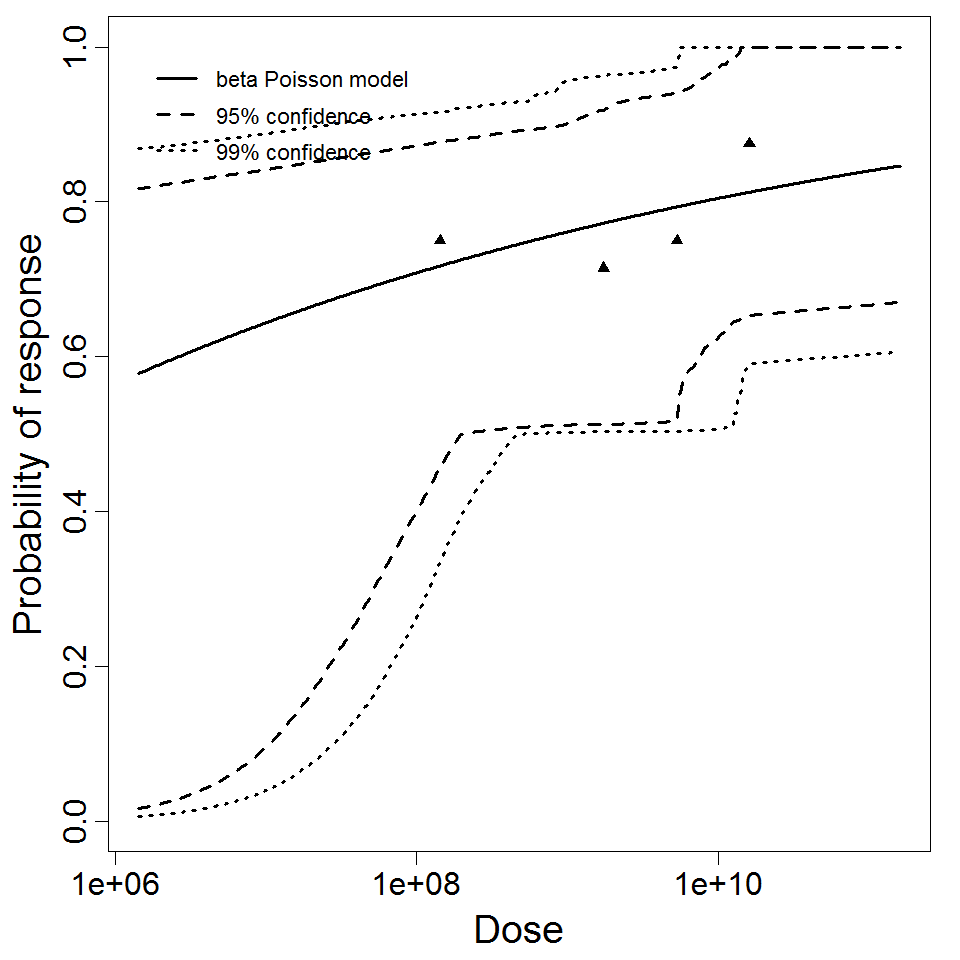
beta Poisson model plot, with confidence bounds around optimized model
|
|
||||||||||||||||||||||
|
||||||||||||||||||||||||||||||

Parameter scatter plot for beta Poisson model ellipses signify the 0.9, 0.95 and 0.99 confidence of the parameters.

beta Poisson model plot, with confidence bounds around optimized model.
|
|
||||||||||||||||||||||
|
||||||||||||||||||||||||||||||
Parameter scatter plot for beta Poisson model ellipses signify the 0.9, 0.95 and 0.99 confidence of the parameters.
beta Poisson model plot, with confidence bounds around optimized model.
|
|
||||||||||||||||||||||
|
||||||||||||||||||||||||||||||||||||||
Parameter histogram for exponential model (uncertainty of the parameter)
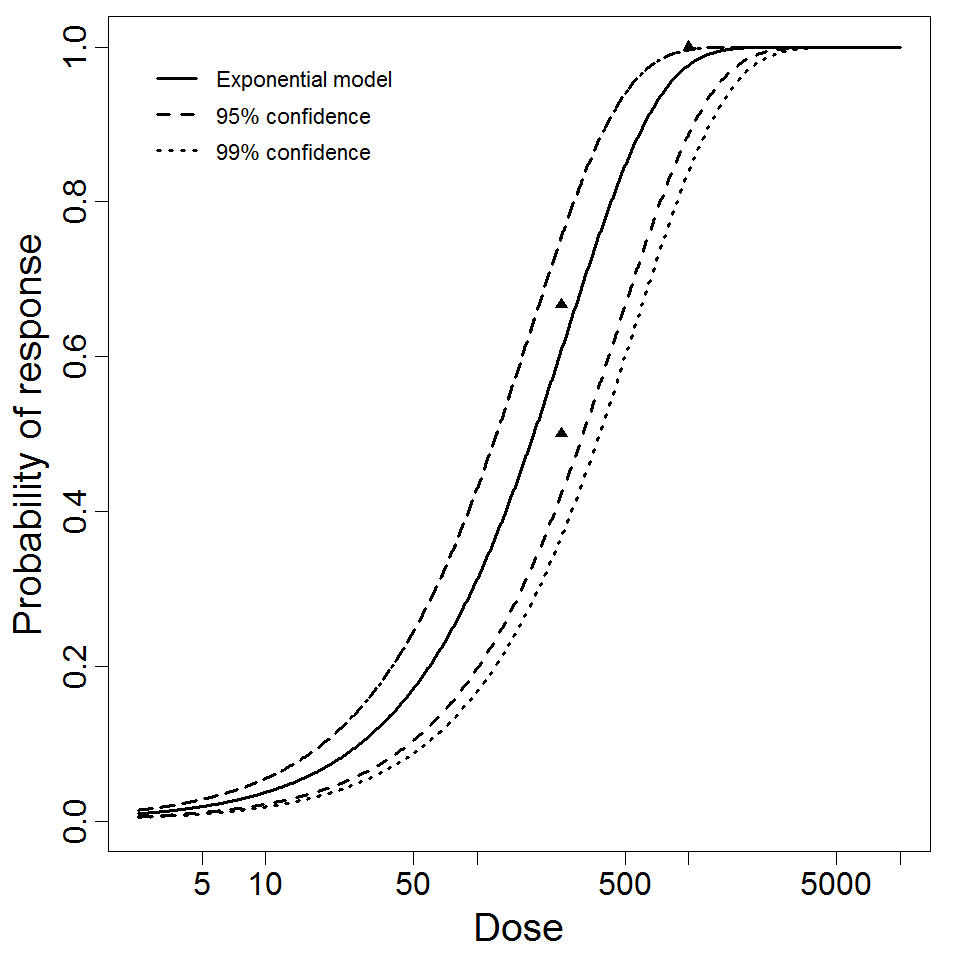
Exponential model plot, with confidence bounds around optimized model
|
|
||||||||||||||||||||||
|
||||||||||||||||||||||||||||||||||||||
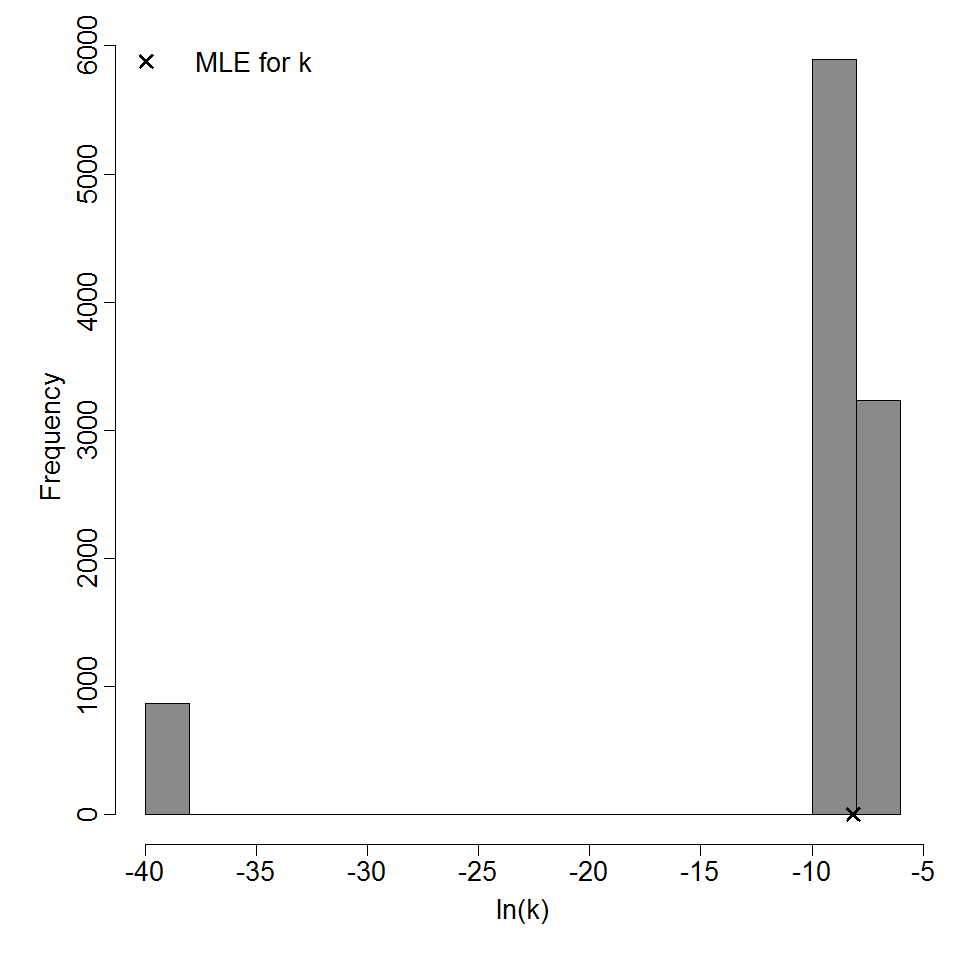
Parameter histogram for exponential model (uncertainty of the parameter)
Exponential model plot, with confidence bounds around optimized model
|
|
||||||||||||||||||||||
|
||||||||||||||||||||||||||||||

Parameter scatter plot for beta Poisson model ellipses signify the 0.9, 0.95 and 0.99 confidence of the parameters.

beta Poisson model plot, with confidence bounds around optimized model
|
|
||||||||||||||||||||||
|
||||||||||||||||||||||||||||||||||||||
Parameter histogram for exponential model (uncertainty of the parameter)

Exponential model plot, with confidence bounds around optimized model
|
|
||||||||||||||||||||||
|
||||||||||||||||||||||||||||||

Parameter scatter plot for beta Poisson model ellipses signify the 0.9, 0.95 and 0.99 confidence of the parameters.

beta Poisson model plot, with confidence bounds around optimized model.
| ||||||||||||||||||||||
| ||||||||||||||||||||||||||||||

|
| ||||||||||||||||||||||
| ||||||||||||||||||||||||||||||
|
|
||||||||||||||||||||||
|
||||||||||||||||||||||||||||||||||||||

Parameter histogram for exponential model (uncertainty of the parameter)

Exponential model plot, with confidence bounds around optimized model
|
|
||||||||||||||||||||||
|
||||||||||||||||||||||||||||||
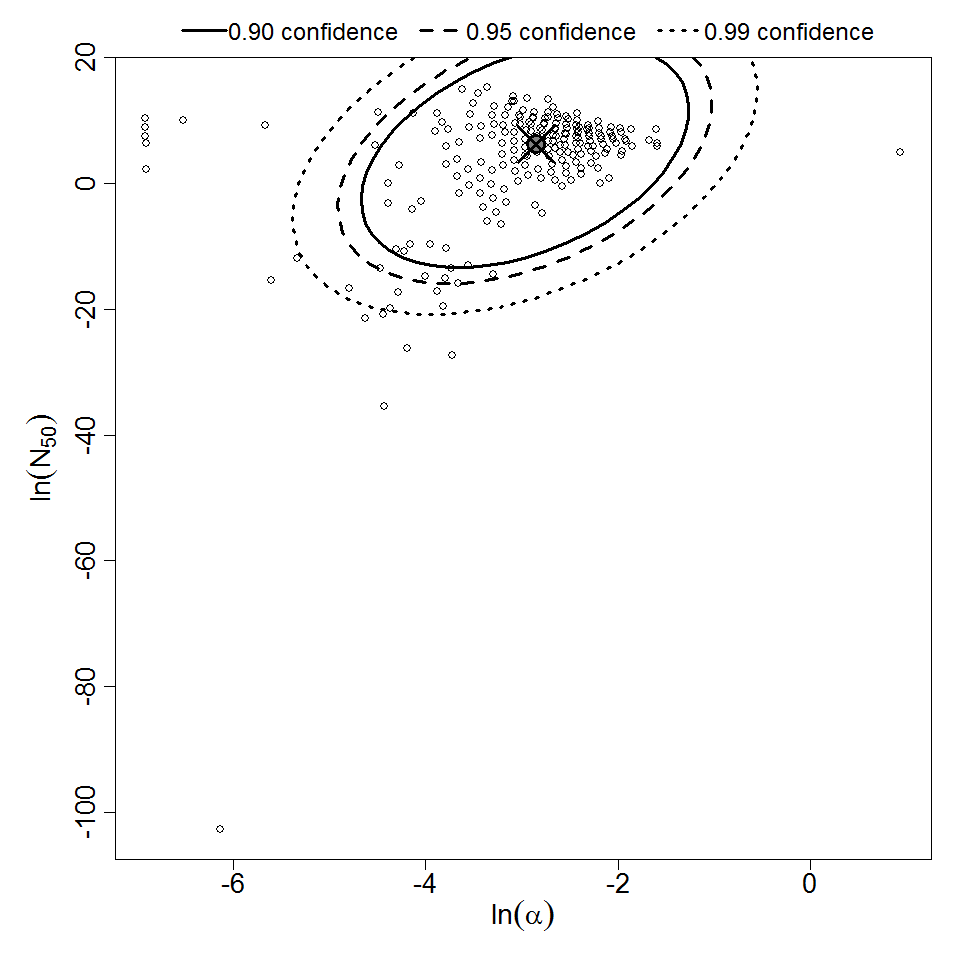
Parameter scatter plot for beta Poisson model ellipses signify the 0.9, 0.95 and 0.99 confidence of the parameters

beta Poisson model plot, with confidence bounds around optimized model