\[P(response)=1-exp(-k\times dose)\]
Description
|
| ||||||||||||||||||||||
| ||||||||||||||||||||||||||||||||||||||

# of Doses
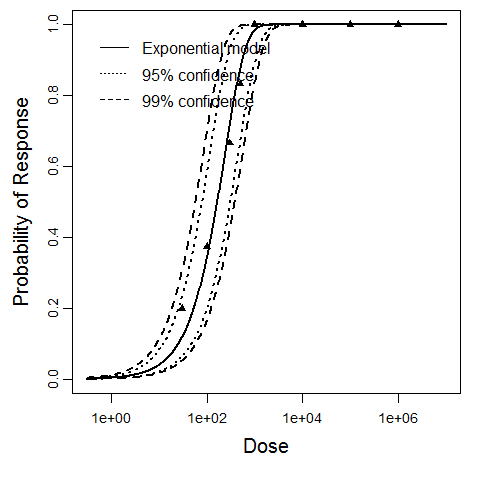
8.00
Μodel
LD50/ID50
1.65E+02
Dose Units
Response
Exposure Route
Contains Preferred Model
k
4.19E-03
Agent Strain
Iowa strain
Experiment ID
108
Host type
Experiment Dataset
Description
|
| ||||||||||||||||||||||
| ||||||||||||||||||||||||||||||||||||||
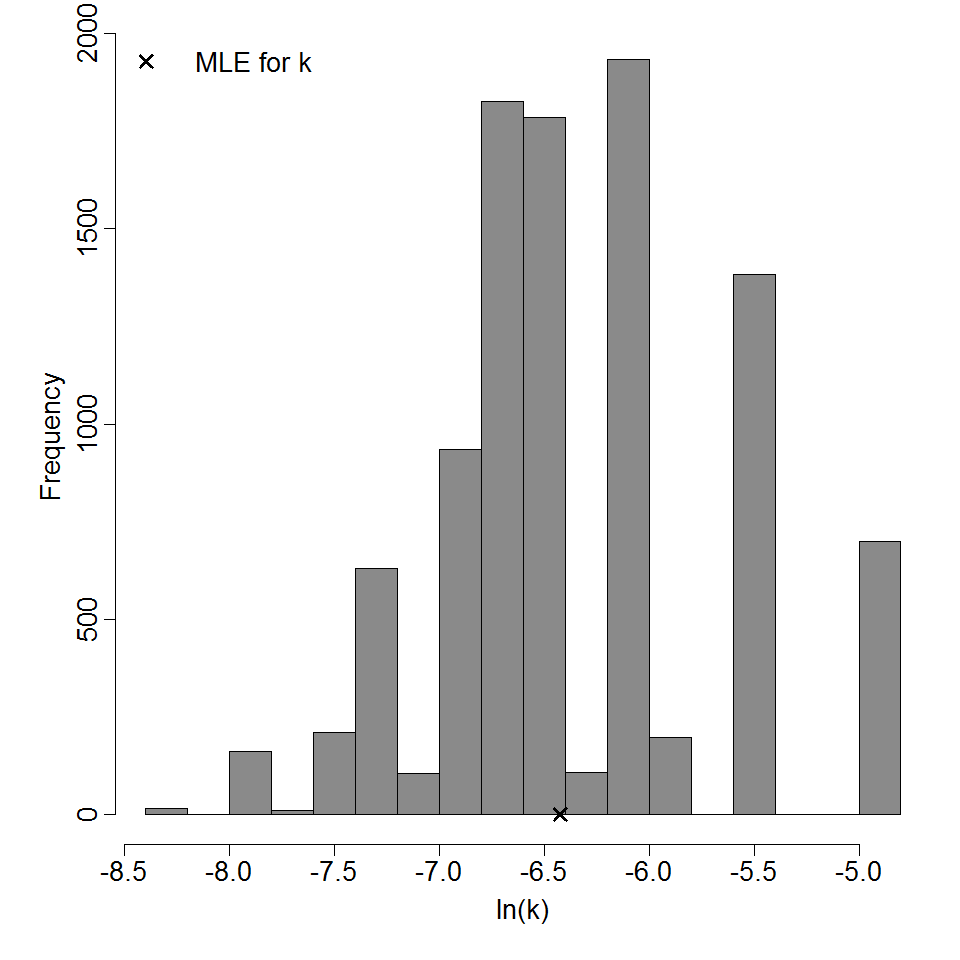
Parameter histogram for exponential model (uncertainty of the parameter)
Exponential model plot, with confidence bounds around optimized model
# of Doses
4.00
Μodel
LD50/ID50
4.26E+02
Dose Units
Response
Exposure Route
Contains Preferred Model
k
1.63E-03
Agent Strain
CO92
Experiment ID
1
Host type
Experiment Dataset
| Dose | Dead | Survived | Total |
|---|---|---|---|
| 100 | 1 | 3 | 4 |
| 1000 | 3 | 1 | 4 |
| 1E+04 | 4 | 0 | 4 |
| 1E+05 | 4 | 0 | 4 |