\[P(response)=1-exp(-k\times dose)\]
Description
|
|
||||||||||||||||||||||
|
||||||||||||||||||||||||||||||||||||||
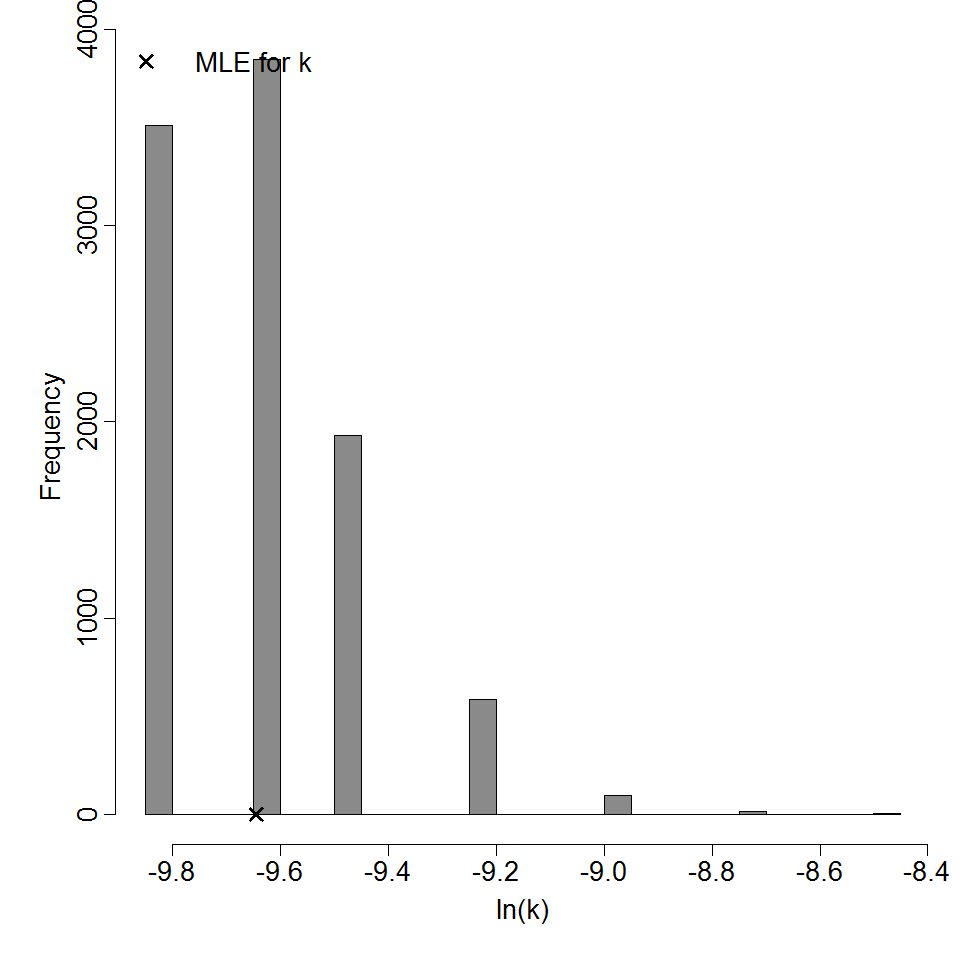
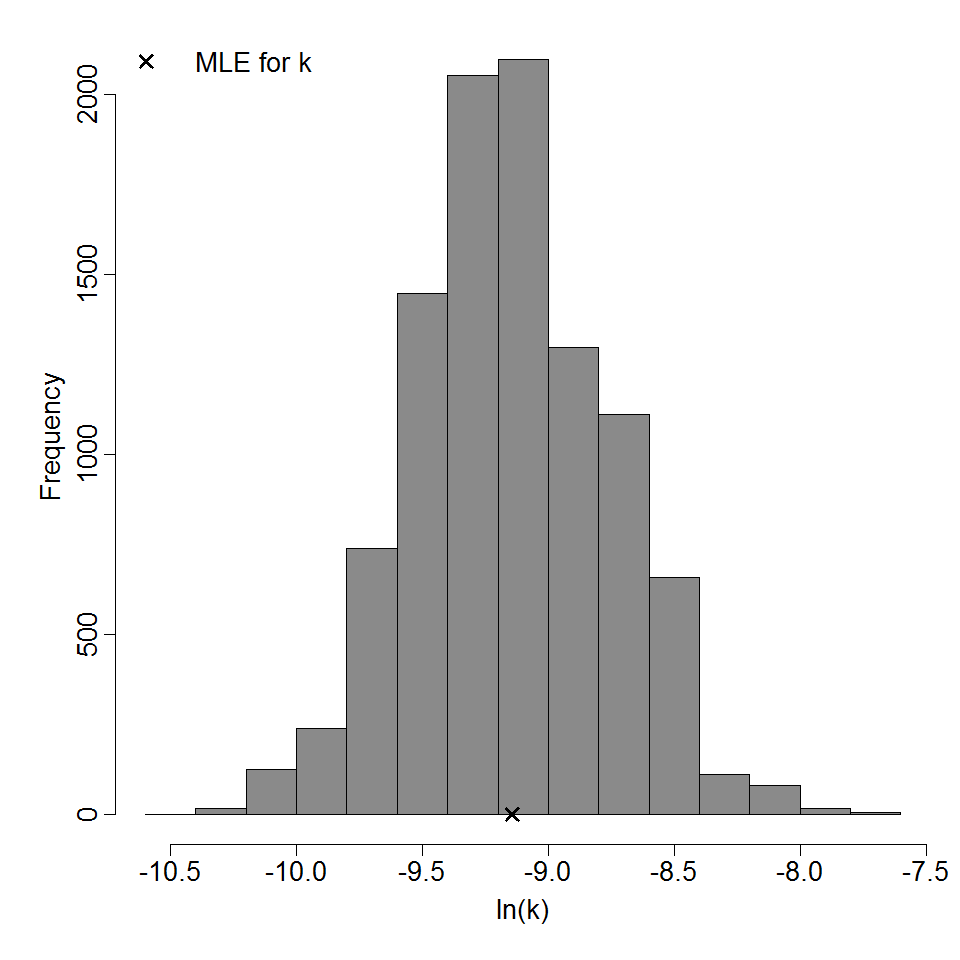
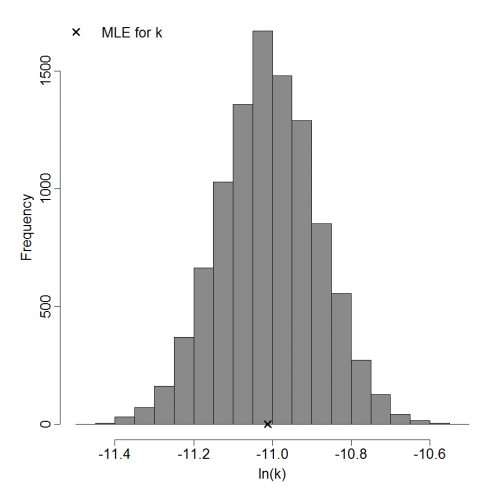
Parameter histogram for exponential model (uncertainty of the parameter)
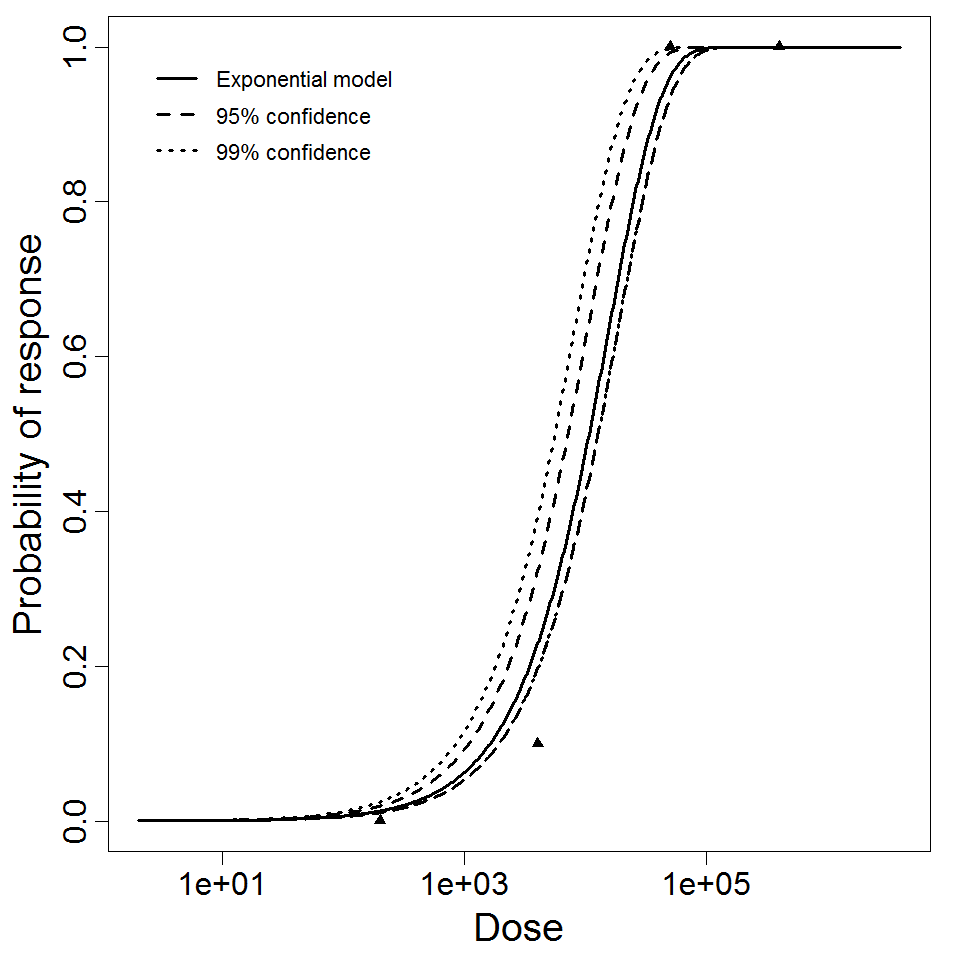
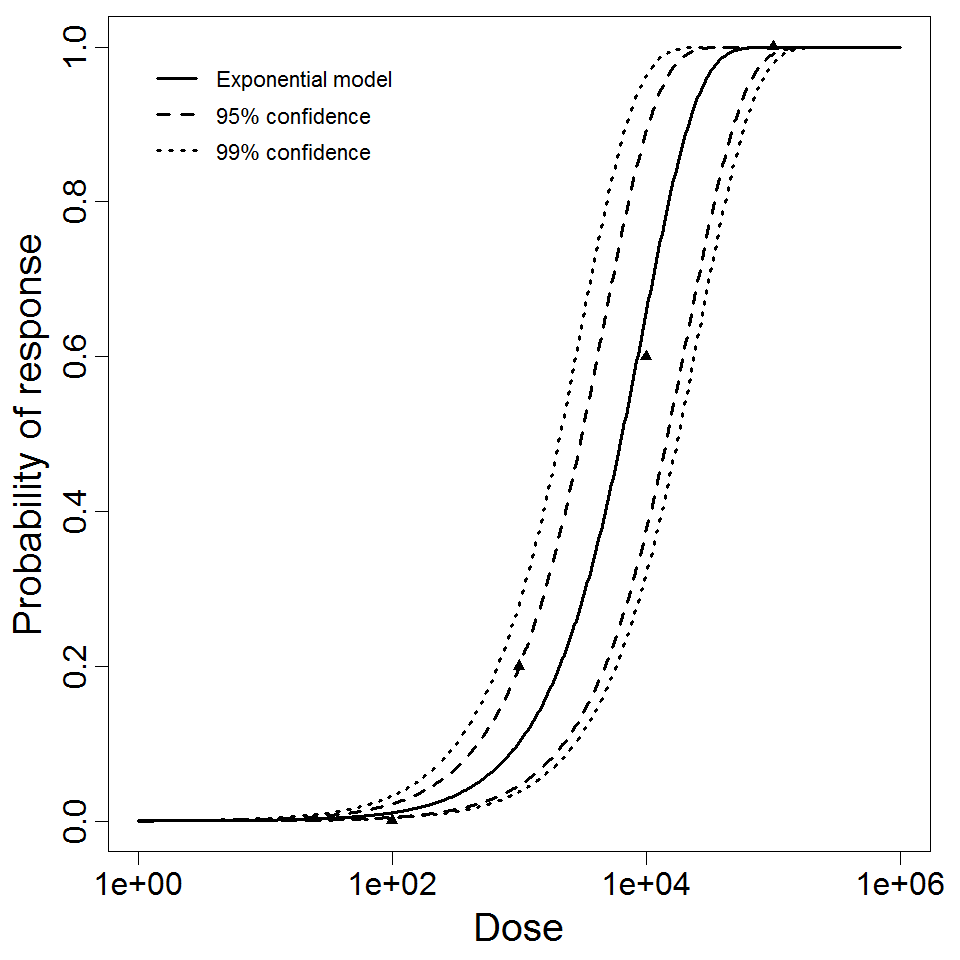
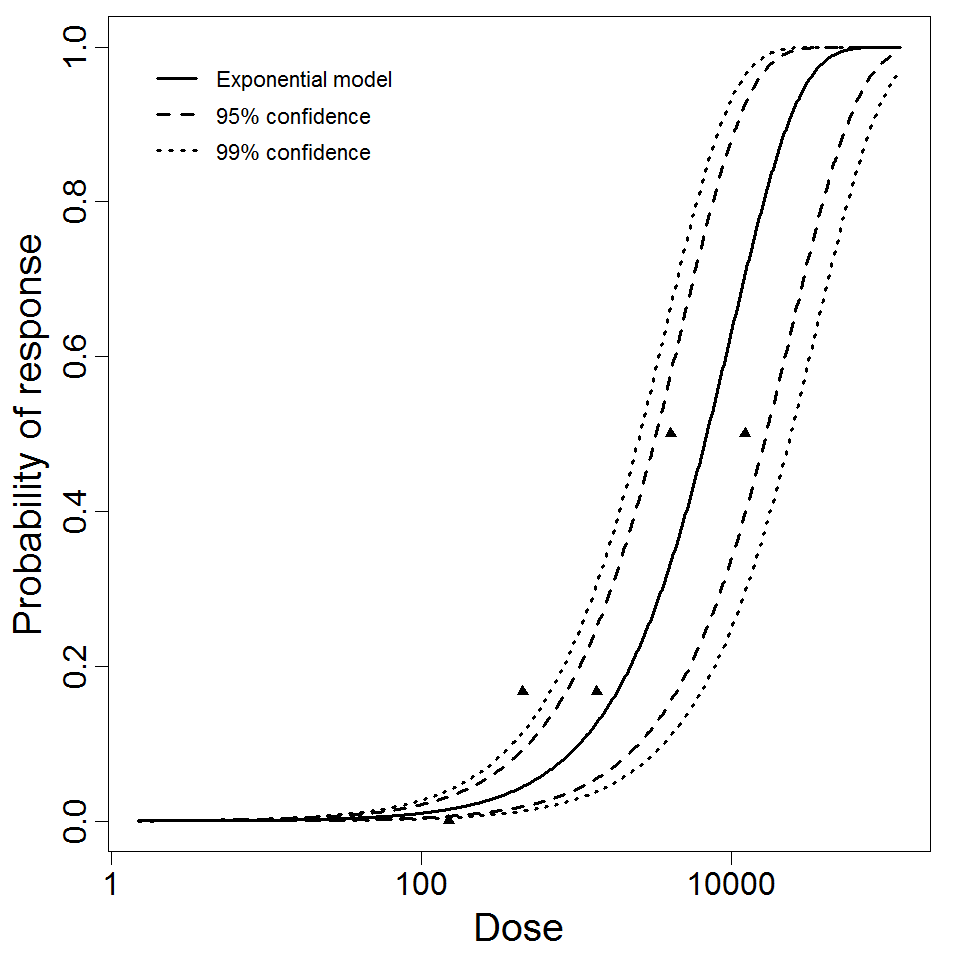
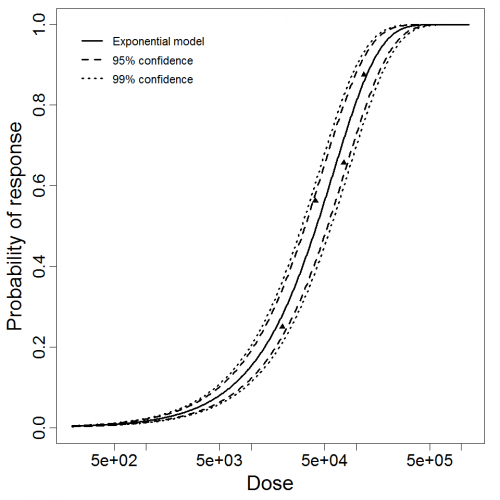
Exponential model plot, with confidence bounds around optimized model
# of Doses
4.00
Μodel
LD50/ID50
1.07E+04
Dose Units
Response
Exposure Route
Contains Preferred Model
k
6.48E-05
Agent Strain
strain 74/81
Experiment ID
242
Host type
Description
|
|
||||||||||||||||||||||
|
||||||||||||||||||||||||||||||||||||||
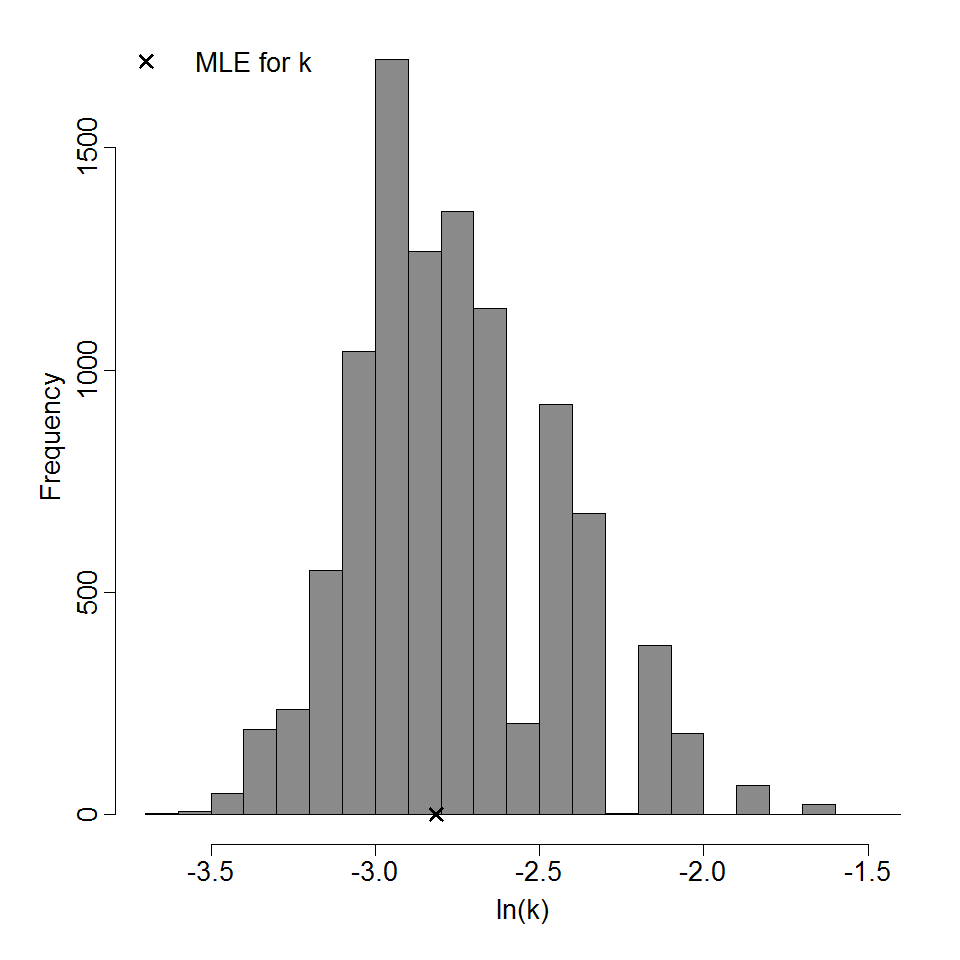
Parameter histogram for exponential model (uncertainty of the parameter)
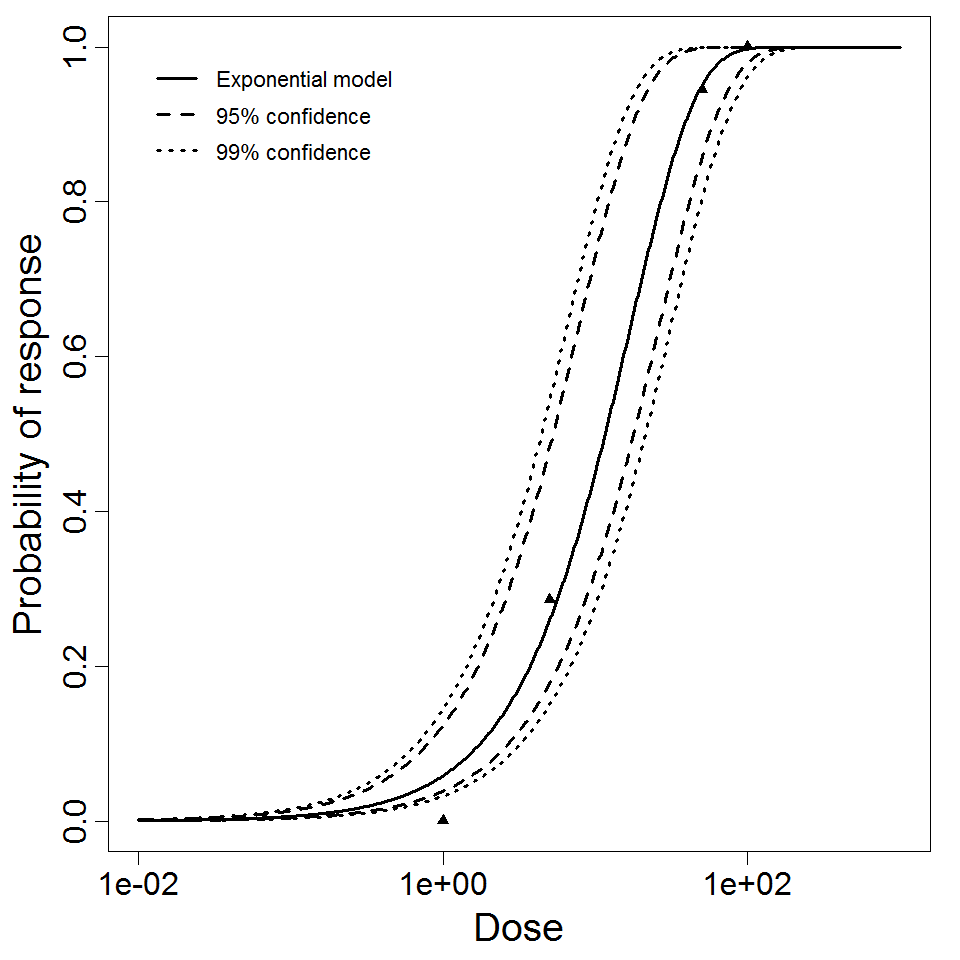
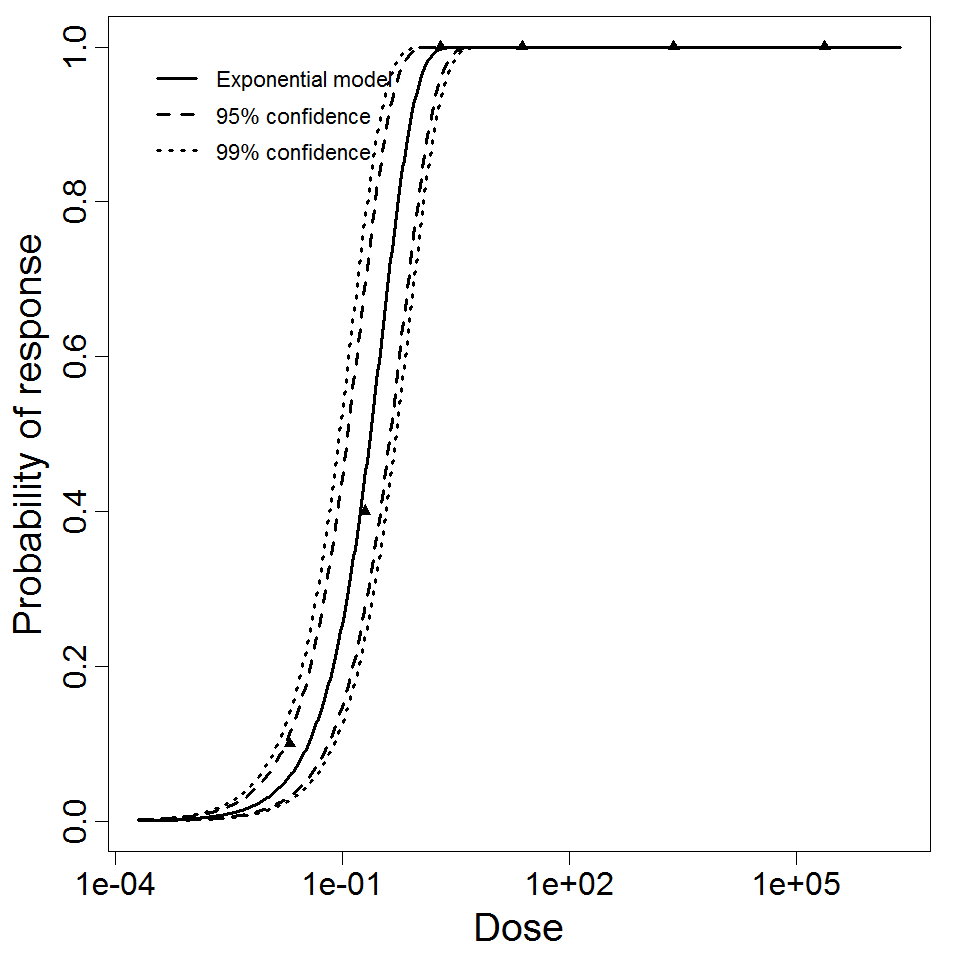
Exponential model plot, with confidence bounds around optimized model
# of Doses
4.00
Μodel
LD50/ID50
1.16E+01
Dose Units
Response
Exposure Route
Contains Preferred Model
k
5.99E-02
Agent Strain
Philadelphia 1
Experiment ID
241
Host type
Description
|
|
||||||||||||||||||||||
|
||||||||||||||||||||||||||||||||||||||

Parameter histogram for exponential model (uncertainty of the parameter)

Exponential model plot, with confidence bounds around optimized model
# of Doses
3.00
Μodel
LD50/ID50
1.74E+05
Dose Units
Response
Exposure Route
Contains Preferred Model
k
3.97E-06
Agent Strain
*Salmonella newport*
Experiment ID
235
Host type
Description
|
|
||||||||||||||||||||||
|
||||||||||||||||||||||||||||||||||||||
Parameter histogram for exponential model (uncertainty of the parameter)
Exponential model plot, with confidence bounds around optimized model
# of Doses
4.00
Μodel
LD50/ID50
6.47E+03
Dose Units
Response
Exposure Route
Contains Preferred Model
k
1.07E-04
Agent Strain
KIM D27
Experiment ID
2
Host type
Description
|
| ||||||||||||||||||||||
| ||||||||||||||||||||||||||||||||||||||

# of Doses
5.00
Μodel
LD50/ID50
6.92E+03
Dose Units
Response
Exposure Route
Contains Preferred Model
k
1.00E-04
Agent Strain
KHW
Experiment ID
18
Host type
Experiment Dataset
Description
|
| ||||||||||||||||||||||
| ||||||||||||||||||||||||||||||||||||||
# of Doses
5.00
Μodel
LD50/ID50
6.63E+01
Dose Units
Response
Exposure Route
Contains Preferred Model
k
1.04E-02
Agent Strain
KHW
Experiment ID
17
Host type
Experiment Dataset
Description
|
| ||||||||||||||||||||||
| ||||||||||||||||||||||||||||||||||||||


# of Doses
13.00
Μodel
LD50/ID50
3.56E+05
Dose Units
Response
Exposure Route
Contains Preferred Model
k
1.95E-06
Agent Strain
EPEC E2348/69 (O127:H6)
Experiment ID
154, 156, 158, 160, 219, 220, 221
Host type
Experiment Dataset
Description
|
|
||||||||||||||||||||||
|
||||||||||||||||||||||||||||||||||||||

Exponential model plot, with confidence bounds around optimized model

Parameter histogram for exponential model (uncertainty of the parameter)
# of Doses
4.00
Μodel
LD50/ID50
1.21E+01
Dose Units
Response
Exposure Route
Contains Preferred Model
k
5.72E-02
Agent Strain
TAMU isolate
Experiment ID
140
Host type
Description
|
|
||||||||||||||||||||||
|
||||||||||||||||||||||||||||||||||||||

Parameter histogram for exponential model (uncertainty of the parameter)

Exponential model plot, with confidence bounds around optimized model
# of Doses
8.00
Μodel
LD50/ID50
1.32E+02
Dose Units
Response
Exposure Route
Contains Preferred Model
k
5.26E-03
Agent Strain
Iowa isolate
Experiment ID
139
Host type
Description
|
|
||||||||||||||||||||||
|
||||||||||||||||||||||||||||||||||||||

Parameter histogram for exponential model (uncertainty of the parameter)
Exponential model plot, with confidence bounds around optimized model
# of Doses
6.00
Μodel
LD50/ID50
2.35E-01
Dose Units
Response
Exposure Route
Contains Preferred Model
k
2.95E+00
Agent Strain
Josiah strain
Experiment ID
13
Host type