$$P(response)=1-[1+dose\frac{2^{\frac{1}{a}}-1}{N^{50}} ]^{-a}$$
# of Doses
5.00
Μodel
N50
4.67E+07
LD50/ID50
4.67E+07
Dose Units
Response
Exposure Route
Contains Preferred Model
Status
fitted
a
0.0936
Experiment ID
290
Host type
Experiment Dataset
# of Doses
8.00
Μodel
N50
8.26E+08
LD50/ID50
8.26E+08
Dose Units
Response
Exposure Route
Contains Preferred Model
Status
fitted
a
0.04
Experiment ID
289
Host type
Experiment Dataset
Description
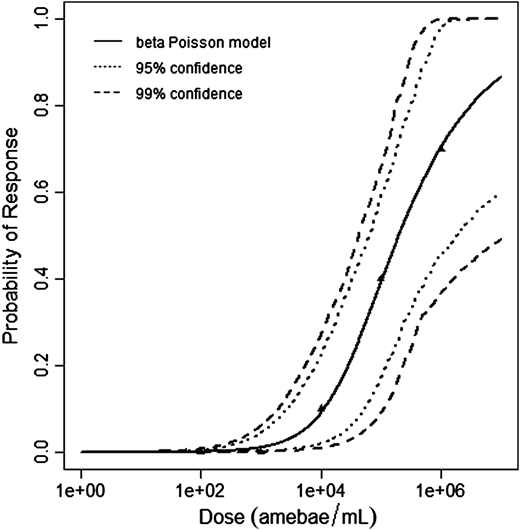
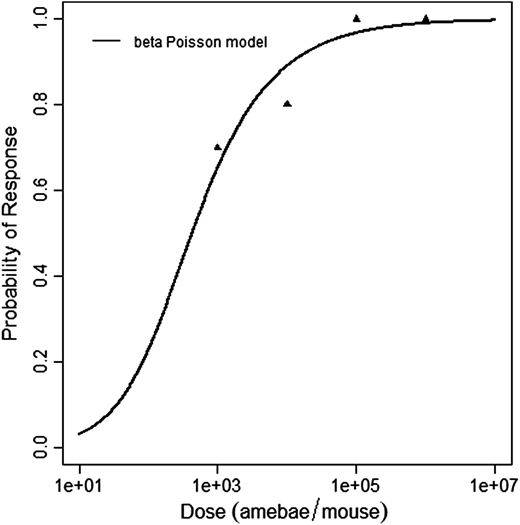
Červa (1967a,b) studied white mice of the Czechoslovak H-strain weighing 13-15 grams inoculated intranasally by placing 0.02 mL of the A1 strain of Acanthamoeba over the nares of the ethyl-ether anesthetized mice (Cerva, 1967b).
The beta-Poisson model provided the best fit to the data.
Cerva, L. (1967b). Intranasal, Intrapulmonary, and Intracardial Inoculation of Experimental Animals with Hartmanella castellanii. Folia Parasitologica (Praha), 14, 207–215.
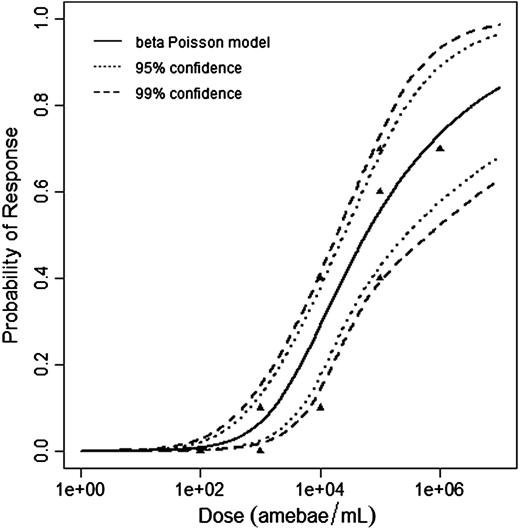
# of Doses
6.00
Μodel
N50
14,690 or 14,538
Dose Units
Response
Exposure Route
Contains Preferred Model
Status
fitted
a
0.161
Agent Strain
A. culbertsoni (A1)
Experiment ID
Acanth_Intranasal1
Host type
Experiment Dataset
| Dose (no. of organisms) | Positive Response | Negative Response | Total Subjects/Responses |
|---|---|---|---|
| 3 | 0 | 20 | 20 |
| 30 | 2 | 18 | 20 |
| 300 | 1 | 19 | 20 |
| 3000 | 9 | 11 | 20 |
Description
|
|
Host
CD1 Mice
# of Doses
13.00
Μodel
N50
5.79E+04
LD50/ID50
5.79E+04
Dose Units
Response
Exposure Route
Contains Preferred Model
Status
pooled
a
0.226
Experiment ID
954,955,956,957
Experiment Dataset
Description
|
| ||||||||||||||||||||||
Host
CD1 Mice
# of Doses
4.00
Μodel
N50
1.98E+04
LD50/ID50
1.98E+04
Dose Units
Response
Exposure Route
Contains Preferred Model
Status
fitted
a
0.35
Agent Strain
LEE
Experiment ID
957
Experiment Dataset
Description
|
| ||||||||||||||||||||||
Host
CD1 Mice
# of Doses
4.00
Μodel
N50
3.05E+04
LD50/ID50
3.05E+04
Dose Units
Response
Exposure Route
Contains Preferred Model
Status
fitted
a
0.241
Agent Strain
LEE
Experiment ID
956
Experiment Dataset
Description
|
| ||||||||||||||||||||||
Host
CD1 Mice
# of Doses
5.00
Μodel
N50
1.99E+05
LD50/ID50
1.99E+05
Dose Units
Response
Exposure Route
Contains Preferred Model
Status
fitted
a
0.353
Agent Strain
LEE
Experiment ID
955
Experiment Dataset
Description
|
| ||||||||||||||||||||||
# of Doses
4.00
Μodel
N50
422
LD50/ID50
422
Dose Units
Response
Exposure Route
Contains Preferred Model
Status
fitted
a
0.536
Experiment ID
954
Host type
Experiment Dataset
Description
Host
Male golden Syrian hamsters/12 weeks
# of Doses
3.00
Μodel
N50
7.93E+8
LD50/ID50
7.93E+8
Dose Units
Response
Exposure Route
Contains Preferred Model
Status
fitted
a
0.048
Agent Strain
MAC serotype 8 (Human-derived, AIDS Patient)
Experiment ID
myco_intratracheal_2
Host type
Experiment Dataset
Description
Host
Male golden Syrian hamsters/12 weeks
# of Doses
3.00
Μodel
N50
1.42E+8
LD50/ID50
1.42E+8
Dose Units
Response
Exposure Route
Contains Preferred Model
Status
fitted
a
0.201
k
4.87E-9
Agent Strain
MAC serotype 8 (Human-derived, AIDS Patient)
Experiment ID
myco_intratracheal
Host type
Experiment Dataset