$$P(response)=1-[1+dose\frac{2^{\frac{1}{a}}-1}{N^{50}} ]^{-a}$$
Description
Host
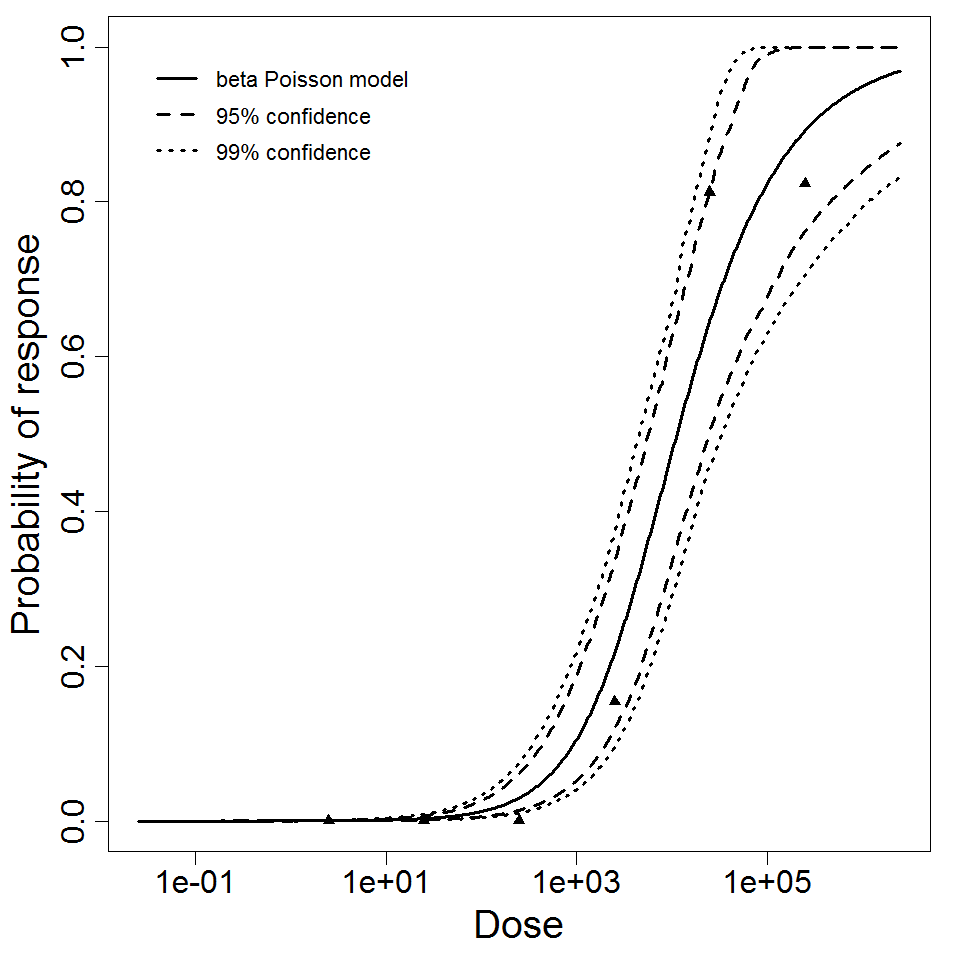
black-spotted and spiny frogs
# of Doses
7.00
Μodel
N50
2.37E+05 [1.06E+05, 5.49E+05], β = 86,351 [16,154, 632,550]
LD50/ID50
2.37E+05 [1.06E+05, 5.49E+05]
Dose Units
Response
Exposure Route
Contains Preferred Model
Status
pooled
a
0.52 [0.27, 1.53]
Experiment ID
ek_ pooled
Description
Host
Spiny Frogs
# of Doses
4.00
Μodel
N50
4.23E+08 (β = 137,348)
LD50/ID50
4.23E+08
Dose Units
Response
Exposure Route
Contains Preferred Model
Status
fitted
a
0.72
Agent Strain
E. miricola
Experiment ID
ek_intraperitoneal
Experiment Dataset
Description
| Model | Deviance | Δ | Degrees of freedom |
χ20.95,1 p-value |
χ20.95,m-k p-value |
| Exponential | 9.88 | 6.48 | 5 | 3.84 0.011 |
11.1 0.0788 |
| beta Poisson | 3.4 | 4 | 9.49 0.494 |
||
| beta-Poisson fits better than exponential; can not reject good fit for beta-Poisson | |||||
| Parameter | MLE Estimate | 0.5% | 2.5% | 5% | 95% | 97.5% | 99.5% |
| α | 6.95E-01 | 2.69E-01 | 3.39E-01 | 3.78E-01 | 2.56E+0 | 2.28E+01 | 1.18E+03 |
| N50 | 3.39E+03 | 3.58E+01 | 2.47E+02 | 4.67E+02 | 1.09E+04 | 1.26E+04 | 1.85E+04 |
Host
C57Bl/6J mice
# of Doses
6.00
Μodel
N50
277
Dose Units
Response
Exposure Route
Contains Preferred Model
Status
fitted
a
0.253
Agent Strain
F5817
Experiment ID
292
Experiment Dataset
| Dose (CFU) | Infected | Non-Infected | Total |
|---|---|---|---|
| 5500 | 7 | 3 | 10 |
| 32400 | 7 | 3 | 10 |
| 55000 | 9 | 1 | 10 |
| 251000 | 10 | 0 | 10 |
| 550000 | 10 | 0 | 10 |
| 2820000 | 10 | 0 | 10 |
Description
|
|
||||||||||||||||||||||
|
||||||||||||||||||||||||||||||
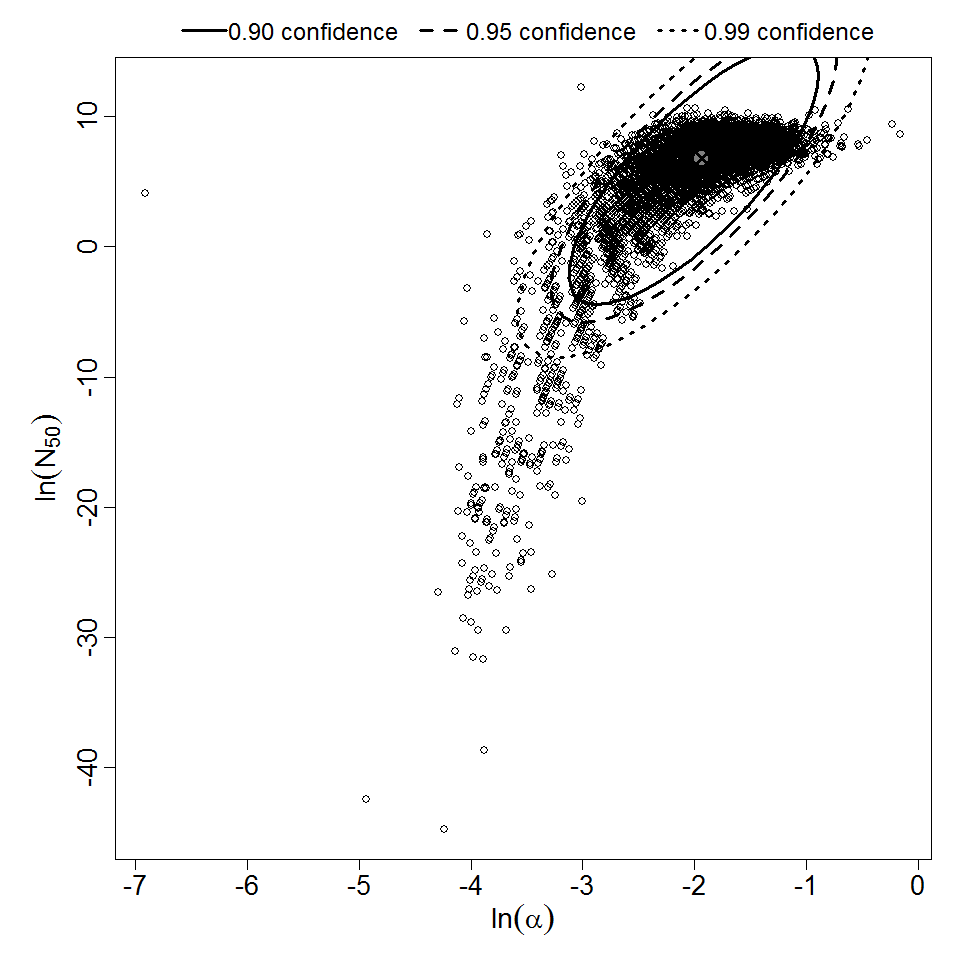
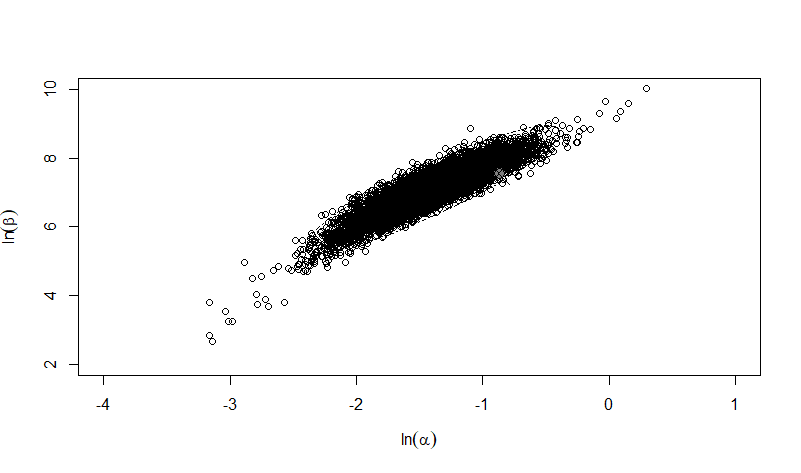
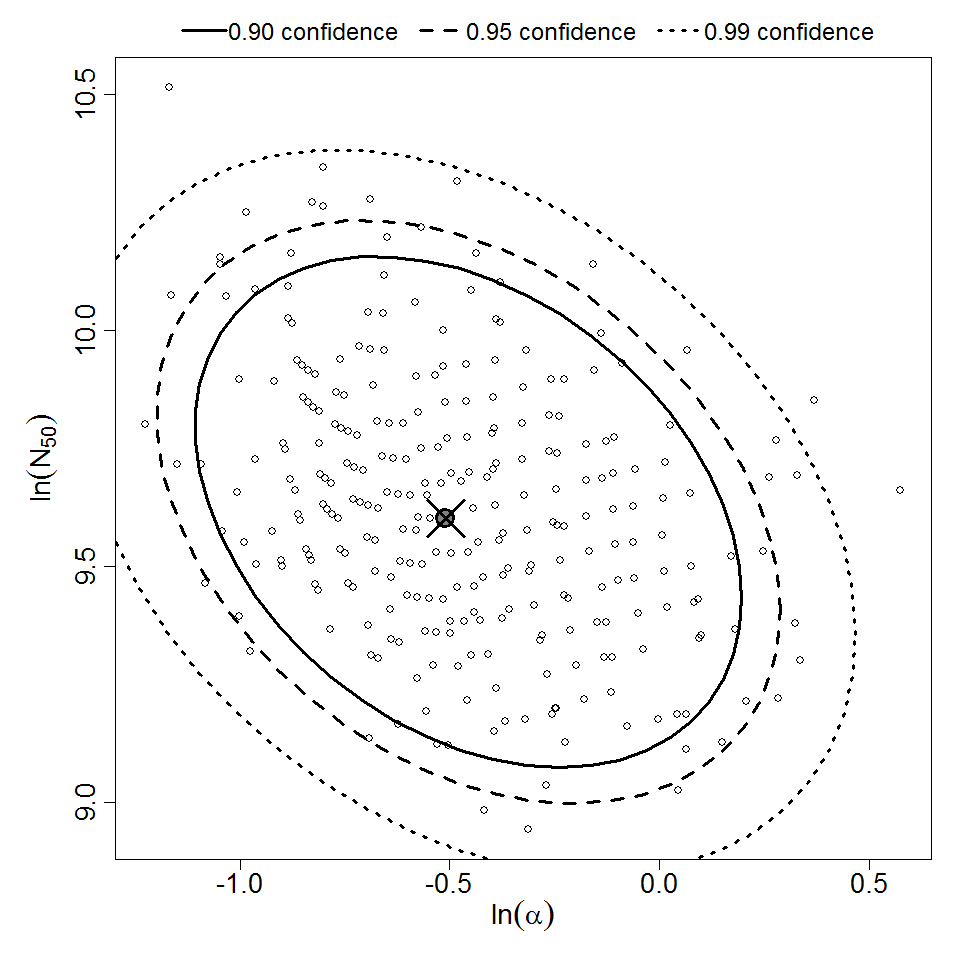
Parameter scatter plot for beta Poisson model ellipses signify the 0.9, 0.95 and 0.99 confidence of the parameters.
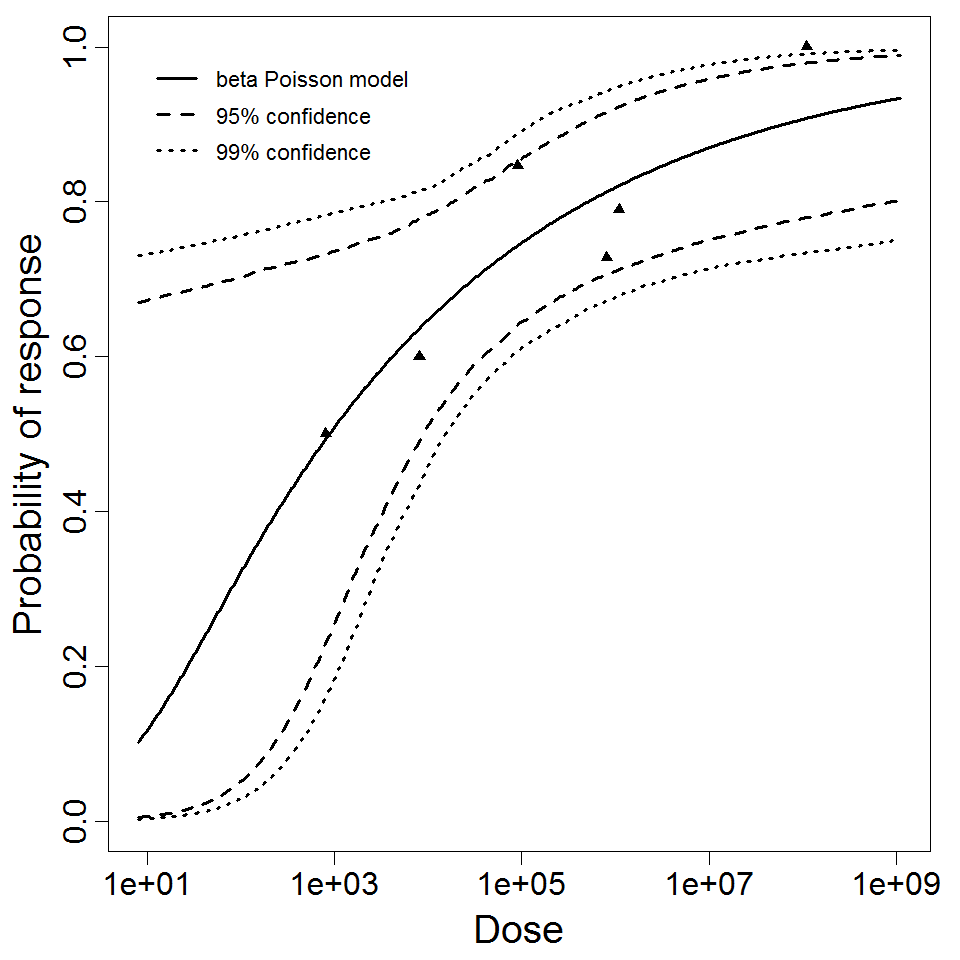
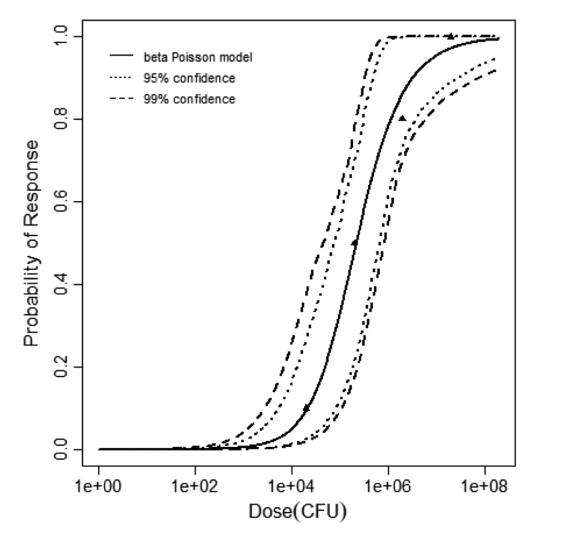
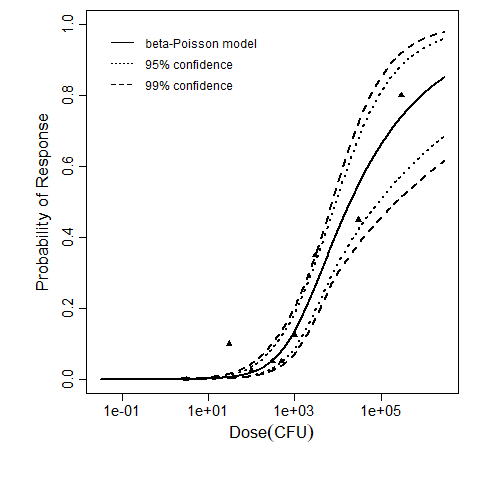
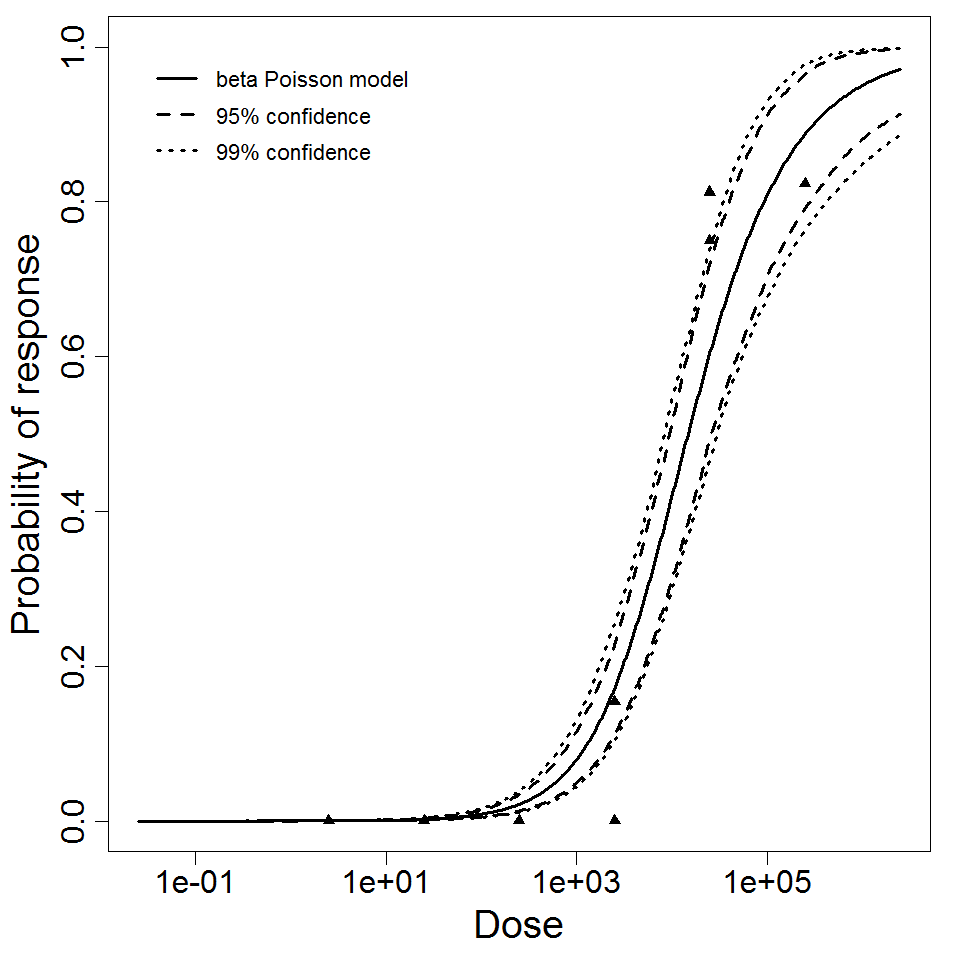
beta Poisson model plot, with confidence bounds around optimized model
# of Doses
3.00
Μodel
N50
1.23E+05
LD50/ID50
1.23E+05
Dose Units
Response
Exposure Route
Contains Preferred Model
a
1.66E-01
Agent Strain
strain 81-176
Experiment ID
188
Host type
Description
|
|
||||||||||||||||||||||
|
||||||||||||||||||||||||||||||
Parameter scatter plot for beta Poisson model ellipses signify the 0.9, 0.95 and 0.99 confidence of the parameters.
beta Poisson model plot, with confidence bounds around optimized model
# of Doses
5.00
Μodel
N50
3.14E+04
LD50/ID50
3.14E+04
Dose Units
Response
Exposure Route
Contains Preferred Model
a
1.17E-01
Agent Strain
type strain for serotype PEN 3
Experiment ID
186
Host type
Description
|
|
||||||||||||||||||||||
|
||||||||||||||||||||||||||||||
Parameter scatter plot for beta Poisson model ellipses signify the 0.9, 0.95 and 0.99 confidence of the parameters.
beta Poisson model plot, with confidence bounds around optimized model
# of Doses
5.00
Μodel
N50
6.68E+04
LD50/ID50
6.68E+04
Dose Units
Response
Exposure Route
Contains Preferred Model
a
3.19E-01
Agent Strain
type strain for serotype PEN 2
Experiment ID
185
Host type
Description
|
|
||||||||||||||||||||||
|
||||||||||||||||||||||||||||||
Parameter scatter plot for beta Poisson model ellipses signify the 0.9, 0.95 and 0.99 confidence of the parameters.
beta Poisson model plot, with confidence bounds around optimized model
# of Doses
6.00
Μodel
N50
8.9E+02
LD50/ID50
8.9E+02
Dose Units
Response
Exposure Route
Contains Preferred Model
a
1.44E-01
Agent Strain
strain A3249
Experiment ID
106
Host type
Description
The same exposure route and endpoint was evaluated for Experiments 3 and 4 (Cerva, 1967b; Culbertson et al. 1966)[6] [5]. A pooling analysis was attempted and successful. The beta-Poisson model provided a good fit to the pooled data and is shown below in Figure 1. Note: both the exact and approximate beta-Poisson models were fit to the data. The figures shown below and the csv file of bootstrapped parameter replicates are for the best fitting parameters of the exact beta-Poisson model. The successful pooling of multiple datasets generally increases the confidence in the estimated model parameters.
[6] Cerva, L. (1967b). Intranasal, Intrapulmonary, and Intracardial Inoculation of Experimental Animals with Hartmanella castellanii. Folia Parasitologica (Praha), 14, 207–215.
[5] Culbertson, C. G., Ensminger, P. W., & Overton, W. M. (1966). Hartmannella (Acanthamoeba): Experimental Chronic, Granulomatous Brain Infections Produced by New Isolates of Low Virulence. The American Journal of Clinical Pathology, 46(3), 305–314.
# of Doses
9.00
Μodel
N50
19357
Dose Units
Response
Exposure Route
Contains Preferred Model
Status
pooled
Resampled Parameters
a
0.245
Agent Strain
A. castellanii HN-3 and A culbertsoni A1
Experiment ID
Acanth_Intranasal_Pooled
Host type
Experiment Dataset
Description
|
||||||||||||||||||||||
|
||||||||||||||||||||||||||||||
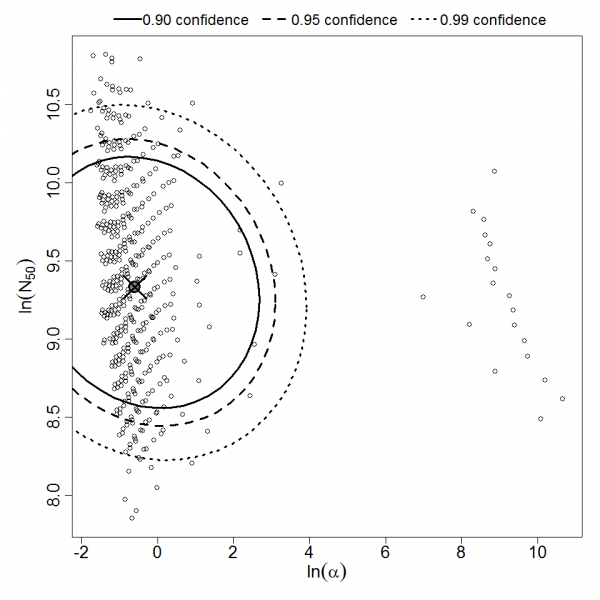
Parameter scatter plot for beta Poisson model ellipses signify the 0.9, 0.95 and 0.99 confidence of the parameters.
beta Poisson model plot, with confidence bounds around optimized model
# of Doses
12.00
Μodel
N50
1.48E+04
LD50/ID50
1.48E+04
Dose Units
Response
Exposure Route
Contains Preferred Model
a
6.01E-01
Agent Strain
ATCC 19660
Experiment ID
283,284
Host type
Description
|
|
||||||||||||||||||||||
|
||||||||||||||||||||||||||||||
Parameter scatter plot for beta Poisson model ellipses signify the 0.9, 0.95 and 0.99 confidence of the parameters.
beta Poisson model plot, with confidence bounds around optimized model
# of Doses
6.00
Μodel
N50
1.13E+04
LD50/ID50
1.13E+04
Dose Units
Response
Exposure Route
Contains Preferred Model
a
5.49E-01
Agent Strain
ATCC 19660
Experiment ID
284
Host type